
 ?Mathematical formulae have been encoded as MathML and are displayed in this HTML version using MathJax in order to improve their display. Uncheck the box to turn MathJax off. This feature requires Javascript. Click on a formula to zoom.
1. Introduction
The torque generation capacities of a human body are fundamental factors governing human movement. They are often assessed for human performance, as well as in musculoskeletal modelling. In such models, scaling individual strength generation capacities is challenging but can provide physiologically meaningful data. Basically, models are fitted to isokinetic measurements of joint torques in different angle and angular velocity conditions.
Assuming muscles are viscoelastic actuators, their entire architectures contribute to Joint Torque-Angle and Torque-Velocity Relationships (JTAR and JTVR respectively, and their coupling JTAVR) at the joint level. On one side, experimental observation at different scales (muscle sarcomere, muscle fibre and joint) resulted in various JTAR models available in the literature. On the other side, JVTR models are often modelled without obvious physiological consistency. Recently, a new JTVR model was proposed increasing physiological transparency of the elbow JTAVR (Haering et al. Citation2019), but those results might be joint-specific.
The current study aimed at evaluating five JTAR and two JTVR models on the knee flexion and extension of 27 participants at maximal intensity.
2. Materials and methods
2.1. Data collection
Twenty-seven healthy males (25.9 ± 4.5 years; 1.8 ± 0.1 m; 75 ± 11.6 kg) gave their consent for the study (CPP SOOM I, France no. 2018-A00484-51). Participants seated with their dominant leg alongside a Con-Trex MJ® isokinetic dynamometer (CMV AG, Dübendorf, Switzerland). The dynamometer axis was aligned with the knee epicondyles in flexion at 90°. Tight straps immobilized the thigh and the shank. Range of motion was adjusted to the subject. Goniometric measurements were used to calibrate angular values. After a warm-up, five maximal voluntary knee flexions and extensions hold for four seconds at angles equally spaced through the range of motion were recorded as isometric trials. Then, three repetitions of concentric isokinetic trials were recorded at 60°.s−1, 120°.s−1, and 180°.s−1 in flexion and extension. Participants were strongly encouraged to produce maximal torque values.
2.2. Joint torque-angle-velocity relationships
As previously described in (Haering et al. Citation2019), five JTAR were used as Quadratic, Cosine, Cubic, Sinus-exponential, Normal models computing the isometric torque for a given angle
defined by:
(1)
(1)
Isometric parameters of JTAR are the maximal isometric torque the optimal joint angle
and the maximal range of isometric force production RoM.
Two JTVR were used as Anderson-based (Anderson et al. Citation2007) and Power-based (Haering et al. Citation2019) to compute the concentric torque for a given angular velocity
It was defined by:
(2)
(2)
For the Anderson-based model, concentric parameters were velocity at 75% of maximal isometric torque and ratio between velocities at 50% and 75% of maximal isometric torque. For the Power-based model, concentric parameters
of were maximal concentric velocity and velocity at maximal power.
2.3. Parameters identifications
A least-square-curve-fitting method (trust-region algorithm, Matlab® Optimization ToolboxTM) minimized the quadratic distance between modelled and experimental torques, optimizing successively isometric and concentric parameters
and
in a two-steps optimization.
2.4. Model evaluation
Root mean square errors (RMSE) between modelled and experimental knee flexion/extension torques were computed for each JTAR models and for each combination of JTAR and JTVR models. Identified JTVR parameters of models were compared. A two-way ANOVA was performed between Anderson-based and Power-based RMSE for each JTAR to evaluate the effect of JTVR models on RMSE.
3. Results and discussion
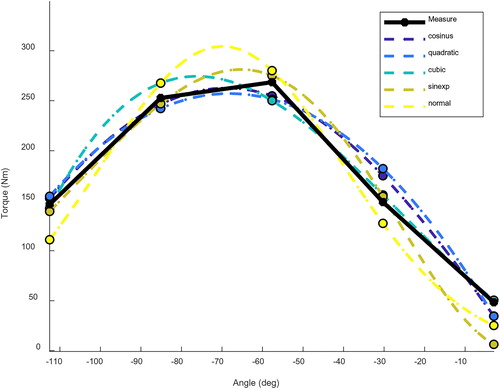
Concerning the JTAR models, differences in fitting experimental data were observed in . The lowest RMSE were displayed for the two symmetrical models (quadratic and cosine) for flexion and extension. The quadratic and cosine JTAR appeared as the most accurate and adaptable model on the large cohort, as for the elbow joint. Mean RMSE of cosine JTAR model were the lowest in extension. RMSE were higher because of higher experimental torques, compared to previous study on the elbow.
Figure 1. Torque-Angle- models fitting of a typical participant for knee extension.
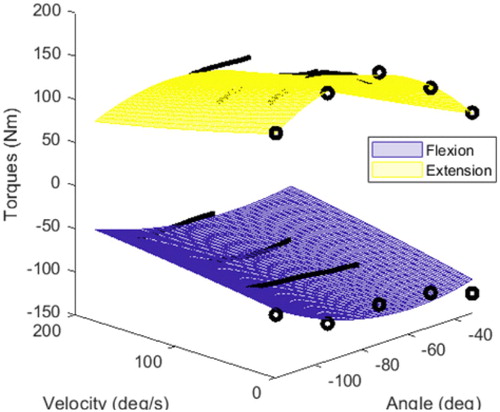
Concerning the JTVR models, differences in fitting were also observed: an example is provided . Knee flexion RMSE were lower than knee extension. The Anderson-based model displayed lower RMSE than the Power-based model in flexion and extension. Mean velocities at 75% of maximal isometric torque identified among participants were between 65.3 and 101.4 deg/s (cubic and sinus-exp) in flexion, and between 38.1 and 55.3 deg/s (normal and cubic) in extension. Mean ratios between velocities at 50% and 75% of maximal isometric torque were between 3.24 and 3.75 (sinus-exp and normal) in flexion, and between 3.9 and 4 (cosine and normal) in extension. The Power-based model displayed the highest RMSE in mean for flexion (not significant p > 0.05) and extension (significant p < 0.05). Mean maximal concentric velocities computed among participants were between 979.7 and 1455 deg/s (normal and sinus-exp) in flexion, and between 702 and 853 deg/s (normal and cubic) in extension. Mean velocities at maximal power were between 251.9 and 448.7 deg/s (cubic and sinus-exp) in flexion, and between 175.6 and 213.5 deg/s (normal and cubic).
Figure 2. Knee flexion/extension Torque-Angle-Velocity fitting of a typical subject with the quadratic JTAR and the Power-based JTVR. Black dots and lines correspond to isometric and isokinetic measures.
The velocity at maximal power, also called optimal velocity is a widely used criterion of human performance (McDaniel et al. Citation2014). Thus, the Power-based model provide an insightful model to link dynamometric measurements to human performance.
4. Conclusions
Five JTAR and two JTVR were compared when fitting dynamometric measurements of the knee. While a quadratic and cosine JTAR model fitted best the isometric data, the recently proposed Power-based JTVR increased physiological transparency for human performance without decreasing the data fitting.
Table 1. Knee flexion/extension mean RMSE between modelled and experimental maximal torques for the five JTAR and two JTVR models (Anderson-based and Power-based).
References
- Anderson D. E, Madigan M. L, Nussbaum M. A. 2007. Maximum voluntary joint torque as a function of joint angle and angular velocity: model development and application to the lower limb. J. Biomech. 40(14) :3105–3111.
- Haering D, Pontonnier C, Bideau N, Nicolas G, Dumont G. 2019. Using torque-angle and torque-velocity models to characterize elbow mechanical function: modeling and applied aspects. J Biomech Eng. 141(8):084501.
- McDaniel J, Behjani N. S, Elmer S. J, Brown N. A. T, Martin J. C. 2014. 2014, Joint-specific power-pedaling rate relationships during maximal cycling. J Appl Biomech. 30(3):423–430.