
 ?Mathematical formulae have been encoded as MathML and are displayed in this HTML version using MathJax in order to improve their display. Uncheck the box to turn MathJax off. This feature requires Javascript. Click on a formula to zoom.
1. Introduction
In pole vaulting, performance is related to the amount of mechanical energy when crossing the bar, itself mainly explained by the amount of mechanical energy at the end of the run-up and the energy gain during the pole support phase (Arampatzis et al. Citation2004). Therefore, it is crucial for athletes to achieve their run-up with the highest manageable speed to simultaneously plant the pole with the expected position of the last foot support. Recently, Needham et al. (Citation2018) showed that irrespective of the skill level, some pole vaulters were able to regulate their approach run to achieve a desired take-off location while others presented low levels of variability during the approach phase. When the regulation occurred, it essentially appeared during the penultimate and last stride of the approach run.
While Needham et al. (Citation2018) found a higher rate of successful jumps for the athletes able to regulate their approach, there is currently no evidence with regards to the effectiveness of the subsequent phases of the pole vault. Therefore, the purpose of this study was to determine the influence of the pattern of locomotor regulation on the efficiency of take-off and pole support phases.
2. Methods
2.1. Participants
Jumps during official national (Youth and Elite 2018 French Championships) and international (All Star Perche 2018) events from 26 male pole vaulters (75.0 ± 8.3 kg; 183 ± 6 cm, personal best from 4.70 to 6.16 m) were analysed. For each athlete, the three best successful jumps were retained for the study, for a total of 123 recorded trials ranging from 4.40 to 5.93 m.
2.2. Measurements
The toe-to-plant box distances during the last 9 foot supports were recorded with an Optojump Next system (Microgate, Bolzano, Italy) placed each side of official lane (20-m length). A radar gun Stalker Pro II (Stalker ltd, Plano, United states) was placed behind the landing mat in the run-up direction to capture flow speed in MookyStalker software (Matsport, Saint-Ismier, France). The synchronization with the Optojump Next system allowed calculating the horizontal take-off speed (TOS in m/s). Also, a 2dimensional video motion capture, from the penultimate foot support to bar clearance, was performed by a high-speed high resolution camera (100 Hz, Panasonic HC-V770, Osaka, Japan) placed at 25-m distance perpendicular to the sagittal plane of motion. In each video, the pole vaulter body motion was subsequently digitized with Skillspector© software (Video4coach, Svendborg, Denmark) to calculate the horizontal and vertical positions of its centre of mass (Frère et al. Citation2017).
2.3. Data processing
As previously described (Needham et al. Citation2018), the between-trial variability of the toe-to-plant box distance was assessed via the standard deviation of each footfall location (SDff, in m). A post-hoc classification of the participants was performed based on the patterns of SDff defined as follows:
Ascending/Descending (A/D) pattern (i.e., an increase followed by a marked decrease in SDff values while approaching the plant box);
Descending Only (DO) pattern; • Ascending Only (AO) pattern;
Random Fluctuations (RF) pattern. The first two patterns were considered as regulators while the last two others as non-regulators.
From the Optojump Next outcomes, the difference in stride length between the penultimate and last stride (ΔSL, in m) was computed.
Horizontal and vertical positions of the body centre of mass were derived to obtain the respective velocities allowing to compute the mechanical energy of the athlete as follows:
were m was the body mass, v and h the resultant velocity and height of the centre of mass, respectively. Then, the gain in mechanical energy (Egain, in J/kg) was calculated as the difference between the amount of energy at bar clearance and the energy at the last foot strike.
2.4. Statistics
Changes in SDff values among the last 9 foot supports were assessed with a Friedman ANOVA for each group of athletes. Post-hoc pairwise comparisons between successive foot supports were performed with Wilcoxon tests, with a corrected p-value of significance (p < 0.05/8). Also, distributions of performances (in m), TOS, SDff of the last foot support, ΔSL, and Egain were compared between the regulator and non-regulator pole vaulters by means of U Mann-Whitney tests (significance: p < 0.05).
3. Results and discussion
Eighteen athletes demonstrated a regulator pattern (5 A/D and 13 DO) and 8 demonstrated a non-regulator pattern (4 AO and 4 RF). As previously found (Needham et al., Citation2018) a majority of pole vaulters regulated their locomotor approach to achieve the take-off foot position. A decreasing SDff value among the last 9 foot supports has been found for the regulator group (χ2(8) = 76.2, p < 0.001) while not for the non-regulator group (χ2(8) = 11.9, p = 0.157; ). Onset of regulation occurred markedly around the -3 foot strike before take-off for the regulator group, while no specific foot strike could be identified for the non-regulator group. These results were also in line with previous data. However, none of the regulation patterns led to a higher precision to locate the take-off foot from the plant box ().
Figure 1. Changes in footfall variability during the approach phase for the regulator (white dots) and non-regulator (black dots) athletes. Data are means (± SD). *: significant difference with p < 0.00625.
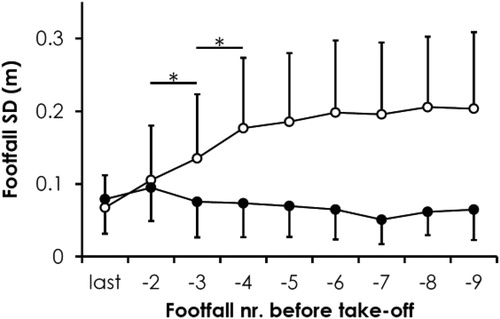
Table 1. Differences in take-off and pole support phases between regulator and non-regulator athletes (means ± SD).
Between-groups comparisons led to non-significant differences either for the pole vault performance or all other studied parameters (). Our results relative to the performance agreed with the literature, as it was found that the pattern of locomotor regulation could be irrespective of the skill level (Needham et al. Citation2018). Moreover, our additional results further highlighted that the approach strategy (regulator vs. non-regulator) did not corroborate with another strategy during the following phases of the pole vault. In other words, the pattern of locomotor regulation had no effect on the balance between the mechanical energy at take-off and the gain in energy to achieve a high amount of mechanical energy when clearing the crossbar.
4. Conclusions
Our results support that regulation pattern during the approach run has no influence in the effectiveness of the take-off and pole support phases and therefore does not affect the final performance for male pole vaulters.
Acknowledgements
The authors are grateful to the French Athletics Federation and organisation of the All Star Perche for authorisation and assistance during measurements.
Additional information
Funding
References
- Arampatzis A, Schade F, Brüggemann GP. 2004. Effect of the pole-human body interaction on pole vaulting performance. J Biomech. 37(9):1353–1360.
- Frère J, Sanchez H, Vanhaesebrouck R, Homo S, Cassirame J. 2017. Concurrent validity of a simplified model to compute energetic parameters in the pole vault. Proceedings of the 17th International ACAPS Conference; Oct 29-31; Dijon, France.
- Needham L, Exell TA, Bezodis IN, Irwin G. 2018. Patterns of locomotor regulation during the pole vault approach phase. J Sports Sci. 36(15):1742–1748.