
 ?Mathematical formulae have been encoded as MathML and are displayed in this HTML version using MathJax in order to improve their display. Uncheck the box to turn MathJax off. This feature requires Javascript. Click on a formula to zoom.
1. Introduction
Running is a mostly periodic activity. Hence, it seems natural to use the harmonic components as gait features. We use the Fourier decomposition of the time series of the gait features as the basis from which to extract the fundamental and higher order harmonics. Intuitively, the magnitude measured at the fundamental frequency is a measure of the overall change undergone by the corresponding feature, and the relative phase between different time series is an indication of the time delay between the different features. The higher harmonics measured with respect to the fundamental harmonic describe the nonsinusoidal but still periodic trajectory that a feature undergoes.
While the fundamental harmonic components capture the majority of the information, they do not capture the subtle variations in the dynamics of different features. Higher harmonics are needed to capture these variations. Intuitively, the magnitude of the fundamental frequency together with the magnitude of the second harmonic and the phase of the second harmonic relative to the fundamental frequency provide a translation independent description of a signal that contains only first and second harmonics. We do not look beyond the second harmonic because the sampling rate and the amount of noise in the gait analysis makes higher harmonic components unstable.
2. Methods
2.1. Participants
Twelve male runners who were free from musculoskeletal injury volunteered to take part in this study. The runners had a mean age of 30.3 (±4.9) years, stature 178.3 (±5.7) cm, and body mass 77.7 (±8.5) kg respectively. Participants were active recreational runners engaging in training at least two times per week whilst completing a minimum of 20 km per week and had previous experience of treadmill running. Participants encompassed a range of foot strike characteristics.
An a priori power analysis was conducted using the Hopkins method based on a moderate effect size and a power measure of 80%, which suggested that 12 subjects were adequate for the design. The study was approved by the University of Reims ChampagneArdennes and the Alleray-Labrouste clinic. All participants provided a written informed consent.
2.2. Material
A commercial ForceDistribution Measurement Treadmill (FDM-T, Zebris®, Germany) with an appropriate conveyor belt (1500 mm long × 500 mm wide) was used. The driving system provides a range from 0 to 22 kmh−1 (by minimum increments of 0.1 km/h). For a treading area of 150 x 50 cm the sensor unit has more than 5,000 capacitive pressure/force sensors.
One inertial sensor (HIKOB FOX®) was used which contained a tri-axial accelerometer with a sample rate ranging from 0 Hz to 1.3 kHz. Research has indicated that the tibia is chosen as a placement site to reduce the effect of angular acceleration and rotational movement. The MEMS gyroscope was placed on the skin using adhesive strapping band.
2.3. Procedures
Participants were given a 5 minutes’ adaptation period, in which participants ran at the determined velocity of 3.3 m/s. The treadmill was then stopped for 30 s and participants dismounted the treadmill before mounting the treadmill for data recording in accordance with the recommendation of Alton et al. (1998). When participants indicated that they were ready to begin, the treadmill was restarted and the velocity of the belt was gradually increased until the speed reached 2.2 m/s (BF 8 and C8) for a first recording of 30 s then the speed was again increased to reach 3.3 m/s (BF 11 and C11) for a second recording of 30 s. Each participant performed a trial shod (C) and a trial barefoot (BF). During both trials the accelerometer placed on the distal anteromedial portion of the tibia collects the data on the 3 axis acceleration measure.
3. Results and discussion
For this comparative study of the qualitative and quantitative data we have used at first a frequency analysis enabling us to determine the fundamental frequency.
We then performed the calculation of Grms. The metric of Grms is typically used to specify and compare the energy in repetitive shock vibration systems. Repetitive shock (RS) vibration systems produce a continuously varying pseudorandom broad spectrum vibration. The root mean square (rms) value of this signal can be calculated by squaring the magnitude of the signal at every point, finding the average (mean) value of the squared magnitude, then taking the square root of the average value. The resulting number is the Grms metric.
The Grms signal is described as a time domain measurement, it is typically thought of as a frequency domain measurement taken from the Power Spectrum curve. When Grms is calculated using Power Spectrum information it is often thought of as the area under the curve of the Power Spectrum display. More accurately, it is the square root of the integral of the Power Spectrum.
n frequency in Hz and T duration of the signal
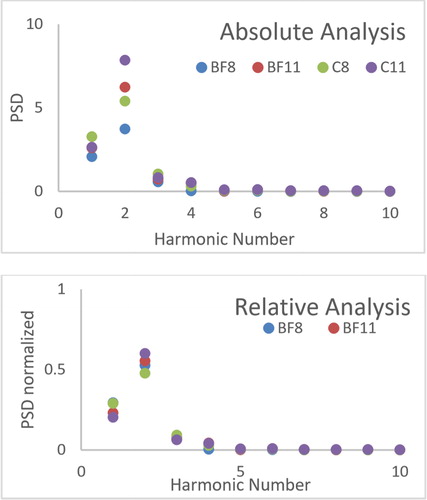
In order to compare the content of the signals in frequency quality and to overcome the fundamental differences in frequency, we normalized each PSD on the fundamental frequency to enable us to compare the harmonic’s content.
4. Conclusion
The area of the peaks is represented as a function of the harmonic number. The area is either normalized to the complete area (relative analysis) or not (absolute analysis). There is a clear difference between the shod running git analysis (C8 and C11) and the barefoot running gait analysis (B8 and B11). There is a clear rise for the shod analysis on the 2nd harmonic. The energy at 3.3 m/s is also much more important. The purpose of this research was to determine the agreement between a single inertial sensor and an accepted method to measure running gait specifically foot strike pattern and whether this agreement varies with increasing velocity and whether is shod or barefoot.
Figure 1. MEMS placement.
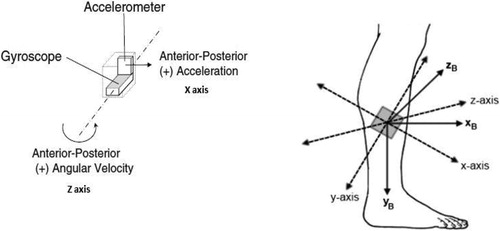
Figure 2. Fundamental and Grms calculation.
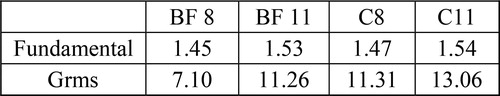
Figure 3. Harmonic analysis.
References
- Tong K, Granat MH. 1999. A practical gait analysis system using gyroscopes. Med Eng Phys. 21(2):87–94.
- Dierick F, Penta M, Renaut D, Detrembleur C. 2004. A force measuring treadmill in clinical gait analysis. Gait Post. 20(3):299–303.
- Tom N, Novacheck T. 1998. The biomechanics of running. Gait Post. 7:77–95.
- Lilly L. 2003. Gait analysis for classification. Massachusetts institute of technology — artificial intelligence laboratory. AI technical report.