
1. Introduction
A cerebral aneurysm (CA) is a pathological and localized deformation of the artery wall in an intracranial blood vessel. Due to this abnormality, the artery’s wall is fragile and the risk of ripping the wall increases. A rupture of a CA leads to a brain hemorrhage being critical for the patient’s health. CA hemodynamics has been related to aneurysm growth and its rupture. Those have been studied through computational fluid dynamics simulations (CFD), improving the prediction of success or failure of each endovascular treatment due to patient-specific anatomic models and realistic boundary conditions. The computational model to represent the coil in the aneurysm has been simplified as a homogenous porous medium. Levitt et al. (Citation2016) showed that this simplification is not realistic enough, and the CFD results do not match the ones obtained while using the real geometry of the coil. A first study considering the heterogeneity of the porous medium was performed (Yadollahi-Farsani et al. Citation2019) but the coil’s geometry used was generated by a program, therefore the results need to be validated by a real geometry. The goal of the present work is to characterize spatial heterogeneity of the coil inside the aneurysmal sac through image analysis using pictures from patients and to define its consequences on the permeability.
2. Methods
2.1. Aneurysm model and images acquisition
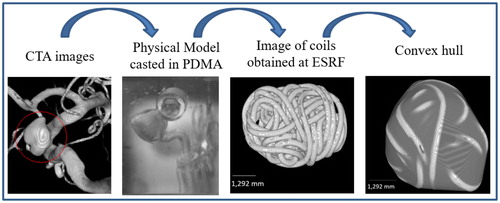
Patients having CA and treated with coil embolization were enrolled for this part of the study at the University of Washington’s Harborview Medical Center in Seattle, which also provided the computed tomography (CT) scans of the patients before surgery. A virtual 3D model of the aneurysm and the vessels were made from segmented CT images. An acrylonitrile butadiene styrene model of the artery was created at a 1:1 scale by a 3D printer and then cast in a clear polyester resin (PDMA, Clear-Lite; TAP plastics, USA). The surgeon who performed the endovascular surgery on the patient inserted on the vessels’ reproduction the same number of coils using the same procedure as what he had executed on the patient. The coils used are produced by Stryker. The PDMA models were imaged at the European Synchrotron Radiation Facility (Grenoble). The model was scanned before and after coiling.
2.2. Porosity study
The raw images were then segmented using Image J (Fiji), the coil segmentation was verified by comparing the volume calculated numerically from the scans, with the one obtained from the coils technical specification.
In order to study the porous media, an artificial sac was created using the convex hull function in Matlab (MathWorks, Inc., USA), which build an envelope around the coil as the aneurysmal sac does. This convex hull allows to study the porosity distribution within an artificial sac in a systematic way, avoiding the difficulty to define the sac at the aneurysmal neck. shows the steps of the method from the CT scan to the convex hull envelope.
Figure 1. Summary of the method: starting with the CTA image on the left, and finishing with results of image analysis.
The porosity distribution and gradients within the artificial sac were then investigated following two ways: (i) firstly, porosity profiles have been computed along the three main inertial axes of the coil, (ii) secondly, a 3D map of the aneurysm’s porosity was set. The image of the coil and the artificial sac was divided into cubes, and the porosity of each cube was calculated. The length of the cube’s edge ranges from 2d to 4d, where d is the diameter of the coils in the CA.
3. Results and discussion
Porosity profiles have been computed on the 3D images of coils deployed in five patients. The obtained results for two of those patients, A and B are presented in . Both coils present a similar shape, which is confirmed by the similar results presented. The mean porosity within the artificial sac is very large (around 0.8) and a slightly higher than the one targeted by the surgeon. The gradients of porosity variate between 0.16 and 2.7%/mm with a mean of 1.2%/mm. The aspect ratios, given by a/c and b/c, where a, b and c is the length along the minor, median and major inertia axis respectively, are the order of 0.76. Even if shows that highest gradients of porosity (around 2.9%/mm) are along the major axis, for the patient D, its highest gradient of porosity is on the median axis, therefore we cannot conclude that in the longest axis the variation of porosity is the highest.
Table 1. Porosity profiles for patient A and B.
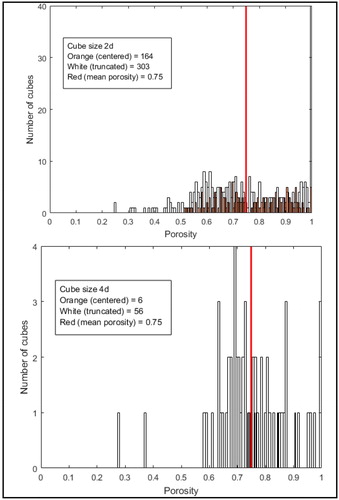
The results of the second study (porosity’s map) are presented in for the patient A, which represents the number of cubes having the same porosity for a cube’s edge measuring twice and four times the diameter of the coil. White bars represent the truncated cubes located at the edge of the CA, the orange lines represent the cubes located in the center of aneurysmal sac. The five patients studied presented similar results: for a cube edge equal to 2d, shows that the porosity in the center of the sac varies between 0.55 and 1, which is consistent with the previous results. The porosity of truncated cubes closes to the edge (convex hull surface) varies between 0.1 and 1. For a cube edge equal to 4d, as expected shows that the porosity in the center of the sac is more homogenous, but still ranges between 0.74 and 0.84. The porosity of truncated cubes close to the convex hull surface still widely varies between 0.27 and 1. Whatever the size of the cube under consideration, the porosity distribution with the sac is strongly heterogeneous, and must be considered in numerical further simulations.
Figure 2. Histogram of the porosity of the cubes for two size of cube’s side: 2d (up) and 4d (down) for patient A.
In order to see how these results affect the permeability of the porous media, one can use Happel’s (Citation1959) equation to estimate the transverse dimensionless intrinsic permeability (K/r2) of fibrous material, where K (m2) is the intrinsic permeability and r (m) is the radius of the coil. In the porosity range 0.6 to 0.95 (see ), this permeability varies between 0.06 and 5.00. The ratio between maximum and minimum values is almost 100 which demonstrates the strong heterogeneity of the permeability.
4. Conclusions
Two methods were done to estimate the porosity distribution and gradients within aneurysmal sac after coiling. They showed porosity distribution is strongly heterogeneous and might present strong gradients that will affect the permeability value. A permeability study in each patient is being done. These results will be used to propose a new model for the flow through the coil allowing to capture these heterogeneities.
References
- Happel J. 1959. Viscous flow relative to arrays of cylinders. AIChE J. 5(2):174–177.
- Levitt MR, Barbour MC, Rolland du Roscoat S, Geindreau C, Chivukula VK, McGah PM, Nerva JD, Morton RP, Kim LJ, Aliseda A. 2016. Computational fluid dynamics of cerebral aneurysm coiling using high-resolution and high-energy synchrotron X-ray microtomography: comparison with the homogenous porous medium approach. J NeuroIntervent Surg. 9:1–6.
- Yadollahi-Farsani H, Herrmann M, Frakes D, Chong B. 2019. A new method for simulating embolic coils as heterogeneous porous media. Cardiovasc Eng Tech. 10(1):32–45.