
 ?Mathematical formulae have been encoded as MathML and are displayed in this HTML version using MathJax in order to improve their display. Uncheck the box to turn MathJax off. This feature requires Javascript. Click on a formula to zoom.
1. Introduction
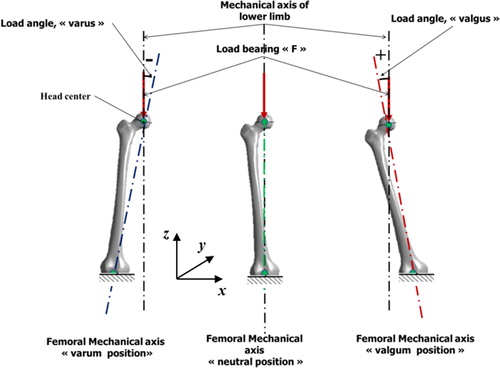
Lower limb alignment is an essential factor in the load transfer and in particular axial alignment (according to coronal and sagittal planes) for stress distribution and joint stability. Effects on the femur are very important for the clinical practice and orthopedic care to prevent fracture risks. Other factors have to be regarded for estimation of femoral fracture risk: bone mineral density, structure and geometry of a femur. Proximal femoral fracture or hip fracture is considered as the most serious result of osteoporosis among the elderly. The bone geometry influences proximal femoral stress distribution under given loading conditions (Voo et al. Citation2004), and that risk factors for cervical and trochanteric hip fractures differ. Contrariwise, the relationship between the direction loads, which results to the bad alignment of the extremity segments do not have been clarified.
This study aims to understand the stress concentration and to evaluate the hip fracture risk in relation with their dependence on loading direction caused by the deformity. For that, we propose a numerical approach to examine the influence of weight-bearing alignment of the lower limb on the femur and to evaluate the risk of fracture caused by the angle of deformation during two leg stance (standing) and for one loading in different alignment angles of lower member (normal and pathologic).
2. Methods
2.1. Geometries
Five specific numerical models of a femoral necks were developed in this work from CT-scans of five subjects (3 M/2F) with an age range from 60 to 88 years (mean 71.4 years). The geometries were identified and segmented from CT-scan image with 3 D Slicer Software (v4.6.2).
2.2. Mechanical analysis
The geometries were imported in ANSYS® (16.1, ANSYS, Inc., USA) to be mesh with quadratic tetrahedral elements (Belaid et al. Citation2018) and to perform a finite element analysis (FEA).
The elastic moduli of the models were assigned element-by-element basis assuming heterogeneity and isotropy (Morgan et al. Citation2003). We applied loading to simulate a tow leg stance, which corresponds to a joint contact force equal to half times the body weight and we tested five load directions (−10;−5;0;5;10°). presents the geometrical models according to alignment (varus and valgus positions) corresponding to tested boundary conditions.
Figure 1. Alignment and boundary conditions applied on the femur model.
The stress distribution in the models obtained by FEA was analysed in order to study mechanical effects in terms of rigidity and strength of the proximal femur for different coronal deformities.
3. Results and discussion
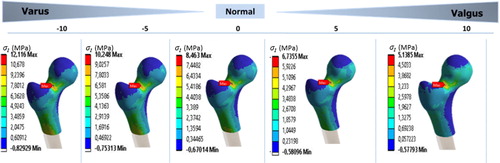
We observed principal stress components in the femoral neck according to the loading direction. shows an example of maximal principal stress in the proximal region for one model. The stress at the proximal femur changes by changing the varus/valgus angle. We found the smallest absolute stress at angle 10° and the highest absolute stress at angle −10°. By analyzing the other principal stress components, the third principal stress is higher and very much localized at the inferior of the neck when the first principal stress is at superior part of the neck. The superior and inferior surfaces of the femoral neck support tensile and compressive stresses, respectively.
Figure 2. Distribution of the first principal stress component () according to varus / valgus angle.
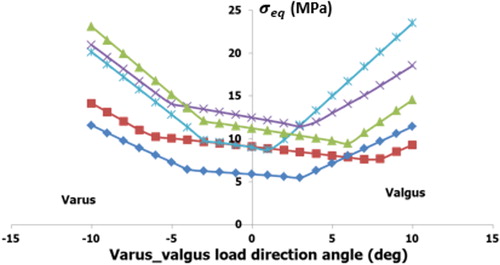
We observed similar stress distributions on the other models. presents the evolution of maximum equivalent stress (Von Mises) values according to the loading direction for all the specimens. The mean maximum von Mises stress value was 9.53 MPa (SD = 2.52 MPa) for 0°, 15.47 MPa (SD = 5.68 MPa) 10° and 17.96 MPa (SD = 4.87 MPa) higher for -10°.
Figure 3. Evolution of maximum von Mises stress values according to the varus/valgus angle for the 5 specimens.
Relative to the neutral position, varus configurations increase the absolute peak principal stress when the valgus configuration decreases the stress. The deformities influence the integrity and resistance of bones in presence of varus or valgus position (Filardi Citation2015). Principal stress results reveal the significant risk on the hip of the femur reached by the varus and configuration.
One limitation of this work is its pure numerical approach. We envisage the validation or corroboration of these results from experiments on anatomical specimens by imposing similar boundary conditions.
4. Conclusions
In this study, we proposed a numerical approach with personalized models to examine the influence of weight-bearing alignment of the lower limb on the femur and to evaluate the risk of fracture. The results demonstrate a clear dependence of the individual axial alignment on stress distribution at the proximal femur and their strength. The varus configuration increases the risk of the neck fracture.
This development could be very useful in clinical practice for example to discuss preventive osteotomy for osteoporotic patient to limit risk of a femoral neck fracture. For another application, we also could study potential apparition of fracture according to femoral axis and sport practice presenting risk (basketball, handball, jumps,…).
References
- Belaid D, Vendeuvre T, Bouchoucha A, Brémand F, Brèque C, Rigoard P, Germaneau A. 2018. Utility of cement injection to stabilize split-depression tibial plateau fracture by minimally invasive methods: A finite element analysis. Clin Biomech. 56:27–35.
- Filardi V. 2015. Stress shielding in the bony chain of leg in presence of varus or valgus knee. J Orthopaed. 12(2):102–110.
- Morgan EF, Bayraktar HH, Keaveny TM. 2003. Trabecular bone modulus–density relationships depend on anatomic site. J Biomech. 36(7):897–904.
- Voo L, Armand M, Kleinberger M. 2004. Stress fracture risk analysis of the human femur based on computational biomechanics. Johns Hopkins Apl Tech Dig. 25:8.