
1. Introduction
Show jumping is one of the most popular disciplines among equestrian sports. The prominent role of the horse’s hind limbs during the push-off phase at take-off was analysed by kinematics, but the corresponding forces were measured in only two studies, using a force plate. Schambardt et al. (Citation1993) used 5 ridden horses with minimal experience, to jump a 0.8 m high vertical fence, and an additional experienced horse, who jumped 1.1 and 1.3 m high fence. All horses approached the fence at canter. Individual force-time curves, as well as longitudinal (retardatory and propulsory) and vertical impulses and stance duration were presented, but not statistically analysed. In Dutto et al. (Citation2004), 5 horses not used to show jumping had to jump a single small (0.63 m) vertical fence; the approach gait was the trot and horses were not ridden. In this study, only average charts of the horizontal component of the ground reaction force (GRF) were presented, comparing take-off and trot. In both studies, the ground surface (force plate covered by a rubber mat) was different from those used during actual training or competition.
A dynamometric horseshoe (DHS) allows measuring the GRF, whatever the surface. The aim of the present study was therefore to measure, using a DHS, the forces and impulses applied to the hind limb of 3 horses at take-off, on an actual equestrian arena surface, and to investigate the effects of the fence’s height on the dynamic variables.
2. Methods
Three jumping horses (mean (SD): 556 (55) kg) clinically sound were used. After trimming, the right hind hoof of each horse was equipped with a DHS composed of 4 triaxial piezoelectric force sensors sandwiched between 2 aluminium plates (Chateau et al. Citation2009). A horseshoe with matching height and weight was fixed to the left hind, as well as to both fore hooves. DHS wires were connected to an A/D converter (NI-USB) plugged in a computer remotely controlled (Wi-Fi). Data were acquired at 7.8 kHz. The acquisition system was placed in saddle bags.
GRF was calculated as the sum of forces applied on each sensor and expressed in a local reference frame with the longitudinal X axis parallel to the solar plane of the shoe (positive forward), and the normal Z axis perpendicular to the solar plane (positive downward).
A T-square with 3 reflective markers was screwed on the right hind hoof. A high-speed camera (1000 Hz, Phantom v5.1, Vision Research), filming the right side of the horse at take-off, was placed at a distance of about 7 m from the middle of the recording corridor. Films were synchronized with DHS using the lighting of a LED placed on the right saddle bag.
In an outdoor jumping arena covered with microsand mixed with fibres (ProSol*, Toubin & Clément) a 10 m corridor was delimited with two parallel series of reflective markers (3.6 m apart) placed by pair face to face every meter. A vertical fence was placed mid-length of the corridor. After warming-up, each horse had to perform a total of 28 jumps of the fence, the height of which was successively increased then decreased (1.1, 1.2, 1.3, 1.4, 1.3, 1.2, 1.1 m), twice at each lead (right/left) canter, alternatively.
To delimit the stance phase, the threshold was set to a 100 N vertical force. Knowing the angle made by the right hind hoof with respect to the ground surface during stance (angle calculated using the two upper markers of the T-square, and those placed along the track), GRF on the right hind limb was projected in the track’s reference frame. Customised softwares developed in Matlab (MathWorks) were used to calculate stance and stride duration as well as peak forces and impulses (integral of force over time) in the track’s reference frame.
Linear mixed-effects regression models (SAS v.9.2) were used to test the association between dynamic variables and fence’s height, taken into account repetitions within a given horse, and adjusting for the lead (P < 0.05).
3. Results and discussion
Stance duration of the hind limb at take-off, 231 (23) ms in average, was not associated with fence’s height (p = 0.98). However, as stride duration increased with fence’s height (p < 0.0001; +33 ms every 10 cm of height’s increase), the relative stance duration (in % of stride duration) decreased (p < 0.0001).
Maximal horizontal force (Fxmax, also called maximal retardatory force) increased with fence’s height (p = 0.0001; +0.25 N/kg every 10 cm) (), as did the duration of the retardatory phase (during which Fx is positive; p < 0.0001).
Figure 1. Average charts of horizontal and vertical components of the ground reaction force applied to the right hind limb of 3 horses during take-off stance for jumping 1.1–1.4 m high fence, at canter (left and right leads averaged).
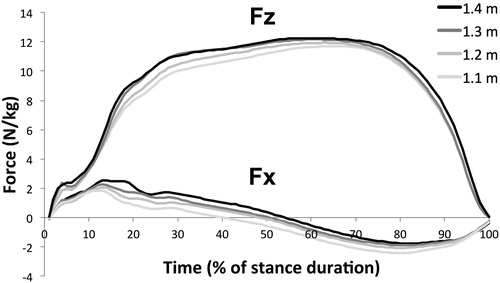
Minimal horizontal force (Fxmin, negative, or maximal propulsory force) increased (p < 0.0001; +0.22 N/kg every 10 cm), i.e., decreased in absolute value.
Maximal vertical force (Fzmax) increased with fence’s height (p = 0.001; +0.22 N/kg every 10 cm) ().
Fx and Fz impulses calculated during the retardatory phase significantly increased with fence’s height, whereas those calculated during propulsion (Fx negative) significantly decreased (for all impulses, p < 0.0001). These results are consistent with previous observations by Schamhardt et al. (Citation1993), although no statistical analysis was performed in this study comparing only 2 heights, on a single horse.
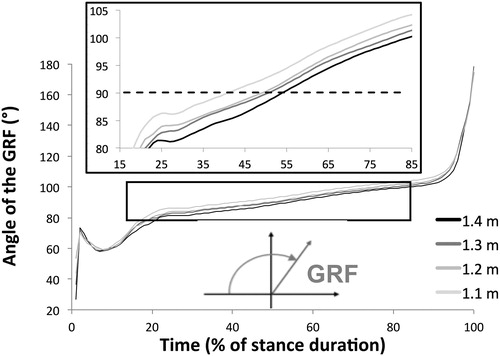
Dutto et al. (Citation2004) suggested that take-off (to jump 0.63 m) implies shorter retardatory phase, i.e., longer propulsion phase, and greater maximal propulsory force, compared to trotting. This is opposite to what was found here. Indeed, the necessity during take-off to convert horizontal velocity into upward velocity, all the more as fence is higher, is reflected by an increase in both retardatory phase duration and maximal retardatory force. GRF vector - the orientation of which was calculated from Fx and Fz values - is all the more oblique to the horizontal (i.e., small angle, ) as fence is higher, during the retardatory phase. During propulsion, Fx being all the more lower in absolute value, and Fz larger, as fence is higher, GRF vector is oriented all the more vertically (small angle, i.e., closer to 90°).
Figure 2. Average charts of the angle of the ground reaction force vector (right hind limb) to the horizontal, in 3 horses during take-off stance for jumping a 1.1–1.4 m high fence, at canter (left and right leads averaged). Inserts: zoom of the angle during central 70% of stance, and angle calculation convention. Dotted line: 90° (verticality of the GRF).
4. Conclusions
For the first time, hind limb forces were measured during take-off in horses under sport conditions (surface, fence up to 1.4 m). Preliminary results on 3 horses indicate that the retardatory phase is the most sensitive to fence’s height, which should be taken into account when training jumping horses, in order to avoid, if required (injury, pain), excessive stresses on the anatomical structures involved in this phase.
Additional information
Funding
References
- Chateau H, Robin D, Simonelli T, Pourcelot P, Falala S, Pacquet L, Denoix JM, Crevier-Denoix N. 2009. Design and validation of a dynamometric horseshoe for the measurement of 3D-GRF on a moving horse. J Biomech. 42(3):336–340.
- Dutto DJ, Hoyt DF, Clayton HM, Cogger EA, Wickler SJ. 2004. Moments and power generated by the horse hind limb during jumping. J Exp Biol. 207(4):667–674.
- Schambardt HC, Merkens H W, Vogel V, Willekens C. 1993. External loads of the limbs of jumping horses at the take-off and landing. Am J Vet Res. 54(5):675–680.