
1. Introduction
The identifications of fractures in cancellous bone using FE models became popular in the recent years. The most common FE methods are continuum level FE (Verhulp et al. Citation2006) models and high-resolution (HR-µCT) FE models (Hambli Citation2013). Considering the limitation in the above models, Pahr’s team has developed an enhanced FE model to improve the strength and fracture predictions in human femurs (whole bones) (Pahr and Zysset Citation2009; Luisier et al. Citation2014). In context to above, in order to study and predict the fracture in the cancellous bone at a micro-scale, it requires µFE models (that incorporate the full trabecular architecture and anisotropy). This indeed increases the computation cost and requires HR-µCT images. In addition, the results obtained from FE models are different from the experimental results.
Therefore, the goals of the present work are
To develop a fully automated algorithm to obtain continuum-based µFE model from the µCT images of cancellous bone using Morgan et al. (Citation2003) density-Young’s Modulus isotropic material card, hereafter named as FEiso.
To develop a high-resolution FE mesh model from µCT, hereafter termed as FEHR-µCT.
To investigate the two µFE models (FEHR-µCT and FEiso) to identify the strain localization and fractures in the cancellous bone and to compare with experimental results (Heaviside-Digital Volume Correlation (H-DVC) (Valle et al. Citation2019)).
2. Methods
A bovine tibia long bone was obtained from a local butcher, the slaughter age of cattle was about six months. The long bone was cleaned exhaustively with water and excess flesh and tissues were removed two days before the experiment. A cancellous bone was extracted from the proximal epiphysis region with dimensions of 9.44*8.66*10.5 mm3.
2.1. X-ray microtomography and digital volume correlation (HDVC)
The specimen was compressed within an X-ray microtomography device (tube voltage of 45 kV and tube current of 222μA) stepwise at six loading stages and used displacement controlled compression test.
For each loading stage, a set of 1155 images are recorded during rotation of the sample, step by step, over 360° and for reconstruction a resolution of 20 µm per voxel was used. In the present study, a Heaviside based DVC (H-DVC) (Valle et al. Citation2019) method was adapted using the sub-volume size of 48 voxels to measure the strain fields in the cancellous bone for the load step (load of 627 N and displacement of 1.2 mm).
2.2. µ-Finite element (FE) model
In the present study, two FE models were built:
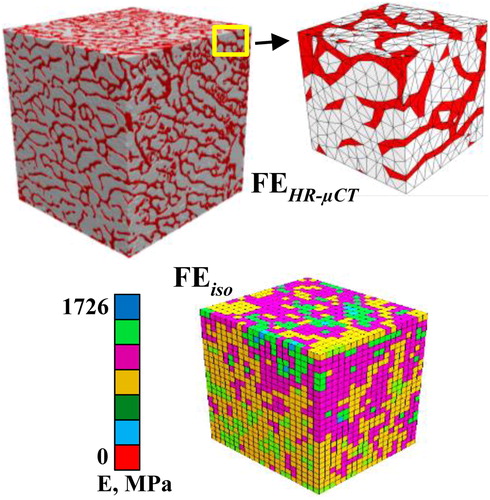
Model-I: a high-resolution FE model (FEHR-µCT) was developed using a commercial software (Simpleware), where the image segmentation tools were used to convert the images to volumes with a fine mesh (2.3M tetrahedral elements). The BV/TV of the sample was 0.18 and Young’s Modulus of 1277MPa ((calculated using relation (Morgan et al. Citation2003)) was assigned to the model.
Model-II: a voxel-based model (FEiso) was developed using a fully automated homebuilt algorithm. A thresholding technique is used to automate the segmentation and to convert the volume into voxels.
A total of 9500 hexahedral elements (48 voxel size) were generated for the given volume. These elements were evaluated separately to measure the BV/TV (ranged from 0.1-0.23). The corresponding Young’s modulus (ranged from 500 -1726MPa) evaluated using isotropic material card (using Morgan et al. Citation2003) and mapped to the FEiso model (as shown in ). A displacement of 1.2 mm was applied on the top face of the model. At the bottom face, the displacements in the direction of load were constrained and all other faces of the model were unconstrained.
Figure 1. FEHR-µCT model (top) with fine tetrahedral mesh and FEiso model (bottom) with hexahedral mesh and the color map corresponds to Young’s Modulus.
3. Results and discussion
shows distributions of equivalent strain field obtained from experimental measurements (H-DVC) and from the two FE models. For the same computer configuration, the FEiso & FEHR-µCT models took 5 and 40 minutes respectively for analysis using ANSYS. We have successfully modeled voxel-based µFE models from HR-µCT images and compared the results with experimental results to identify the local fracture. From (white arrow), it was observed that the FEiso model was able to identify the major crack when compared to FEHR-µCT model.
Figure 2. Von mises strain maps plotted for the three models (FEiso, H-DVC, and FEHR-µCT) respectively (the white arrows indicate the fracture zones (high strain zones)).
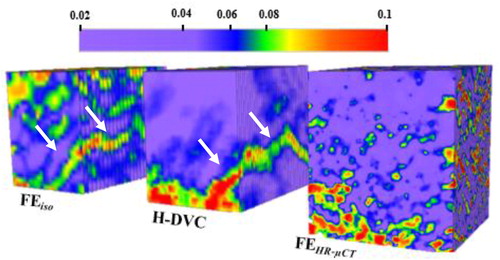
However, there is an over-evaluation of local strain at the top part of the specimen. This is probably due to the anisotropic behavior in the cancellous bone as shown in . Therefore, an anisotropic model (FEaniso) will be developed further considering the anisotropic behavior of the bone, which can be a valuable tool to predict the fracture in bones.
4. Conclusion
In the present study, a full automated voxel-based µFE model (FEiso) was developed for evaluating the strain fields in the cancellous bone. However, more simulations have to be performed considering different load stages using anisotropic FE model and to compare with the experimental results (obtained using H-DVC) to have better understanding of the fracture evaluation in cancellous bone.
References
- Hambli R. 2013. Micro-CT finite element model and experimental validation of trabecular bone damage and fracture. Bone. 56(2):363–374.
- Luisier B, Dall'Ara E, Pahr DH. 2014. Orthotropic HR-pQCT-based FE models improve strength predictions for stance but not for side-way fall loading compared to isotropic QCT-based FE models of human femurs. J Mech Behav Biomed Mater. 32:287–299.
- Morgan EF, Bayraktar HH, Keaveny TM. 2003. Trabecular bone modulus–density relationships depend on anatomic site. J Biomech. 36(7):897–904.
- Pahr DH, Zysset PK. 2009. A comparison of enhanced continuum FE with micro FE models of human vertebral bodies. J Biomech. 42(4):455–462.
- Valle V, Bokam P, Germaneau A, Hedan S. 2019. New Development of Digital Volume Correlation for the Study of Fractured Materials. Exp Mech. 59(1):1–15. Valle V et al, Exp Mech, 59: 1-15, 2019.
- Verhulp E, van Rietbergen B, Huiskes R. 2006. Comparison of micro-level and continuum-level voxel models of the proximal femur. J Biomech. 39(16):2951–2957.