
 ?Mathematical formulae have been encoded as MathML and are displayed in this HTML version using MathJax in order to improve their display. Uncheck the box to turn MathJax off. This feature requires Javascript. Click on a formula to zoom.
Keywords:
1. Introduction
Aortic dissection results in a disruption of the intima layer of the aortic wall. As the tear extends a false lumen (FL) adjacent to the true one opens and blood flows in between the wall layers. True and false lumens are separated by the dissected layer named flap. Aortic dissections are divided into type A, involving the ascending aorta, and type B, which does not. Except for specific cases showing rupture, ischemia, persistent pain…, uncomplicated type B dissections are medically treated with generally good immediate results. Nevertheless, 20% to 50% of the patients present aneurysmal evolution with a risk of rupture and high mortality. The present work focuses on patients with residual type B dissection who underwent an initial surgery to replace the ascending aorta by a prosthesis. The long-term goal is to identify cases with unfavorable evolutionary risk since actual clinical criteria used to assess adverse developments are not completely sufficient. In the present work, the flow behavior within patient specific model is analyzed using numerical modeling with and without fluid structure interactions (FSI). The aim is to determine if FSI modeling provides further insight into how the pathology could evolve.
2. Methods
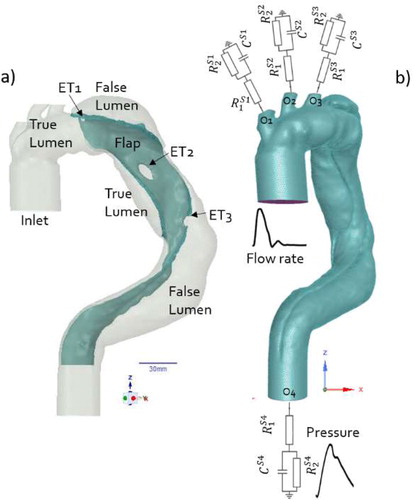
Three dimensional geometry of residual type B dissection was reconstructed from CT scans (Timone hospital, Marseille) of a patient with an unfavorable evolution (). The geometry included the entire aorta from the aortic root (inlet) to the celiac trunk (O4) and the three branches, O1, O2, O3, of the aortic arch. FSI numerical simulations (ANSYS Workbench) were achieved on different follow up times. Highlight was done on the time just after surgical repair (T0). At this time, 3 entry tears (ET) were observed (). The fluid domain mesh () was constituted of 1,276,255 mixed tetrahedral elements and five prismatic layers within the boundary layer thickness. The solid domain meshes (wall, prosthesis, and flap) were constituted of 541,715 tetrahedral elements with about three elements within their thickness. Flow is 3D, unsteady, and laminar. The blood was modeled as an incompressible fluid with shear-thinning behavior using Carreau–Yasuda model. Based on Olufsen et al. (Citation2000) flow rate, unsteady velocity profiles were set at the inlet (Womersley solution). Three-element, Windkessel models were employed at each outlet with parameters tuned to fit physiological pressure ().
Figure 1. (a) Patient specific geometry at T0. (b) Fluid boundaries conditions and mesh.
The values of mean Reynolds number, with
mean velocity at inlet, D the inlet diameter (4 cm), ρ the constant fluid density (1060 kg/m3), and
dynamic viscosity at high shear rate (0.0035 Pa.s), was equal to 1279. The frequency parameter,
was 27.6 (ω = 2π/T with T = 1 s). Prosthesis, flap, and aortic wall were rigid, and no slip boundary conditions were applied at the wall in case of simulation without FSI.
To account for the initial wall stress state, in the FSI case, we ran a pre-simulation with 80 mmHg static pressure loading, corresponding to diastolic pressure value. The displacements at the inlet and celiac trunk outlet (O4) were constrained to zero. The axial displacements at the 3 aortic arch outlets were constrained to zero while the radial one was free.
The thickness of the wall was constant and set to 2.5 mm. That of the flap was variable and about 1.85 mm. The prosthesis replacing the ascending aorta was modeled with a linear and isotropic law. Its Young modulus, Epr, was equal to 3100 MPa (Love Citation2017). Deplano et al. (Citation2019) showed that flap behaved as linear and anisotropic material and it is well known that the mechanical behavior of aortic wall is nonlinear and anisotropic. Simplifications were done to minimize computational time and we assumed that aortic wall and flap had a linear isotropic behavior. Their Young modulus, Ea = 5.39 MPa and Ef = 0.51 MP, respectively, were extracted from Deplano et al. (Citation2019).
3. Results and discussion
In the present study, the comparison between the results obtained using simulation with and without FSI been focus on (i) the velocity distribution to discuss the flow dynamics, (ii) the wall shear stress repartition around the entry tear to evaluate the opportunity of platelets activation, and (iii) the vortical structures (VS) evolution which are known to be an hemodynamic index of vascular pathology. Although, the rigid model overestimates, on average, the velocity within the whole domain, it appears, however, that the velocities are underestimated at the entry tears (–43%, –46%, –38.5% at ET1, ET2, and ET3 respectively, for t = 0.075 s).
Moreover, a jet flow is observed in FSI case (, t = 0.075 s) whereas it does not appear for the rigid one. For ET3, the jet flow angle of attack differs according to the case. At t = 0.25 s, for example, the jet impacts the FL wall due to the flap motion. At t = 0.3 s, recirculating area occurring for rigid case within the FL does not develop for FSI one. In agreement with literature (Bonfanti et al. Citation2018) rigid hypothesis overestimates WSS value on average. However, at ETs, FSI modeling induces higher WSS values as reported in . In addition, at systolic peak, the high WSS spatial area (>8 Pa) is more extended (28.4%) for FSI case.
Figure 2. Velocity vectors superimposed to iso contour in plane parallel to the main flow (dark grey plane).
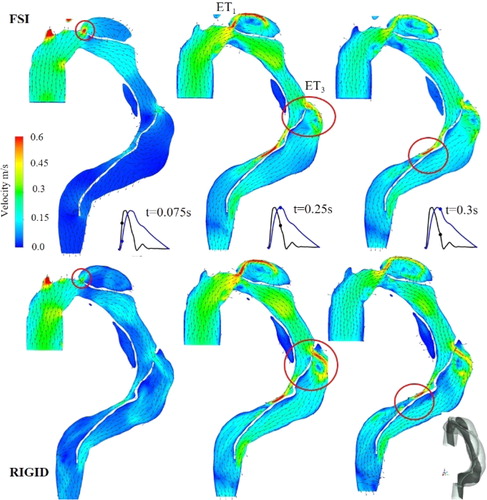
Table 1. at ETs for three different times.
VS that are formed at the ET and propagate downstream were identified using λci criterium. Considering that the area covering the detected VS determines their cumulative importance, rigid case overestimates them of about 16.9% during the decelerating phase. Differences found between FSI and rigid cases are not negligible. Although FSI is obviously time consuming, these discrepancies can have an influence on clinical events prediction.
4. Conclusions
The links between hemodynamic and pathology development are now well known. The present study highlights the importance to account FSI modeling to obtain accurate spatio-temporal evolution of the index involved. Correlation between aorta morphological changes, thrombus development during patient follow-up and hemodynamic index is ongoing.
References
- Bonfanti M, Balabani S, Alimohammadi M, Agu O, Homer-Vanniasinkam S, Diaz-Zuccarini V. 2018. A simplified method to account for wall motion in patient-specific blood flow simulations of aortic dissection: comparison with fluid-structure interaction. Med Eng Phys. 58:72–79.
- Deplano V, Boufi M, Gariboldi V, Loundou AD, D'Journo XB, Cautela J, Djemli A, Alimi YS. 2019. Mechanical characterisation of human ascending aorta dissection. J Biomech. 94:138–146.
- Love B. 2017. Polymeric biomaterials. A systems approach to engineering concepts; p. 205–238. Academic Press, Elsevier.
- Olufsen MS, Peskin CS, Kim WY, Pedersen EM, Nadim A, Larsen J. 2000. Numerical simulation and experimental validation of blood flow in arteries with structured-tree outflow conditions. Ann Biomed Eng. 28(11):1281–1299.