
 ?Mathematical formulae have been encoded as MathML and are displayed in this HTML version using MathJax in order to improve their display. Uncheck the box to turn MathJax off. This feature requires Javascript. Click on a formula to zoom.
1. Introduction
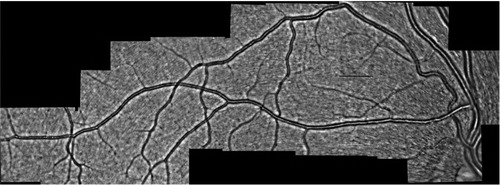
The retina offers the most accessible imaging of microvascular networks. Actually current developed techniques at the Hôpital des Quinze-Vingts using adaptive optic ophthalmoscopy and the holographic Doppler laser (Koch et al 2014; Magnain et al. Citation2014) allow revisiting the pathophysiological conceptions of retinal circulation. They currently provide hemodynamic and morphometric quantitative parameters of human retinal vessels with high spatial and temporal precision. It made possible, for example, to better understand local vasomotor phenomena, a potential source of locoregional redistribution of blood flow. We can obtain the global visualization as shown in where network topology and hemodynamic measurement are available. Such a large vision of a microcirculatory system can give considerable advances in terms of modelling and medical applications. Data naturally provide assets for validation and/or development of new models and theories.
Figure 1. Microcirculatory network of the eye by adaptive optic ophthalmoscopy and morphometric analysis. Arterioles diameters run from 120 to 20 µm. Image size: 15.2 mm × 5.2 mm.
We propose to build a theoretical-numerical model of a 1 D retinal network. It will account for phenomena of redistribution of retinal blood flow and vascular diameters. In particular, when they results from local mechanical or constraint modifications, a current effect of some retinal pathologies. The numerical modelling resulting from the theoretical model will make it possible to propose relations between the mechanical stresses and the local modification of the diameters of the vessels. This work is composed of several steps, including the addition to the 1 D model of optimality as defined by Murray (Fung Citation1997) and the validation of this model and its predictive potential.
2. Methods
The retinal network is constructed by connecting segments following the topology presented in . Pathological reactions such as occlusions are modelled by the constrained narrowing of a specific arteriolar vessel. The choice of segment is determined by experimental data collected from pathological patients.
The hemodynamic variables of each segment follow the governing 1 D equations of the integrated axisymmetric Navier-Stokes equations. They are coupled with a viscoelastic wall model and expressed in terms of the cross-sectional area A and the flow rate Q of each micro-vessel:
where
is the density of the fluid and
the friction coefficient. The coefficients
and
contain the physical parameters of the problem. We used the Young’s modulus
the Poisson ratio
the viscoelastic coefficient
the neutral cross-sectional area
and the arterial thickness h. Furthermore we propose to study the development of specific rheological law to take into account the viscosity variation in the micro-circulation. More details about the 1 D model, the volume fluid scheme chosen to integrate the discrete system of equation, and the coefficient values can be found in references (Wang et al. Citation2015; Ghigo et al. Citation2018).
Experimental data from the holographic Doppler laser are used for boundary conditions, to impose the flow rate on the terminal vessels and at the inlet of the network. These data are also required as a comparison with the other segments to validate the model.
We can perform measurements in hemodynamic in micro-vessels from 120 to 20 µm in diameter. This allows studying the reciprocal interactions of flow distribution anomalies. An experimental work is done in parallel with anatomical work on large samples of human retina to model the retinal microcirculation in and between the different physiological layers.
3. Results and discussion
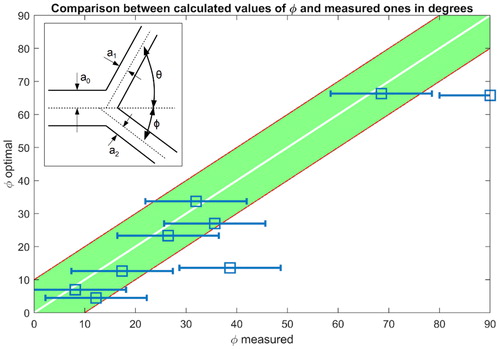
For blood vessels, an optimisation procedure, the Murray law, (Fung Citation1997) proposes a cost function that is the sum of the rate at work is done to carry the flow blood and the rate at which energy is used up by metabolism for maintain blood circulation. It follows in any junction involving three micro-vessels optimal relationships between radius (subscript 0 for incoming vessel and 1/2 for out coming vessels) and angles as sketched in the inset of :
To investigate the optimality of the retinal network of we measured radius and angles in each bifurcation and we compared them to the Murray theory. presents the correlation between one of the measured angles with error bars (horizontal lines) and the optimal angles as defined by Murray law. We observe a significant correlation between measures and predictions. The other measurements of diameter and second angle are comparable.
Figure 2. Angles correlation between measured and optimal following the Murray theory.
The work in progress involves a complete validation of the 1 D model including the optimality constraint. It also contains the study of the period during which the dynamic system deviates from optimality under pathological conditions.
4. Conclusions and perspectives
We have presented a 1 D model of retinal network together with experimental data of morphology and hemodynamic. We analyse and validate the optimality relations given by the Murray law.
Recent results suggest that 1 D numerical predictions given by the proposed model could also be used to the understanding of mechanical relations between the mechanical stresses and the local modification of the diameters of the vessels.
In retinal pathology, this work will allow us to better estimate the phenomena of secondary capillary occlusion that follow reductions in blood pressure, to map the intraluminal pressure distribution and mainly to study the effect of variations in blood viscosity on retinal circulation.
Disclosure statement
No potential conflict of interest was reported by the author(s).
References
- Fung YC. 1997. Blood flow in arteries. Biomechanics: Circulation. 1:108–205.
- Ghigo A, Lagrée P-Y, Fullana J-M. 2018. A time-dependent non-Newtonian extension of a 1D blood flow model. J Non-Newtonian Fluid Mech. 253:36–49.
- Koch E, Rosenbaum D, Brolly A, Sahel JA, Chaumet-Riffaud P, Girerd X, Rossant F, Paques M. 2014. Morphometric analysis of small arteries in the human retina using adaptive optics imaging: relationship with blood pressure and focal vascular changes. J Hypertens. 32(4):890–898.
- Magnain C, Castel A, Boucneau T, Simonutti M, Ferezou I, Rancillac A, Vitalis T, Sahel JA, Paques M, Atlan M. 2014. Holographic laser Doppler imaging of microvascular blood flow. J Opt Soc Am A Opt Image Sci Vis. 31(12):2723–2735.
- Wang X, Fullana J-M, Lagrée P-Y. 2015. Verification and comparison of four numerical schemes for a 1D viscoelastic blood flow model. Comput Methods Biomech Biomed Eng. 18(15):1704–1725.