
 ?Mathematical formulae have been encoded as MathML and are displayed in this HTML version using MathJax in order to improve their display. Uncheck the box to turn MathJax off. This feature requires Javascript. Click on a formula to zoom.
1. Introduction
The French national project COBOT aims to generate a cooperation between a human and a humanoid robot in order to lift and carry a table. To fluidly perform such interaction, a model of gait is needed to mimic human trajectories. Thus, we investigate which trajectories are spontaneously chosen by humans during locomotion with a given initial and final positions. The trajectories of the Body Center Of Mass (BCOM) were then generated thanks to two models: one based on parametric curves called clothoids and the other using Optimal Control (OC). These models have been chosen because previous researches already shown their closeness to human locomotion. Indeed, it has been demonstrated that clothoid arcs give good approximations of human trajectories during gait (Arechavaleta et al. Citation2008). These trajectories are also well fitted by an OC model established by Mombaur et al. (Citation2010). In order to compare the trajectories generated with these models to human trajectories, an original experimental setup was made in the context of this study.
This work is meant to be implemented in the walking pattern generator of a humanoid TALOS to improve its interaction with a human being by planning its real-time behaviour during gait.
2. Methods
2.1. Trajectory generation
The models presented below generate smooth BCOM trajectories (i.e., without taking into account lateral oscillations induced by the steps) during gait. is the instantaneous position of the BCOM in the horizontal plane,
the pelvis orientation,
and
the forward and sideward (called orthogonal) velocities relatively to the pelvis.
Clothoid model Clothoid curves are defined by this system of ordinary differential equations:
with the initial condition
and
and
are called the initial curvature the sharpness of the curve respectively. To generate clothoid curves between a starting position and a goal position with a given orientations a fitting method has been established by Bertolazzi and Frego (Citation2015).
OC model An OC model to describe human BCOM trajectories during gait was first proposed by Mombaur et al. (Citation2010). For this study, we adapt the cost function to use a Differential Dynamic Programming (DDP) solver from the open-source Crocoddyl library (Mastalli et al. Citation2020). Thus, we solved the following OC problem:
with
the state vector,
the control vector,
The five first weights correspond to those chosen by Mombaur et al. (Citation2010), the other two have been heuristically found to end at the desired goal position.
2.2. Trajectory measurements
Subjects Two males and eight females, without any pathologic disorders altering gait, volunteered for this study. Their ages, heights and weights ranged from 18 to 26 years (average 23.3), from 1.68 to 1.84 m (average 1.77) and from 58 to 105 kg (average 73.9) respectively. They were informed of the experimental procedure and gave their writing consent before the experiment.
Experimental protocol The subjects had to walk from 10 different starting positions with 4 different orientations to a goal position in front of a table as represented in . They performed 3 trials on each starting position for each orientation. Thus, 120 trajectories were measured and at least one trial per each participant was analysed. The starting positions were chosen to be representative of common locomotion paths within a range of 0.6 to 5.5 m from the goal.
Figure 1. Forty starting and goal positions.
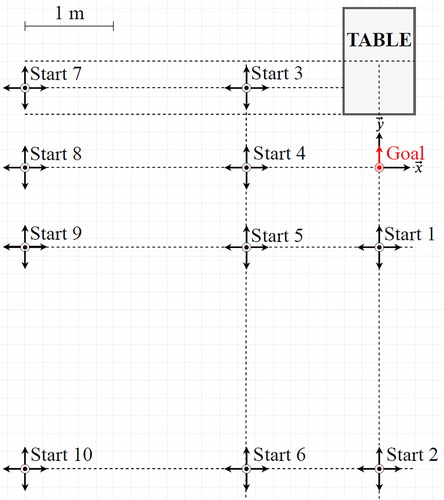
Data recording Fifteen infrared cameras (VICON, Oxford, United-Kingdom) sampling at 200 Hz collected the positions of passive markers placed on the body of the subjects. The 4 markers fixed on the pelvis were used to approximate the BCOM position (Gard et al. Citation2004) and to compute the orientation of the pelvis during gait.
Data analysis Kinematics data were filtered using a 4th order, zero phase-shift, low-pass Butterworth with a 10 Hz cut-off frequency.
2.3. Comparison
For each starting position and orientation, trajectories are generated with both models. Then, we normalize all the generated and measured trajectories from 1 to 100% with a step of 0.1. The mean measured trajectory for each 40 starting position is computed as follows: where
with j stands for the jth subject and
with
for the ith position along the BCOM trajectory.
To compare the experimental trajectories with the generated ones, the following average distances are defined:
are the measurements and
the generated data.
3. Results and discussion
3.1. Results on the positions
The results show that the trajectories computed with the OC model are closer to the measurements. Indeed, we obtain and
This gap is even wider depending on
and on the distance to the goal as shows respectively.
Table 1. Average linear distance according to .
Table 2. Average linear distance according to the distance between the starting and the goal position.
3.2. Results on the orientations
This study shows that the orientation of the pelvis during gait is mostly tangent to the velocity vector as in the clothoid model. Indeed, we get and
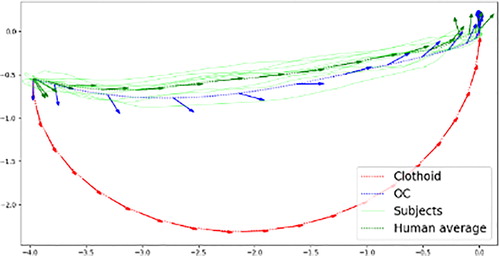
As observed on , the orientation is overall tangent to the trajectory during the middle stage of the gait but not at the initial and final positions.
Figure 2. Comparison between the two models and measurements on 10 subjects from start 9 with
4. Conclusions
In this study, we show that an OC model adapted from Mombaur et al. (Citation2010) better describes human BCOM trajectories during gait than a clothoid based model with an acceptable mean distance to the measurements for cobotic applications. However, regarding the orientation, the clothoid model is the most accurate: the orientation of the pelvis is tangent to the trajectory during a main part of the gait.
Ongoing works must optimize the weights used in the OC cost function to confirm these results.
Additional information
Funding
References
- Arechavaleta G, Laumond J-P, Hicheur H, Berthoz A. 2008. An optimality principle governing human walking. IEEE Trans Robot. 24 (1):5–14.
- Mombaur K, Truong A, Laumond J-P. 2010. From human to humanoid locomotion—an inverse optimal control approach. Auton Robot. 28 (3):369–383.
- Bertolazzi E, Frego M. 2015. G1 fitting with clothoids. Math Meth Appl Sci. 38 (5):881–897.
- Mastalli C, Budhiraja, R, Merkt, W, Saurel, G, Hammoud, B, Naveau, M, Carpentier, J, Vijayakumar, S, Mansard, N. 2020. Crocoddyl: an efficient and versatile framework for multi-contact optimal control. IEEE ICRA.
- Gard SA, Miff SC, Kuo AD. 2004. Comparison of kinematic and kinetic methods for computing the vertical motion of the body center of mass during walking. Hum Mov Sci. 22 (6):597–610.