
 ?Mathematical formulae have been encoded as MathML and are displayed in this HTML version using MathJax in order to improve their display. Uncheck the box to turn MathJax off. This feature requires Javascript. Click on a formula to zoom.
1. Introduction
Body Segment Inertia Parameters (BSIP) and particularly masses of the segments are essential to compute accurate kinetics parameters and provide inverse dynamics process or balance analysis during gait. One of the most common methods to obtain BSIP is to use regression equations obtained from anthropometric analysis of medical imaging, measurements on living subjects or of human cadavers (Dempster Citation1955; Clauser Citation1969; Zatsiorsky et al. Citation1990; Dumas and Wojtusch Citation2018) based on the total mass of the subjects.
Due to dissimilarities in the experiments and data processing, data from different studies cannot be pooled and few anthropometric tables present complete data with accurate definition of the BSIP for children. Particularly a lack of knowledge regarding limits of the segments, definition of local frame, products of inertia are observed in the previous researches. Moreover, limited information is available regarding BSIP for children as most of the anthropometric tables were based on adults over 18-year old.
Thus, a question remains regarding the use of adult’s regression equations in order to define BSIP parameters for children.
This study aims at comparing the segments’ mass distribution of children from 4- to 15-year old between anthropometric tables based on adult’s data (Dempster Citation1955; Clauser Citation1969; Zatsiorsky et al. Citation1990; Dumas and Wojtusch Citation2018) and those based on children data (Jensen Citation1986) considered as reference. This last anthropometric table only has the specificity to include the age in the regression equations from 4 to 15 years. This comparison could help researchers to know if an anthropometric table based on adult’s data can be used to determine the BSIP of healthy or pathologic child.
2. Methods
Six anthropometric tables were compared in this study. Two studies focused on the BSIP of children with mean age of 4–15 years (Jensen Citation1986) while four others are based on Caucasian adults with mean age from 23.8 to 68.5-year old (Dempster Citation1955; Clauser Citation1969; Zatsiorsky et al. Citation1990; Dumas and Wojtusch Citation2018). All of these tables describe masses of the segments.
The Jensen (Citation1986), Dumas and Wojtusch (Citation2018) and Zatsiorsky et al. (Citation1990) studies considered 16 segments models, while studies Clauser (Citation1969) and Dempster (Citation1955) respectively considered a 14 and 17 segments model to compute the BSIP. Some segments were therefore gathered to realize the comparison. The mass variability between the X adults’ table and the reference of Jensen (Citation1986) was calculated as follow:
with N = number of segments.
For each age from 4- to 15-year old, we computed () a total body mass for males and females extracted from the mean growth curves of Caucasians children (Growth curves – AFPA-CRESS - Inserm Compu-Group Medical Citation2018).
Table 1. Mean body mass from 4- to 15-year old.
In a second time, we compared the mass distribution of each segment obtained with adult’s table thanks to the anthropometric table based on children data and those obtained by the scaling of an Opensim whole-body musculo-skeletal model extracted from Maldonado et al. (Citation2018). This model was based on data adjusted by Dumas and Wojtusch (Citation2018).
To this end, we used motion capture system and a marker set composed of 48 passive markers placed on the body of 2 twin sisters of 7-year old: one healthy (H –size: 1.20 m – mass: 20 kg) and the other one (C – size: 1.05 m – mass: 17.6 kg) with cerebral palsy (CP). The Gross Motor Function Classification System, commonly used to classify the degree of motor impairments (5 levels), is level 2 for C.
3. Results and discussion
presents the evolution of the mass variability of the trunk with age for males.
Figure 1. Trunk mass variability for males from 4- to 15-year old (%).
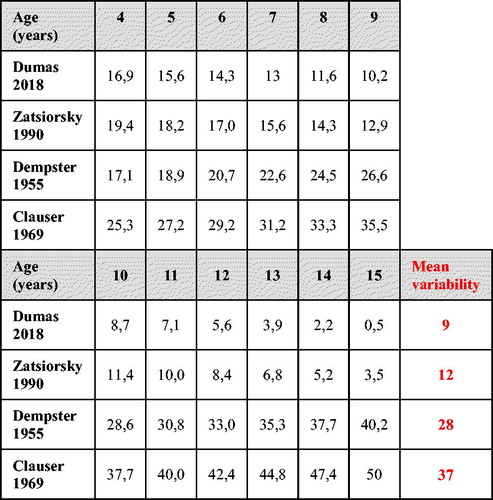
The mass variability decreases from 4- to 15-year old in most segments (mean of 26% at 5-year old vs. 15% at 15-year old). Indeed, the adult and children’s tables are closer when their ages are close. Regarding the segments’ masses, the variability between tables is the highest for the head, foot and hand while it is lower for the trunk and shank.
On average, the closest anthropometric table based on adult’s data is Dumas and Wojtusch (Citation2018).
A maximal difference of 28% over ages is observed for females while 21% is noted for males between Jensen (Citation1986) and Dumas and Wojtusch (Citation2018). The differences of the variability between males and females can be explained by the fact that most of the anthropometric tables using adult’s data are based on data from male adults (Dempster Citation1955; Clauser Citation1969; Zatsiorsky et al. Citation1990; Dumas and Wojtusch Citation2018).
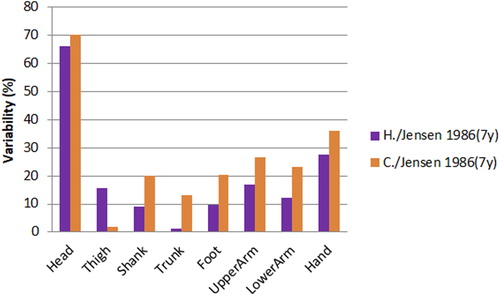
shows that the highest variability of the mass distribution is located at the head (64% at 7-year old between Jensen’s studies (J.) and H., 70% between J. and C.) and at the hand (27% between J and H., 36% between J. and C.). The mean variability between C. and the Jensen study is 20% and between H. and the Jensen study is 13%. The results show that the head, the hands and the feet mass distribution are more difficult to approximate using anthropometric tables and the Opensim model than the other segments. They also demonstrate that, using the scaling method of the Opensim software, in some of the segments, the trunk for example, C. has a mass distribution lower than her sister H. and also lower than the value obtained by the Jensen’s studies. Moreover, the variability excepted for the head, is quite low.
Figure 2. Comparison of the mass distribution between the Jensen (Citation1986) study at 7-year old and those extracted from Maldonado model.
4. Conclusions
To summarize, the closest anthropometric table based on adult’s data is Dumas and Wojtusch (Citation2018), considering Jensen (Citation1986) as reference. Ongoing works will provide more comparisons of other BSIP parameters like moment of inertia or center of mass positions to affine our present results and to make a general conclusion based on more data about the use of the Dumas and Wojtusch (Citation2018) study. Our results could also be extended to underweighted or overweighed children.
Our study also proposes to use an Opensim model to determine masses of two children, one healthy and one with CP. If the masses determined for healthy children seems relatively close to those obtained by Jensen (Citation1986), important variability exists for the child with CP. Adapted tables must be proposed for this specific population
Disclosure statement
No potential conflict of interest was reported by the authors.
References
- Clauser CE. 1969. Weight, volume, and center of mass of segments of the human body.
- Dempster WT. 1955. Space of requirements of the seated operator. WADC Technical report. p. 55–159.
- Dumas R, Wojtusch J. 2018. Handbook of human motion. Springer International Publishing; p. 47–77.
- Growth curves - AFPA- CRESS/Inserm - CompuGroup Medical. 2018.
- Jensen RK. 1986. Body segment mass, radius and radius of gyration proportions of children. J Biomech. 19(5):359–398. No
- Maldonado G, Soueres P, Watier B. 2018. Strategies of Parkour practitioners for executing soft precision landings. J Sports Sci. 36(22):2551–2557.
- Zatsiorsky VM, Chemyi GG, Regirer SA. 1990. Contemporary problems of biomechanics. MA: CRC Press; p. 272–291.