
 ?Mathematical formulae have been encoded as MathML and are displayed in this HTML version using MathJax in order to improve their display. Uncheck the box to turn MathJax off. This feature requires Javascript. Click on a formula to zoom.
1. Introduction
Distal radius fractures are the most common upper extremity fractures in adults (65 years and older) occurring after a fall from standing height or lower (Vogt et al. Citation2002). These fractures are associated with age related decline in bone quality and because they occur earlier in life than other osteoporotic fractures, they can be interpreted as a warning signal for later and more deleterious fractures (Melton et al. Citation2010).
Subject-specific finite elements models have been proposed to evaluate both bone strain and fracture risk. The accuracy of these models is heavily dependent on material properties, boundary conditions and the chosen failure criterion that defines fracture threshold (Edwards and Troy Citation2012). The main aim of the current study was to assess the surface strains prediction of radius specimen-specific finite element models.
2. Methods
2.1. Specimens and image acquisition
Data were acquired from thirty fresh-frozen cadaveric left radii from elderly donors (50–96 y.o. 15 males, 15 females). The most distal 8 cm of the bones cleaned of soft tissues were imaged with a clinical CT scan (New-Tom 5 G, QR, Verona, Italy, voxel size: 150 µm × 150 µm × 150 µm) along with a forearm calibration phantom (QRM, Moehrendorf, Germany) with calcium hydroxyapatite equivalent concentrations of 0 and 200 mg/cm3. The scans of the thirty specimens were used to establish the following linear relationship between CT Hounsfield units (HU) and calcium hydroxyapatite equivalent density in g/cm3:
2.2. Ex vivo protocol
The experimental protocol used here has been previously described in details by Zapata et al. (Zapata et al. Citation2017). Briefly, the radii were potted in a polyurethane resin in a steel cylinder, with an angle of approximately 75° between the anterior face of the radius and the impactor. The specimens were then placed in a horizontal cylinder bar on a rail system which is free to slide along the loading axis. This bar weights 12.5 kg, which is an arbitrary value representing the mass involved in a fall (i.e. a percentage of the body weight). Speckle was painted on the specimens. They were then loaded through a resin mold at 2 m/s using a hydraulic high-speed testing machine (LF technologies, France) recorded by four high-speed cameras (FASTCAM SA3, Photron, Japan) and leading to fractured and non-fractured radii. Video recordings were analyzed using VIC3D stereo-correlation software (Correlated Solution, South Carolina, USA) in order to compute Von Mises surface strain fields on a specified non-fractured area by means of principal strains.
2.3. Finite element models
Models of the radii based on segmented CT data from the open-source platform 3 D Slicer were imported into Ansys Software (v. 2019 R1 Ansys® Inc., USA) to be meshed. The models consisted of 200 000 10-nodes tetrahedral elements in accordance with a preliminary mesh convergence analysis resulting in an approximate 1 mm edge length.
Because no density–elasticity relationships were established especially for the radius, we investigated three femoral based equations (EquationEqs. (1)(1)
(1) –Equation(3)
(3)
(3) ) to assign inhomogeneous linearly isotropic material properties to the finite element models:
(1)
(1)
(Keller Citation1994), (1)
(2)
(2)
(Morgan et al. Citation2003), (2)
(3)
(3)
(Duchemin et al. Citation2008), (3) where Young’s modulus E is expressed in MPa, and the densities,
(ash density),
(apparent density) and
(hydroxyapatite equivalent density) in g/cm3. For EquationEq (1)
(1)
(1) , calcium hydroxyapatite equivalent density was converted to
using:
(Kaneko et al. Citation2004).
For Equationequation (2)(2)
(2)
was divided by 0.6 to obtain
(Schileo et al. Citation2008). This resulted in around 220 materials ranging from 0.05 to 12.1 GPa for EquationEq. (1)
(1)
(1) , from 0.03 to 12.0 GPa for EquationEq. (2)
(2)
(2) and from 0.01 to 15.7 GPa for EquationEq. (3)
(3)
(3) . Each element was assigned a Poisson’s ratio of 0.3.
The models were specifically oriented in the same configuration as the experiments (with an uncertainty of ±2°) in order to apply the maximal peak load observed experimentally along the z axis on the articular surface and to fully constrain the proximal end of the radius at the location of potting. Analyses were performed using Ansys (v. 2019 R1, Ansys® Inc., USA). Average values of the surface strain field (Von Mises strains) were computed in order to compare the bone numerical response with the experimental data analyzed with stereo-correlation.
2.4. Data analysis
Model predicted and experimentally measured means Von Mises strains were compared using Spearman correlation (ρ), root mean squared error (RMSE), and maximum error (Max err). Scatter was assessed using Bland–Altman plots.
3. Results and discussion
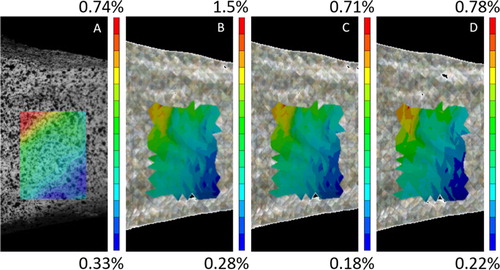
Due to experimental issues, only 27 bones were tested successfully. Sixteen of them were not fractured and were considered for the model evaluation in the current study. Qualitatively, similar results were found in von Mises spatial strain distribution for the three equations. Furthermore, patterns present common characteristics with the experimental fields ().
Figure 1. Comparison between experimental (A) and computational (B: EquationEq. (1)(1)
(1) , C; EquationEq. (2)
(2)
(2) , D: EquationEq. (3)
(3)
(3) ) Strain distribution for a non-fractured specimen.
Nonetheless, the finite element predicted strains vary as a function of EquationEqs (1)(1)
(1) –Equation(3)
(3)
(3) (). Similar results were found for EquationEqs (2)
(2)
(2) and Equation(3)
(3)
(3) predicting more accurately the experimental values for non-fractured bones whereas EquationEq. (1)
(1)
(1) overestimate the measurements. Considering the error due to the ±2° uncertainty, correlation coefficients for experimentally measured strains versus predicted strains ranged from ρ = [0.68-0.71] (p < 0.01) for EquationEq. (1)
(1)
(1) to ρ = [0.75-0.82] (p < 0.001) for EquationEq. (2)
(2)
(2) and to ρ = [0.78-0.79] for EquationEq. (3)
(3)
(3) (). The RMSE and Max Error were smallest for EquationEqs (2)
(2)
(2) and Equation(3)
(3)
(3) and largest for Eq (1) (). Moreover, Bland-Altman plots showed a randomly distributed scatter across strain magnitudes for EquationEqs (2)
(2)
(2) and Equation(3)
(3)
(3) with the difference obtained between best predicted and experimental values within the mean of difference ±1.96SD (respectively: mean difference: 0.064%ε and 0.057%ε, ±1.96SD: [-0.12, 0.25]%ε and [-0.14, 0.25]%ε).
Figure 2. Predicted (with an uncertainty of ±2°) and measured mean von Mises strains for each of non-fractured specimen classified from the smallest experimental measured strain to the largest.
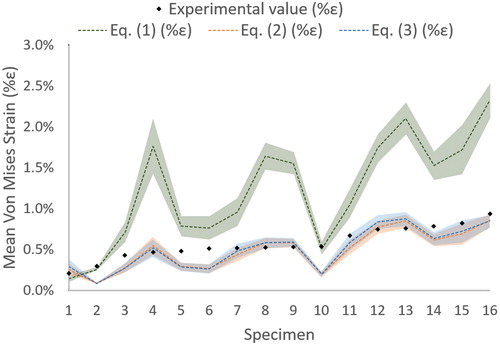
Table 1. Statistical parameters.
Overall, predicted strains using the EquationEqs. (2)(2)
(2) –Equation(3)
(3)
(3) were statistically similar and most closely matched to measured strains in terms of correlation coefficients, error, and scatter. The difference with EquationEq. (1)
(1)
(1) may be explained by the global lower Young’s modulus found for most materials due to the use of ash density and leading to an overestimation of the von Mises strains.
4. Conclusions
Radius bone strain can be predicted by finite element analysis in forward fall configuration. After the validation in the non-fractured case (elastic), the next step will be the investigation of a fracture strain-based criterion.
Disclosure statement
No potential conflict of interest was reported by the authors.
References
- Duchemin L, Bousson V, Raossanaly C, Bergot C, Laredo JD, Skalli W, Mitton D. 2008. Prediction of mechanical properties of cortical bone by quantitative computed tomography. Med Eng Phys. 30(3):321–328.
- Edwards WB, Troy KL. 2012. Finite element prediction of surface strain and fracture strength at the distal radius. Med Eng Phys. 34(3):290–298.
- Kaneko TS, Bell JS, Pejcic MR, Tehranzadeh J, Keyak JH. 2004. Mechanical properties, density and quantitative CT scan data of trabecular bone with and without metastases. Journal Biomech. 37(4):523–530.
- Keller TS. 1994. Predicting the compressive mechanical behavior of bone. J Biomech. 27(9):1159–1168.
- Melton LJ, Christen D, Riggs BL, Achenbach SJ, Müller R, van Lenthe GH, Amin S, Atkinson EJ, Khosla S. 2010. Assessing forearm fracture risk in postmenopausal women. Osteoporos Int. 21(7):1161–1169.
- Morgan EF, Bayraktar HH, Keaveny TM. 2003. Trabecular bone modulus-density relationships depend on anatomic site. J Biomech. 36(7):897–904.
- Schileo E, Taddei F, Cristofolini L, Viceconti M. 2008. Subject-specific finite element models implementing a maximum principal strain criterion are able to estimate failure risk and fracture location on human femurs tested in vitro. J Biomech. 41(2):356–367.
- Vogt MT, Cauley JA, Tomaino MM, Stone K, Williams JR, Herndon JH. 2002. Distal radius fractures in older women: a 10-year follow-up study of descriptive characteristics and risk factors. The study of osteoporotic fractures. J Am Geriatr Soc. 50(1):97–103.
- Zapata E, Rongieras F, Pialat J-B, Follet H, Mitton D. 2017. An ex vivo experiment to reproduce a forward fall leading to fractured and non-fractured radii. J Biomech. 63:174–178.