
Keywords:
1. Introduction
Femoral fractures are a common issue for metastatic cancer patients. This type of fracture can occur during every day activities (Benca et al. Citation2017).
Metastatic lesions can be osteoblastic, osteolytic or mixed but, mechanically, lytic lesions are more critical for the femoral strength (Benca et al. Citation2017).
Based on a clinical scoring (Mirel’s score), fracture predictions are overestimated and poorly predicted (Mirels Citation1989; Van der Linden et al. Citation2004; Benca et al. Citation2017), which leads to over-surgery. This scoring system is based on four following variables: metastases’ site, size and type, and patient’s pain (Mirels Citation1989). Hence, clinical studies do not focus on bone strength, but mainly on metastases characteristics and patient's pain.
Finite element models, based on Quantitative Computed Tomography (QCT) imaging, were carried out to predict failure load (e.g., Kaneko et al. Citation2008; Tanck et al. Citation2009; Yosibash et al. Citation2014).
In the context of metastatic bone, for a local validation, only one study has been published to study the major and minor principal strains using stereo-correlation (Sas et al. Citation2020) on cemented femur. The aim of this study was to provide experimental dataset to assess finite element models from a strain point of view.
2. Methods
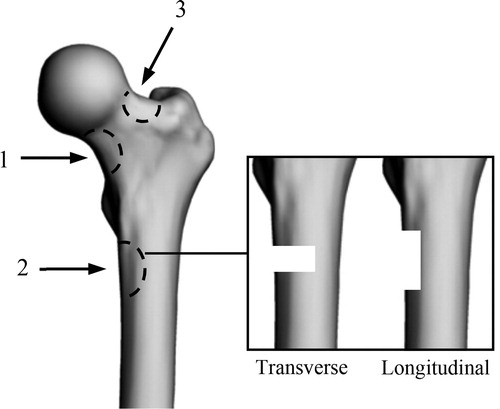
To represent osteolytic lesions on the proximal femur defects () were made ex vivo on three paired-femora (from 1 female and 2 males, respectively 71, 92 and 93 years old). Comparisons between left and right femurs, on same subjects, were performed with one size (length: 2 cm, width: 1 cm, depth: 0.5 cm) and two orientations (longitudinal and transverse) of defects.
Figure 1. Defects location and orientation (Adapted from Tanck et al., Citation2009). Location: 1, lower part of the femoral neck; 2, under the lesser trochanter; 3, upper part of the femoral neck. Orientation: transverse; longitudinal.
Diaphyses were cut at a distance of 15 cm below the lesser trochanter (Duchemin et al. Citation2008), then distal parts were embedded in resin blocks. On proximal parts, a mold was created in order to spread the load on the femoral head. The loading was applied with a 20° angle between the vertical and diaphyseal axis. Moreover, speckles were applied on all femora for strain measurements.
All femora were loaded using a servo-hydraulic testing machine (Instron 8802) in quasi-static compression (12 mm/min) until failure, to assess the bone strength.
Ultimate load of each femur was measured from these tests using a multi-axis sensor (Humanetics 10515TF) and stiffness was computed. Strains were obtained using stereo-correlation (VIC-3D 2010, Correlated Solutions Inc.).
3. Results and discussion
According to the biomechanical experiments, mean failure load was 3933 N (SD: 1411 N) and respectively, for transverse and longitudinal defects were 3509 N (SD: 1277 N) and 4356 N (SD: 1677 N). Mean stiffness was 1913 N/mm (SD: 685 N/mm) and respectively, for transverse and longitudinal defects were 1781 N/mm (SD: 784 N/mm) and 2044 N/mm (SD: 712 N/mm) (). Maximum Von Mises’ strains vary between 0.5 and 5.5% (mean: 2.0%, SD: 2.1%) and were observed close to the defects ().
Figure 2. Von-Mises strain. Defect on the femoral neck for 1 L (left), and under the lesser trochanter for 2 L (right).
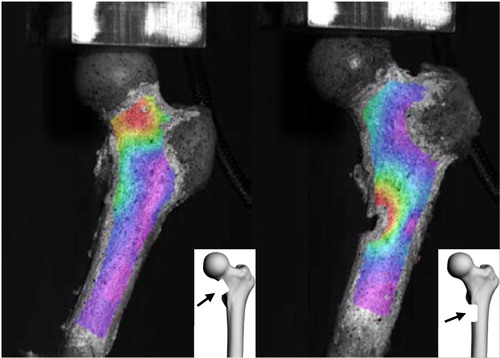
Table 1. Experimental results. L, Left; R, Right; Long, Longitudinal; Trans, Transverse (* ).
Furthermore, five out of six fractures were induced by the defects. In one case, the bone was natively damaged in a different location (between greater and lesser trochanter).
Mean failure load is in accordance with the literature, e.g., Benca et al. (Citation2017) (mean: 4530 N, SD: 1560 N) or Tanck et al. (Citation2009) (mean: 3790 N, SD: 2353 N).
Maximum strain location (close to the defect) is also consistent with the literature (Sas et al., Citation2020).
The current study presents some limitations. Firstly, a choice has been made to consider a simple loading. Secondly, the stereo-correlation study was performed on the anterior part of the femur only. A both-sides measurement (anterior and posterior) is planned in further experiments. Thirdly, different defects were carried out on a small number of specimens.
4. Conclusions
The current study showed that the femoral strength is influenced by the location (lower femoral neck) and the defect orientation (transverse).
As expected, maximum strains were mainly located on the femoral neck and close to the artificial defects.
These experimental data will be used for local assessment of finite element models.
Acknowledgements
This work was partly funded by LabEx PRIMES (ANR-11-LABX-0063) and MSDAVENIR.
References
- Benca E, Reisinger A, Patsch JM, Hirtler L, Synek A, Stenicka S, Windhager R, Mayr W, Pahr DH. 2017. Effect of simulated metastatic lesions on the biomechanical behavior of the proximal femur: Biomechanics of metastatic femur. J Orthop Res. 35(11):2407–2414.
- Duchemin L, Mitton D, Jolivet E, Bousson V, Laredo JD, Skalli W. 2008. An anatomical subject-specific FE-model for hip fracture load prediction. Comput Methods Biomech Biomed Engin. 11(2):105–111.
- Kaneko TS, Skinner HB, Keyak JH. 2008. Lytic lesions in the femoral neck: Importance of location and evaluation of a novel minimally invasive repair technique. J Orthop Res. 26(8):1127–1132.
- Mirels H. 1989. Metastatic disease in long bones. A proposed scoring system for diagnosing impending pathologic fractures. Clin Orthop Relat Res. 249:256–264.
- Sas A, Van Camp D, Lauwers B, Sermon A, van Lenthe GH. 2020. Cement augmentation of metastatic lesions in the proximal femur can improve bone strength. J Mech Behav Biomed Mater. 104:103648
- Tanck E, van Aken JB, van der Linden YM, Schreuder HWB, Binkowski M, Huizenga H, Verdonschot N. 2009. Pathological fracture prediction in patients with metastatic lesions can be improved with quantitative computed tomography based computer models. Bone. 45(4):777–783.
- Van der Linden YM, Dijkstra PD, S, Kroon HM, Lok JJ, Noordijk EM, Leer JWH, Marijnen CAM. 2004. Comparative analysis of risk factors for pathological fracture with femoral metastases: results based on a randomised tiral of radiotherapy. J Bone Joint Surg. 86B(4):566–573.
- Yosibash Z, Plitman Mayo R, Dahan G, Trabelsi N, Amir G, Milgrom C. 2014. Predicting the stiffness and strength of human femurs with real metastatic tumors. Bone. 69:180–190.