
 ?Mathematical formulae have been encoded as MathML and are displayed in this HTML version using MathJax in order to improve their display. Uncheck the box to turn MathJax off. This feature requires Javascript. Click on a formula to zoom.
1. Introduction
The temporomandibular joint (TMJ) is one of the most utilized joints of the human body, not even resting during sleep (for instance people suffering of bruxism). The TMJ disc, a fibrocartilage, allows smooth joint movement and serves as a stress/force distributor between the temporal bone and the condyle. Being a crucial part of the joint, its biomechanical behaviour has to be studied, however tests on complete discs are rare. Among mechanical characterisation procedures, spherical compression does not require specific sample preparation hence discs can keep their integrity (Lee et al. Citation2016). Furthermore, different disc regions can be tested, and the compression tool radius can be adapted to the disc’s biconcavity. Experimentally the spherical compression tool displacement d is measured, which generally is different from the penetration depth δ. Therefore, the disadvantage of such a test lies in obtaining stress-strain curves since the contact radius a related to the penetration depth δ is required to evaluate the representative stress and strain and
Actually, the Hertz model based on contact of a sphere with a linear elastic half-space is used as a first approximation (Tappert et al. Citation2017).
2. Methods
2.1. Experimental protocol and workbench
Based on a previously reported technique (Tappert et al. Citation2017), six complete porcine TMJ discs were tested on three locations using spherical compression tools. The testing protocol included a preloading of 20 cycles followed by a cyclic loading phase of 25 cycles at a frequency of 0.1 Hz. A universal testing machine (Zwicki, Zwick/Roell) equipped with a 10 N load cell (stiffness ) was used to perform the tests. The discs were positioned on a 3 D printed condyle within an environmental testing chamber, filled with physiological solution (NaCl 9 g/L) tempered at 37 °C to maintain physiological conditions. Three spherical tools of radii R1=0.875 mm, R2=1.75 mm, R3=3 mm where used in order to evaluate the mechanical behaviour of various disc subdomains, see . The maximum displacement
was chosen so that the representative strain
was similar for all three compression tools. According to Hertz developments, the contact radius is related to the penetration depth by the expression
Using this relation, the following definition of
can be derived from the theory of Hertz (Hertz Citation1882):
In the case of incompressible materials (
) and the assumption that δ = d, it yields
The chosen value of the final strain was
leading to the displacements d1=0.1 mm, d2=0.2 mm and d3=0.36 mm. To evaluate the maximal representative stress, the usual definition of this quantity was employed:
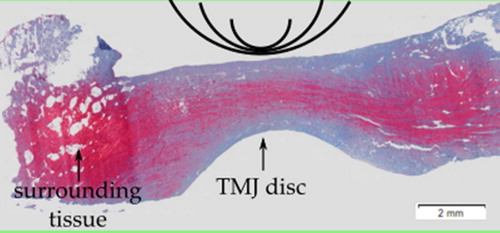
Figure 1. Sagittal cut of porcine TMJ disc with Masson’s trichrome histological staining highlighting collagen in blue. The half-cycles represent the compression tool radii used.
2.2. Histological staining
Histological cuts with 3.5 µm thickness were conducted to analyse the disc’s component distribution with three classical stains: HES, Masson’s trichrome and Safranine O.
3. Results and discussion
The Masson’s trichrome staining highlights that the collagen fibres are not homogeneously distributed within the TMJ disc (). Rather two zones can be observed, an enveloping one with around 0.5 mm thickness superiorly and inferiorly and a core one measuring approximately 1 mm. This observation has been confirmed using two additional stains. Also, the shows three semicircles enabling the visualisation of the disc’s subdomains involved in the compression tests keeping in mind the penetration depth used. The tests allowed gathering force-displacement data from three locations. Representative force-displacement curves obtained using the three compression tool sizes are depicted in .
Figure 2. (a) Representative experimental force-displacement curves obtained from one porcine TMJ disc sample tested on the central location using a compression tool of radius (a) R1=0.875 mm, (b) R2=1.75 mm, and (c) R3=3 mm. The negative forces are due to the definition of the offset at the beginning of the loading and not to be confused with tensile forces.
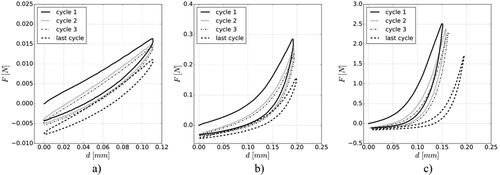
The obtained curves show typical behaviour of soft tissues; hysteresis between the loading and unloading phases as well as the force accommodation in consecutive cycles. Since the testing was displacement-driven, the samples displacement increases in consecutive loading cycles due to a load cell stiffness correction and decrease in measured forces. Even though the representative strains applied were comparable, the measured forces vary in their order of magnitude. For the cases of the maximal forces were equal to
and
respectively for tools R1, R2 and R3. To estimate the stress levels developed at the end of each test, the representative stresses were calculated leading to the values
MPa (
),
MPa (
), and
MPa (
). As for maximal forces, very large differences of induced stresses were obtained. These results suggest an inhomogeneous mechanical behaviour of the disc, related to its microstructure, which differs from the enveloping layer to the core reinforced by the collagen fibres.
4. Conclusions
It appears that the different layers observed in the histological cuts of have very different mechanical responses. Indeed, using the smallest compression tool, the behaviour of the enveloping layer is mainly characterised while using the biggest tool, the core layer is tested together with the soft envelope. This fact is reflected by the large “toe” of the curves presented in . This toe corresponds to the response of the external layer mainly compressed for small values of displacement. This observation is under investigation through finite element simulations taking into account large strain, contact interactions and non-linear material behaviour. Meanwhile more deep micro structural analysis is in progress.
Acknowledgement
The authors wish to thank Mr. Sebastien Hatton (Solsi Cad, Woippy, France) for the support and help in obtaining the 3D scans and PICT-URCA platform for imaging core facilities.
Disclosure statement
No potential conflict of interest was reported by the authors.
References
- Lee H, Campbell WD, Canning ME, Theis KM, Ennis HY, Jackson RL, Wright JC, Hanson RR. 2016. Correlation between signalment and the biphasic hyperelastic mechanical properties of equine articular cartilage. Biotribology. 7:31–37.
- Hertz H. 1882. Über die Berührung fester elastischer Körper. J Reine Angew Math. 92:156–171.
- Tappert LK, Baldit A, Rahouadj R, Lipinski P. 2017. Local elastic properties characterization of the temporomandibular joint disc through macro-indentation. Comput Method Biomec. 7(20-sup1):201–202.