
1. Introduction
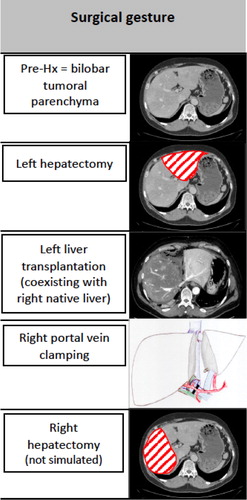
The RAPID (Resection And Partial Liver Segment 2/3 Transplantation with Delayed total hepatectomy) concept is an innovative surgical procedure that was recently proposed to increase the availability of grafts (transplantable organs) for patients with unresectable metastases (Line et al. Citation2015). The RAPID technique () includes total hepatectomy (Hx, liver resection) in two steps. First, partial Hx is performed and the recipient receives a small partial liver. Then, portal flow, the main input flow to the liver, is diverted to the graft to facilitate its fast regeneration. However, to avoid graft portal hyperperfusion or barotrauma, portal vein (PV) pressure monitoring is required (Yagi et al. Citation2006). As soon as the graft reaches the target volume, the second stage resection is performed, ending the native diseased liver removal.
Figure 1. Different steps of the RAPID procedure.
For such a complex and innovative procedure, numerically simulating hemodynamics in RAPID patients could be useful to anticipate hyperperfusion or barotrauma: this proof of concept study aims at developing a model to represent these different steps and see if such a model can predict the outcome of the critical first steps (Golse et al. Citation2020).
2. Methods
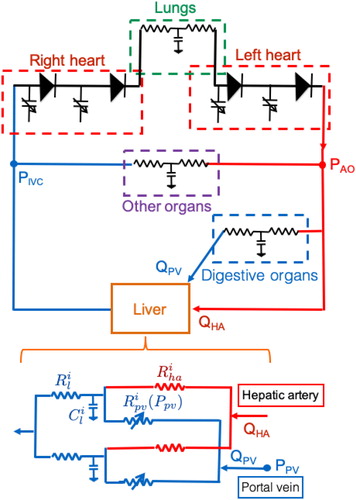
Recently, our team performed hemodynamic 0D modeling to simulate major Hx in pigs (Audebert et al. Citation2017). To the aim of tailoring the RAPID procedure, we adapted the 0D model in this setting to assess its clinical applicability. This electric analog of the entire blood circulation () consists of a 4-chamber heart module, the lung, the digestive organs, the liver and the other systemic organs. The lung, digestive organs and other systemic organs are represented by simple ‘RCR’ components. The liver is dually perfused by the portal vein from the digestive organs and by the hepatic artery from the aorta and drains into the right side of the heart, each route being modeled by resistance, with at their junction a capacitance. The liver is divided into the right and left uneven hemi-livers that are in parallel.
Figure 2. 0D model with two hemi-livers.
This 0D model was retrospectively tested on three patients for which the only available measurements to parameterize the model were the weight of the liver subparts and graft at the different stages, and pre-resection PV pressure, portocaval gradient (PCG) and mean arterial pressure. The other hemodynamics data needed to tune the model were based on the literature, given that patients were not cirrhotic. The grafts were assumed to have healthy intrinsic resistances.
We simulated the first three steps () and compared our final predicted PV pressures and portocaval gradients to those intraoperatively measured, as an indication to modulate portal flow relies on these measures.
3. Results and discussion
Portal pressures measured at the end of the first stage in patients 1, 2 and 3 were, respectively, of 14, 16 and 12 mmHg while the simulated pressures were of 13.1, 14.8 and 11.5 mmHg. Portocaval gradients measured after right PV clamping in the three patients were, respectively, of 10, 11 and 7 mmHg while the simulated gradients were of 9.9, 11.6 and 8.3 mmHg. Spearman correlation for the 12 paired values was high (r coefficient = 0.94, p = 0.02), indicating that the model predictions are good. Differences in the gradients reflect both the disease state of the liver (initial resistance), extent of Hx and size of transplanted graft.
To anticipate the minimal graft weight that should be chosen to avoid the need for portal flow modulation (according to fixed maximal pressure of Ppv = 20 mmHg, or gradients PCG = 15 mmHg and 10 mmHg), we virtually changed the graft weight of each patient. The minimal graft weight required to avoid portal hypertension with different thresholds proposed for Ppv and portocaval gradients was below the real graft weight in all cases, except for the most restrictive portocaval gradient threshold: patient 1 was borderline (1.5% too low weight), while the real size of patient 2 was too low by 22%. This result highlights the need for a consensus in appropriate thresholds to determine safe transplantation graft sizes.
4. Conclusions
Although more work is warranted to validate it on a larger cohort, this promising report demonstrates that 0D simulation could be a useful tool to promote this new surgical procedure by a better understanding of how the different steps affect the liver perfusion and pressure and by anticipating depending on the graft size (and thus potentially avoiding) hypertension for each patient in the future.
Acknowledgements
This work was supported by an Inria-APHP fellowship.
References
- Audebert C, Bekheit M, Bucur P, Vibert E, Vignon-Clementel IE. 2017. Partial hepatectomy hemodynamics changes: experimental data explained by closed-loop lumped modeling. J Biomech. 50:202–208. Jan 4
- Golse N, Joly F, Nicolas Q, Vibert E, Line PD, Vignon-Clementel I. 2020. Partial orthotopic liver transplantation in combination with two-stage hepatectomy: a proof-of-concept explained by mathematical modeling. Clin Biomech. 73:195–200.
- Line P-D, Hagness M, Berstad AE, Foss A, Dueland S. 2015. A novel concept for partial liver transplantation in nonresectable colorectal liver metastases: the RAPID Concept. Ann Surg. 262(1):e5–e9. Jul
- Yagi S, Iida T, Hori T, Taniguchi K, Yamamoto C, Yamagiwa K, Uemoto S. 2006. Optimal Portal Venous Circulation for Liver Graft Function after Living-Donor Liver Transplantation. Transplantation. 81(3):373–378.