
1. Introduction
Indirect dental restorations have a limited lifespan. 20% of them break or unseal during the first five years (Malament et al. Citation1999). These failures are often localized close to the interface crown adhesive layer area (Øilo et al. Citation2014). Some defects observed in the adhesive layer may be responsible of these deficiencies. Thus, this study aims at characterizing the geometry of these defects in order to assess their impact on the mechanical behaviour of the dental assembly using Finite Element Modelling (FEM).
2. Methods
2.1. Sample preparation
Dental restoration is a complex multi-layered assembly composed of a restoration (here a dental crown), an adhesive layer and the underlying dentin. To avoid considering the geometrical variability inherent to patient specific restorations (Tapie et al. Citation2016) while taking into account the one due to the assembly process, an experimental investigation was conducted on three simplified assemblies.
Dental crowns were machined in Vita Enamic® CAD/CAM blocks, a dental hybrid ceramic composed by a dominant ceramic network strengthened by a polymer network. The dental preparations were machined in cow cortical bone instead of dentin to facilitate machining in a massive volume and to better control assembly fabrication process. Bone replaced advantagiously dentin because both have similar chemical, geometrical and mechanical properties. The adhesive layer used to seal both parts was Kerr Maxcem EliteTM, a dual cure resin composite mainly composed of dimethacrylate resin reinforced with inert mineral fillers. The recommendations provided by Kerr Dental concerning the assembly process have been followed to build the dental assembly.
2.2. Micro-computed tomography
The internal geometry of dental assemblies was visualized by X-ray micro-Computed Tomography (μ-CT). The samples were imaged using the X50 μ-CT from North Star Imaging Company with a tungsten anode. A tension of 180kVp, an intensity of 100μA and a sampling frequency of 12 images/s were selected. 750 2D-images were staked and the 3D-images (1228 × 1214 × 1307 pixels) were reconstructed using the NSI software. The voxel resolution was 7.3 μm.
2.3. Digital image processing
presents the image treatment protocol (performed using AVIZO 9.0). The objective was to improve the image quality in order to clearly distinguish each part of the sample and to characterize the sealing joint geometry and its defects.
Figure 1. 3D digital image treatment protocol.
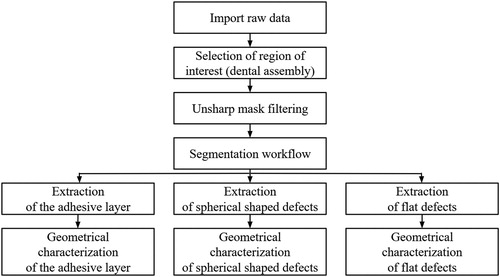
In AVIZO, the segmentation workflow consists in linking each voxel of the 3D images to its dental assembly component. This connection was done manually for large components of dental assemblies using a local thresholding tool that selects all voxels around a given point whose gray level is within an user-defined threshold interval. For roughly spherical shaped defects with an average diameter inferior to 36.5 μm, the selection was carried out using a black top hat filter. To capture flat shaped defects with thickness less than 36.5 μm, a fictive component containing all the voxels forming the crown boundary layer was created. This layer thickness was 36.5 μm. Then, by thresholding this part, the voxels corresponding to these defects were selected.
After extracting the different parts constituting the dental assemblies, the geometrical characterization of the adhesive layers and their defects were performed. Defects with a dimension inferior to 22 μm were not taken into account because it was difficult to distinguish them from noise. For the spherical shaped defect analysis, a filter was added to only select those with a sphericity greater than 0.5. Finally, the total volumes of the adhesive layer, the spherical shaped defects and the flat defects were measured. For spherical shaped defects, we also assessed their total number and their radius and for flat defects, their areas.
3. Results and discussion
The adhesive layer total area (average value over three samples) is 250.1 ± 11.5mm2 and its volume is 36.7 ± 7.8mm3. Both spherical shaped and flat defects are observed in the adhesive layer and at interfaces ().
Figure 2. Illustration of the observed defects in the adhesive layer -a. spherical shaped defects; -b. flat defects.
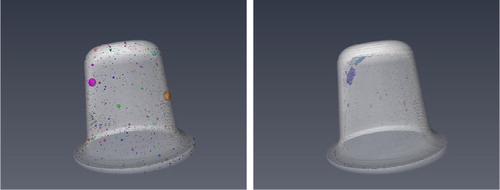
The adhesive layers contain a high density of small spherical shaped pores with a mean value of 60.4 ± 2.4 per mm3. The porosity in the adhesive layer is around 0.76%. The mean pore radius is 17.3 ± 11.9 μm, which is close to detection threshold.
Flat defects are located at the interface between the joint and the dental preparation. This localisation may be due to gravity because unlike other studies, we mimicked a maxillary localized restauration (the dental preparation was positioned on the top of the assembly). Moreover, these defects are located at areas where the cement thickness is the thinnest. The detected areas represent 6.4 ± 3.8% of cement area and their total volume is 0.07 ± 0.03mm3.
The main limitation of our protocol is the 3D image resolution. For spherical shaped defects, those with a diameter less than 22 μm are not taken into account here. Thus, the distribution of pore radius is trimmed and the cement porosity underestimated. For flat defects, this limitation combined with artefacts inherent to micro-CT imaging implies that flat defects are probably larger in reality.
To improve the geometrical characterization of defects, high resolution SEM observations of 2D sections will be performed. Also, a contrast material will be injected into the sample to highlight flat defects.
During chewing, as dental assemblies are subjected to mechanical forces, both quantified defects will create stress concentrations that could be responsible of cement cohesive failures for spherical shaped defects and adhesive failures for flat defects. This will be quantified in the mechanical part of this work. From the 3D images a tetrahedral mesh will be created with AVIZO. Then a FEM model will be built with Abaqus code and simulations performed to study defect-induced stress concentrations in assemblies according to the size, the location and the nature of defects. In addition, mechanical tests on scanned samples will be carried out to validate the model.
4. Conclusions
A protocol based on μ-CT imaging to assess cement defects in dental assemblies has been proposed. Two types of defects have been observed and quantified. The next step will be to assess their impact on the mechanical behaviour of the assembly both numerically and experimentally.
Acknowledgements
The authors would like to thank Mr Tapie (URB2i) and Mr Lebon (URB2i) for their assistance to set up the machining process and Mr Smaniotto (LMT) for performing scanning of the dental assemblies. This work was carried out within the MATMECA consortium and supported by the ANR under contract number ANR-10-EQPX-37.
Disclosure statement
No potential conflict of interest was reported by the authors.
References
- Malament KA, Socransky SS, Malament KA, Socransky SS. 1999. Survival of Dicor glass-ceramic dental restorations over 14 years: Part I. Survival of Dicor complete coverage restorations and effect of internal surface acid etching, tooth position, gender, and age. J Prosthet Dent. 81(1):23– 32.
- Øilo M, Hardang AD, Ulsund AH, Gjerdet NR. 2014. Fractographic features of glass-ceramic and zirconia-based dental restorations fractured during clinical function. Eur J Oral Sci. 122(3):238–244.
- Tapie L, Chiche N, Boitelle P, Morenton P, Attal J-P, Schmitt N, Vennat E. 2016. Adaptation measurement of CAD/CAM dental crowns with x-ray micro-CT: metrological chain standardization and 3D gap size distribution. Percoco G, editor. Adv Mater Sci Eng. 2016:1–13.