
 ?Mathematical formulae have been encoded as MathML and are displayed in this HTML version using MathJax in order to improve their display. Uncheck the box to turn MathJax off. This feature requires Javascript. Click on a formula to zoom.
Abstract
Outputs of musculoskeletal models should be considered probabilistic rather than deterministic as they are affected by inaccuracies and estimations associated with the development of the model. One of these uncertainties being critical for modeling arises from the determination of the muscles' line of action and the physiological cross-sectional area. Therefore, the aim of this study was to evaluate the outcome sensitivity of model predictions from a musculoskeletal hand model in comparison to the uncertainty of these input parameters. For this purpose, the kinematics and muscle activities of different hand movements (abduction of the fingers, abduction of the thumb, and flexion of the thumb) were recorded. One thousand simulations were calculated for each movement using the Latin hypercube sampling method with a corresponding variation of the muscle origin/insertion points and the cross-sectional area. Comparing the standard hand to simulations incorporating uncertainties of input parameters shows no major deviations in on- and off-set time point of muscle activities. About 60% of simulations are located within a ± 30% interval around the standard model concerning joint reaction forces. The comparison with the variation of the input data leads to the conclusion that the standard hand model is able to provide not over-scattered outcomes and, therefore, can be considered relatively stable. These results are of practical importance to the personalization of a musculoskeletal model with subject-specific bone geometries and hence changed muscle line of action.
Introduction
The outcome of musculoskeletal models, e.g. joint moments and forces, is mostly reported as single values with a deterministic character. The incorporation of any uncertainties within the model is often left unexamined (Cook et al. Citation2014). When inaccuracies associated with model development are taken into considerations, simulation results have to be interpreted as a single case out of many possible outcomes. These uncertainties may arise either from simplifications in the model (Gagnon et al. Citation2011) or inaccuracies in underlying input variables as a function of data extraction (Żuk and Pezowicz Citation2016). The process of identifying such parameters is usually associated with complex measurements (Scheys et al. Citation2009; Taddei et al. Citation2012), which are based on an average error greater than zero (Scheys et al. Citation2008).
Critical variables for modeling are the muscle parameters, such as the line of action (Raikova and Prilutsky Citation2001), physiological cross-sectional area (PCSA), and thus the maximum force capacity of muscles (Herzog Citation1992). These are crucial parameters for determining muscle activities and joint reaction forces. Nussbaum et al. (Citation1995) has already shown that such uncertainties in the muscle line of action result in a change of more than 100 N in the joint reaction force within the spine.
If the model to be analyzed is based only on a single anatomical data set, the inaccuracy in the determination of muscle parameters is reduced to measurement errors as the data is not diversified. This lack of diversity may also lead to a systematic error if the subject's anatomical preconditions in patient-specific modeling deviate significantly from the cadaver, which the model is based on. To achieve ideal population-based models, a more comprehensive anatomical data set is necessary, which can be gained by including a large number of different cadavers when determining muscle parameters. The advantage of including a larger number of cadavers increases the representativeness of the sample means and reduces their susceptibility to be skewed by outliers. However, scattering of the respective parameters also leads to considerable uncertainties in parameters. Another disadvantage depicts the fact that there is high variability within human performance measures within a population, and hence only a few people can be defined as an average person (Smith et al. Citation2014). However, generalized musculoskeletal models' overall purpose should not be the ability to represent only an average person but to be applicable to a large number of subjects with idiosyncratic characteristics through patient-specific scaling.
The recently published hand model by Engelhardt and Melzner et al. (Citation2020) within the AnyBody™ Modeling System (AMS) (Anybody, Aalborg, Denmark) is based on a general data set, which includes data of 16 donors (Havelková et al. Citation2020). This model consists of 80 extrinsic and intrinsic hand muscles with 31 degrees of freedom and has been shown to correlate highly with moment arm studies from prior literature (Engelhardt and Melzner et al. Citation2020). Since this model's anatomical data has some unavoidable known indeterminacy, the outcome sensitivity of subject-specific model predictions (muscle activities and joint reaction forces) compared to the input parameters should be researched. Thus, this study aimed to investigate the sensitivity and stability of the model and at the same time determine whether the model can be applied to a broad population beyond the average hand. Due to its increasing importance in using various modern technologies, such as smartphones (Gustafsson et al. Citation2010), we particularly focused on the thumb.
Materials and methods
The PCSA and the muscles’ line of action are crucial parameters in determining acting muscle forces and hence the acting joint reaction forces. In order to evaluate the sensitivity of the recently published musculoskeletal hand model from Engelhardt and Melzner et al. (Citation2020) to these parameters, the underlying anatomical data (Havelková et al. Citation2020) was varied according to their known measurement uncertainties – see Appendix A, supplementary material. Subsequently, the simulated on- and off-set time points of the muscle activities were compared with experimentally derived electromyographic activities. Further, the effects on the change of joint reaction forces within the hand were investigated.
Experiment set-up
The test subject (weight = 78.3 kg, hand length = 20.5 cm) was informed about the measurement procedure in advance and provided written consent confirming voluntary participation. Then, the test subject performed one trial with the abduction of all fingers, one trial with the abduction of the thumb, and one trial with the flexion of the thumb. Each trial consisted of five repetitive movements, where the hand was in pronation for the abduction of the fingers and neutral position otherwise.
The movements' kinematics were captured with a camera-based motion capture system (Vicon©, Vicon Motion Systems Ltd., UK) using a marker-set including the upper arm, forearm, and all fingers. The EMG activities of 10 extrinsic and intrinsic (see and ) muscles were captured via surface EMG (Delsys Trigno IM and Delsys Trigno Mini, Delsys® Inc., MA, US.) following the recommendation of sensor placement according to Criswell and Cram (Citation2011) and Barbero et al. (Citation2012). Prior to the sensor placement, the skin was cleaned with an alcoholic solution to minimize the acquired signal's influences due to dead skin cells, salt, or grease. The muscles were selected according to the movements to be investigated (abduction of all fingers/thumb and flexion of the thumb), such that in addition to the primarly active intrinsic muscles, extrinsic muscles stabilizing the wrist were also covered. For normalization of the EMG data, maximum voluntary contraction (MVC) measurements following Kendall (Citation2010) were performed beforehand.
Figure 1. Experimental set-up with marker and EMG sensor placement of the forearm and hand of the test subject.

Table 1. Measured EMG signal of intrinsic and extrinsic muscles.
Simulation
The gathered kinematic data was fed into the musculoskeletal simulation software AnyBody™ (AnyBody Technology A/S, Aalborg, Denmark, V. 7. 3). Then, the model was scaled according to the anthropometric data of the test subject to allow for patient-specific simulation, and simple muscle models are applied. The change of input parameters and the simulation were performed externally using the python module AnyPyTools (Lund et al. Citation2019) to conduct the subsequent sensitivity study. The PCSA and the origin, as well as the insertion points of all extrinsic and intrinsic hand/wrist muscles were amended according to their measurement inaccuracies published by (Havelková et al. Citation2020) – see Appendix A, supplementary material.
A modification in the PCSA is directly incorporated into the cost function G, which has to be minimized by the algorithm
whereby p is the polynomial coefficient symbolizing the muscle synergy, fi is the applied force, and Ni is the strength of a muscle, which is linear proportional to the PCSA. Hence, the magnitude of the PCSA influences muscle recruitment and, thus, the joint reaction forces to be determined. The outputs are also influenced by changing the muscles' origin and insertion points, resulting in a resulting alteration in the moment arm.
For the PCSAs, origin, and insertion points, a normal distribution (with the expectation value µ being the value of the standard model and standard deviation (SD) of the anatomical data – see Appendix A, supplementary material) was assumed. Further, we made the following assumptions regarding origin and insertion points:
The origin and insertion area was split up according to the number of muscle representatives within the model.
Since the anatomical dataset provided only the area in a two-dimensional plane, the SD in the third dimension was assumed to be 1 mm.
To not exceed the limits of the origin and insertion areas while randomly creating input parameters, the boundaries of the area were set to ±3SDs. This restriction assures that origin and insertion points stay at 99.7% within the anatomical area.
Based on this set-up, 1.000 simulations were calculated for each trial. We used the Latin-Hypercube sampling (LHS) technique (Helton and Davis Citation2003) to perform sensitivity analysis, which is a standard method in biomechanics as it provides improved sampling efficiency compared to the otherwise commonly used Monte Carlo analysis (Valero-Cuevas et al. Citation2003; Reinbolt et al. Citation2005).
Data processing
For the EMG signal, a root mean square with a window size of 50 ms was applied, the baseline offset was subtracted, and the signal was normalized according to the MVC measurements. To compare the numerical with the experimentally measured muscle activity, a compilation of corresponding representatives of a muscle was created whereby only the maximum value at each time step of the grouped muscle elements was taken into account. A detailed list of enveloped muscles can be found in the Appendix B, supplementary material.
Following prior research, which has used an evaluation of on- and off-set timing of muscle activities to validate musculoskeletal models (Pieri et al. Citation2018), the on- and off-set time points of the experiment, the standard model, and all simulations run by the LHS method were compared. This comparison is particularly interesting since a larger variation of the on- and off-set timing would imply a questionable experimental validation or instability of the model.
For automatization of on- and off-sets detection, change point detection (Killick et al. Citation2012) as implemented by the MatLab (The MathWorks Inc., Natick, USA) FindChangePts() function was used. Based on this output, the difference between each simulation and the experiment was evaluated. Next, the joint reaction forces acting on the wrist and all finger joints were calculated using the inverse dynamic approach of the AMS. This inverse dynamic approach provides a computation of the muscle forces and the resulting joint reaction forces, but it can not be used directly for motion prediction. Since a relatively small range of motion in the distal and proximal interphalangeal joint took place during the conducted movements, only the carpometacarpal (CMC) and the metacarpophalangeal (MCP) joint were considered in the investigation of the joint reaction forces.
For analysis of the model output and measured data, Rebba and Mahadevan (Citation2008) showed that a metric r
where m-c is the difference between experimental data and numerical simulation, and
is the accuracy requirement, which is more suitable than the hypothesis testing using the p-value. Therefore, the r metric was used for comparing the experimental data, the standard model, and the outcome of all LHS simulations regarding the on- and off-set time points. This metric was also applied to comparing joint reaction forces, although the model cannot be checked against experimental data. Instead, the results of the LHS simulations were compared to the standard model.
Results
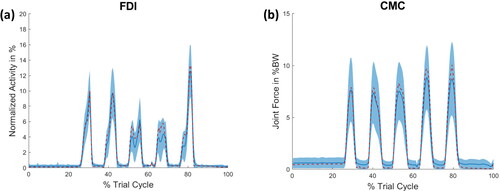
As the aim of this study was to test the sensitivity and stability of the musculoskeletal hand model, exemplifies the extent to which variation in input parameters can affect changes in muscle activity () and joint reaction forces (). displays the activity of the FDI muscle and the joint reaction force of the thumb's CMC joint during the abduction of all fingers. In both cases, the standard model is within the range of one SD of the LHS simulations. It can be stated that the variation in the joint reaction force is higher than that of the individual muscle activities. All muscle activities and joint reaction forces of each motion can be found in the Appendix C–E, supplementary material.
Figure 2. (a) Muscle activity of the FDI muscle and (b) the joint reaction force of the CMC joint of the thumb during the abduction of the fingers. The red dashed line represents the outcome of the standard model, whereas the blue line indicates the mean of the LHS simulation with its SD as a shaded area. The force of (b) is given in percent body weight (BW).
The mean values of the difference between all calculated on and off time points for each movement are displayed in . In contrast to the fingers' abduction, during movements of the thumb, mainly FPB and APB muscles were addressed. Hence, only these muscles were taken into account for calculating the on and off times. Comparing the mean values of the LHS simulations and the standard model, only a slight shift of the on-off times can be observed.
Table 2. The average time difference of the on- and off-set time points of the muscles between the experimental measured and simulated predictions during (a) the abduction of all fingers, (b) the flexion of the thumb, and (c) the abduction of the thumb.
The joint reaction forces (normalized to the body weight) acting on the wrist and finger joints for each movement are shown in . When determining the joint reaction forces, only times when the muscles of the standard model were active were taken into account and averaged. The highest acting forces were found in the wrist joint, whereby the CMC joint of the index finger was also exposed to high loads during thumb movements. Considering the joint reaction forces, the standard model also stays within one SD of the LHS simulations except for the index finger's MCP joint during the abduction of the thumb. The coefficient of variation (CV) – which is defined as the ratio of SD and mean - varies between 9% (MCPthumb – abduction thumb) and 56% (CMCfinger4 – abduction thumb) for individual joints.
Table 3. The average joint reaction forces of the wrist, CMC, and MCP finger joints during the (a) the abduction of all fingers, (b) the flexion of the thumb, and (c) the abduction of the thumb.
The results for applying the metric proposed by Rebba and Mahadevan (Citation2008) to the outcome of the on- and off-set time difference and the joint reaction forces, respectively, are shown in for each movement. show the probability of finding an outcome of the predicted joint reaction forces of the LHS simulations within a specific interval around the calculated value of the standard model (all forces were normalized to the standard model). show the probability that the time difference between the experimental and numerically calculated data is within a specified time interval for the standard model and the LHS simulations. Considering the joint reaction forces, almost 70% of all simulations stay within a 30% interval around the standard model for the abduction of all fingers. Notable exceptions are the CMC joint of the thumb and index finger, for which only 60% of results occur within this interval ().
Figure 3. Probability for the abduction of all fingers (a) to find an outcome of the predicted joint reaction forces of the LHS simulations within a specific interval around the calculated value of the standard model (all forces are normalized to the standard model) (b) that the time difference between the experimental and numerical calculated data is within a specific time interval for the standard model and the LHS simulations.
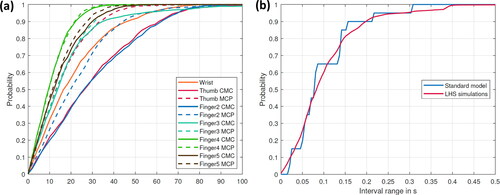
Figure 4. Probability for the flexion of the thumb (a) to find an outcome of the predicted joint reaction forces of the LHS simulations within a specific interval around the calculated value of the standard model (all forces are normalized to the standard model) (b) that the time difference between the experimental and numerical calculated data is within a specific time interval for the standard model and the LHS simulations. Only the APB and FPB muscles were considered.
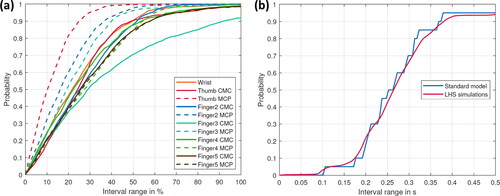
Figure 5. Probability for the abduction of the thumb (a) to find an outcome of the predicted joint reaction forces of the LHS simulations within a specific interval around the calculated value of the standard model (all forces are normalized to the standard model) (b) that the time difference between the experimental and numerical calculated data is within a specific time interval for the standard model and the LHS simulations. Only the APB and FPB muscles were considered.
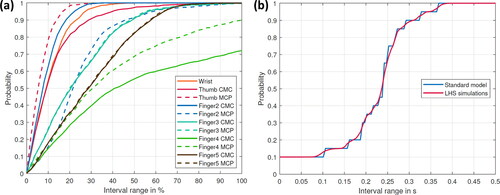
Regarding the thumb flexion, approximately 60% of simulation outcomes stay within a 30% interval around the standard model (); whereas for the thumb abduction, it is about 70% except for the joints of digitus IV and V (). Regarding the probabilities of finding an on- or off-set point in a specific time interval, the results of the LHS simulations follow the trend of the standard model (see ).
Discussion
The aim of this study was to examine the sensitivity and stability of the musculoskeletal hand model published by Engelhardt and Melzner et al. (Citation2020) and thus to determine whether the model can be applied to a broad population outside the average hand for patient-specific modeling. Examining the comparison between experimental data, the standard model, and LHS simulations suggests that the hand model is able to provide convergence for a broad range of input data and, therefore, can be considered relatively stable.
Combining all joints' CV values results in an average scattering of 30% around the expected value. The probability that the calculated joint reaction forces of the LHS simulations are located within an interval of ±30% around the value of the standard model is about 60% for the three investigated movements. Even when comparing the experimental data with the numerical models, the highest deviation between the prediction of the standard model and the mean value of the LHS simulations is 73 ms (abduction of all fingers - ECR muscle) and the probability curves of show no substantial deviations. Further, all SDs are smaller than equal to approximately 250 ms, which is within an acceptable range once electromechanical delays (which are about 75 ms, according to Seth and Pandy (Citation2007)) are taken into account.
Investigating joint reaction forces, the level of particular forces within the hand during the different movements is of particular interest. Especially in the abduction of the thumb, the wrist, and the index finger's CMC joint seem to be exposed to high forces (). These increased forces are especially interesting, as this movement is mainly used in the operation of modern multimedia devices. However, because there are no in vivo measured force data of these joints - compared to other joints like the shoulder (Bergmann Citation2008) - these results cannot be validated quantitatively.
Taking a closer look at the outliers in the probability metrics of , it is evident that outliers are mainly finger joints that were rarely involved in the respective movement, such as the CMC and MCP joint of fingers 3–5 for the abduction of the thumb or the CMC joint of finger 3 for the flexion of the thumb. Only the MPC joint of the index finger (during the abduction of the thumb) and the CMC joints of the thumb and index finger (during the abduction of all fingers) seemed to be sensitive to changes in input parameters, although the movements addressed these joints. One possible reason for these joints' increased sensitivity could be the large number of intrinsic muscles running through the area between the index finger and the thumb.
When evaluating the scattering of the model’s outcome, the distribution of input parameters needs to be considered. The scattering magnitude is difficult to quantify in terms of the muscles’ insertion/origin area, but for PCSA, this is quite manageable. The anatomical data set from (Havelková et al. Citation2020) can be used to recalculate the average SD of PCSA values for all hand muscles, which is 38% of the corresponding mean. Weighting the individual muscles according to their size results only in a slightly smaller weighted average SD of 36.5%. Assuming a normal distribution of the underlying PCSA values, roughly 68% of the values are within an interval of ±36.5%. Comparing this measure of dispersion to that of the numerical outcomes shows that the model predictions do not scatter more than the input parameters (with the limitation of reference to the PCSA).
The LHS method used in this study has improved sampling efficiency compared to the Monte Carlo analysis, which has the disadvantage of requiring a large number of simulation runs. Accordingly, the number of 1.000 simulations seems to be sufficient compared to the Monte Carlo studies of Valente et al. (Citation2014) and Myers et al. (Citation2015) with 500 and 3.000 simulations, respectively.
Although the results show that the model seems to be relatively stable concerning changes in input parameters, this stability depends on the type of movement performed, which should also be considered in future analyses. Therefore, an attempt was made to depict a correspondingly comprehensive range of relevant movements being essential for modern everyday life.
This study has important implications for patient-specific scaling of musculoskeletal models. A common approach to patient-specific modeling is to scale the model’s force-specifically, which is analogous to changing the PCSA. Alternatively, it is also possible in the AMS to morph patient-specific bone geometries, which results in a shift of the muscle attachment points. The effects of both methods were illustrated in this study.
However, some limitations of this research need to be noted. The comparison of experimentally gained and numerically determined muscle activities introduces crosstalk, which is associated with the measurement of EMG signals (Konrad Citation2005). The kinematic inaccuracies that inevitably occur during the measurement can also impact model predictions (Myers et al. Citation2015). In combination with the inverse dynamic, these kinematic inaccuracies can cause unrealistic joint torques approach according to Bailly et al. (Citation2021). In addition, due to the time-independent nature of the static optimization, an inverse dynamic calculation prevents the activation dynamics from being taken into account. Both limitations can be circumvented by the forward dynamic approach. Another limitation of the used inverse dynamics approach is the impossibility of any direct kind of motion prediction.
Further, some assumptions about the distribution of input parameters had to be made when the anatomical data set did not provide exact data (e.g. for the SD of the third dimension of the origin/insertion area). In addition, it must be taken into account that this study did not investigate the direct effect of a change in muscle moment arms and thus the resulting variation in joint reaction forces. Rather, a change in the muscle line of action indirectly caused changes in the muscle moment arms. Finally, it is challenging to derive generally valid data from the measurement of only three different movements of a single person. However, we argue that these results provide valuable preliminary information, which can be useful to future investigations.
Conclusion
The study presented a sensitivity and stability analysis of the musculoskeletal hand model by Engelhardt and Melzner et al. (Citation2020) by changing the input parameters of the muscles' line of action. The results indicate the model's corresponding stability, which provides a reasonable basis for the patient-specific simulation of a broad population regarding the hand.
gcmb_a_1940974_sm2805.docx
Download MS Word (20.6 KB)gcmb_a_1940974_sm2418.pdf
Download PDF (1.3 MB)Disclosure statement
All authors of this manuscript have no conflict of interest.
Additional information
Funding
Related Research Data
References
- Bailly F, Ceglia A, Michaud B, Rouleau DM, Begon M. 2021. Real-time and dynamically consistent estimation of muscle forces using a moving horizon EMG-marker tracking algorithm-application to upper limb biomechanics. Front Bioeng Biotechnol. 9:642742.
- Barbero M, Merletti R, Rainoldi A, Jull GA. 2012. Atlas of muscle innervation zones. Understanding surface electromyography and its applications. Milan: Springer.
- Bergmann G, editor. 2008. OrthoLoad. Charité Universitaetsmedizin Berlin. February 1. https://orthoload.com.
- Cook D, Julias M, Nauman E. 2014. Biological variability in biomechanical engineering research: significance and meta-analysis of current modeling practices. J Biomech. 47(6):1241–1250.
- Criswell E, Cram JR. 2011. Cram's introduction to surface electromyography. 2nd ed. Sudbury (MA): Jones and Bartlett.
- Engelhardt L, Melzner M, Havelkova L, Fiala P, Christen P, Dendorfer S, Simon U. 2020. A new musculoskeletal AnyBody™ detailed hand model. Comput Methods Biomech Biomed Eng. :1–11.
- Gagnon D, Arjmand N, Plamondon A, Shirazi-Adl A, Larivière C. 2011. An improved multi-joint EMG-assisted optimization approach to estimate joint and muscle forces in a musculoskeletal model of the lumbar spine. J Biomech. 44(8):1521–1529.
- Gustafsson E, Johnson PW, Hagberg M. 2010. Thumb postures and physical loads during mobile phone use - a comparison of young adults with and without musculoskeletal symptoms. J Electromyogr Kinesiol. 20(1):127–135.
- Havelková L, Zítka T, Fiala P, Rybarova M, Tupý R, Kalis V, Ismail KM. 2020. Data for: hand muscles attachments: a geometrical model. https://zenodo.org/record/3953592#.Xxb4YufgphE.
- Helton JC, Davis FJ. 2003. Latin hypercube sampling and the propagation of uncertainty in analyses of complex systems. Reliab Eng Syst Saf. 81(1):23–69.
- Herzog W. 1992. Sensitivity of muscle force estimations to changes in muscle input parameters using nonlinear optimization approaches. J Biomech Eng. 114(2):267–268.
- Kendall FP. 2010. Muscles. Testing and function with posture and pain. 5th ed., International ed. Baltimore (MD): Lippincott Williams & Wilkins.
- Killick R, Fearnhead P, Eckley IA. 2012. Optimal detection of changepoints with a linear computational cost. J Am Stat Assoc. 107(500):1590–1598.
- Konrad P. 2005. The ABC of EM: A practical introduction to kinesiological electromyography, Noraxon Scottsdale. Version 1.0. Scottsdale, AZ: Noraxon.
- Lund M, Rasmussen J, Andersen M. 2019. AnyPyTools: a Python package for reproducible research with the AnyBody modeling system. JOSS. 4(33):1108.
- Myers CA, Laz PJ, Shelburne KB, Davidson BS. 2015. A probabilistic approach to quantify the impact of uncertainty propagation in musculoskeletal simulations. Ann Biomed Eng. 43(5):1098–1111.
- Nussbaum MA, Chaffin DB, Rechtien CJ. 1995. Muscle lines-of-action affect predicted forces in optimization-based spine muscle modeling. J Biomech. 28(4):401–409.
- Pieri Ed, Lund ME, Gopalakrishnan A, Rasmussen KP, Lunn DE, Ferguson SJ. 2018. Refining muscle geometry and wrapping in the TLEM 2 model for improved hip contact force prediction. PLoS One. 13(9):e0204109.
- Raikova RT, Prilutsky BI. 2001. Sensitivity of predicted muscle forces to parameters of the optimization-based human leg model revealed by analytical and numerical analyses. J Biomech. 34(10):1243–1255.
- Rebba R, Mahadevan S. 2008. Computational methods for model reliability assessment. Reliab Eng Syst Saf. 93(8):1197–1207.
- Reinbolt JA, Schutte JF, Fregly BJ, Koh BI, Haftka RT, George AD, Mitchell KH. 2005. Determination of patient-specific multi-joint kinematic models through two-level optimization. J Biomech. 38(3):621–626.
- Scheys L, Loeckx D, Spaepen A, Suetens P, Jonkers I. 2009. Atlas-based non-rigid image registration to automatically define line-of-action muscle models: a validation study. J Biomech. 42(5):565–572.
- Scheys L, Van Campenhout A, Spaepen A, Suetens P, Jonkers I. 2008. Personalized MR-based musculoskeletal models compared to rescaled generic models in the presence of increased femoral anteversion: effect on hip moment arm lengths. Gait Posture. 28(3):358–365.
- Seth A, Pandy MG. 2007. A neuromusculoskeletal tracking method for estimating individual muscle forces in human movement. J Biomech. 40(2):356–366.
- Smith TJ, Henning RA, Wade MG, Fisher T. 2014. Variability in human performance. Hoboken: Taylor and Francis (Human Factors and Ergonomics).
- Taddei F, Martelli S, Valente G, Leardini A, Benedetti MG, Manfrini M, Viceconti M. 2012. Femoral loads during gait in a patient with massive skeletal reconstruction. Clin Biomech (Bristol, Avon). 27(3):273–280.
- Valente G, Pitto L, Testi D, Seth A, Delp SL, Stagni R, Viceconti M, Taddei F. 2014. Are subject-specific musculoskeletal models robust to the uncertainties in parameter identification? PLoS One. 9(11):e112625.
- Valero-Cuevas FJ, Johanson M, Elise, Towles JD. 2003. Towards a realistic biomechanical model of the thumb: the choice of kinematic description may be more critical than the solution method or the variability/uncertainty of musculoskeletal parameters. J Biomech. 36(7):1019–1030.
- Żuk M, Pezowicz C. 2016. The influence of uncertainty in body segment mass on calculated joint moments and muscle forces. In Piętka E, Badura P, Kawa J, Wieclawek W, editors. Information Technologies in Medicine. 5th International Conference, ITIB 2016; Kamień Śląski, Poland; June 20–22; 2016 Proceedings, Volume 2. Cham, 2016. Cham: Springer International Publishing (Advances in Intelligent Systems and Computing, 472), p. 349–359.