
 ?Mathematical formulae have been encoded as MathML and are displayed in this HTML version using MathJax in order to improve their display. Uncheck the box to turn MathJax off. This feature requires Javascript. Click on a formula to zoom.
Abstract
Pedicle screw instrumentation is performed in the surgical treatment of a wide variety of spinal pathologies. A common postoperative complication associated with this procedure is screw loosening. It has been shown that patient-specific screw fixation can be automated to match standard clinical practice and that failure can be estimated preoperatively using computed tomography images. Hence, we set out to optimize three-dimensional preoperative planning to achieve more mechanically robust screw purchase allowing deviation from intuitive, standard screw parameters. Toward this purpose, we employed a genetic algorithm optimization to find optimal screw sizes and trajectories by maximizing the CT derived bone mechanical properties. The method was tested on cadaveric lumbar vertebrae (L1 to L5) of four human spines (2 female/2 male; age range 60–78 years). The main boundary conditions were the predefined, level-dependent areas of possible screw entry points, as well as the automatically located pedicle structures. Finite element analysis was used to compare the genetic algorithm output to standard clinical planning of screw positioning in terms of the simulated pull-out strength. The genetic algorithm optimization successfully found screw sizes and trajectories that maximize the sum of the Young’s modulus within the screw’s volume for all 40 pedicle screws included in this study. Overall, there was a 26% increase in simulated pull-out strength for optimized compared to traditional screw trajectories and sizes. Our results indicate that optimizing pedicle screw instrumentation in lumbar vertebrae based on bone quality measures improves screw purchase as compared to traditional instrumentation.
Introduction
Computational planning in surgery has the potential to improve surgical outcomes by the analysis of key aspects like patient-specific three-dimensional (3D) structures and biomechanics. The improvements made by simulation models and intraoperative navigation can be powerful tools to help in the selection and execution of an optimal intervention plan for different surgical approaches and patients (Taylor and Prendergast Citation2015; Vávra et al. Citation2017). In spinal surgery, fusion procedures are widely used to treat various pathologies, with the primary goal being the stabilization of the spine. Most instrumentation techniques to stabilize the spine through fusion consist of rod constructs fixed with pedicle screws (Verlaan et al. Citation2004; Mirza and Deyo Citation2007). Screw loosening has been identified as one of the major risk factors for functional deterioration of spinal stabilization after instrumentation (Tokuhashi et al. Citation2008; Kim et al. Citation2020). The reported incidence of loosening at the screw-bone interface spans a wide range, mainly between 10 and 30%, with highest rates observed in patients with poor bone quality (Ohlin et al. Citation1994; Abul-Kasim and Ohlin Citation2014; Bredow et al. Citation2016; Kim et al. Citation2020; Zou et al. Citation2020). The most commonly reported cause for failed fusion is low bone mineral density (BMD) (Krishnan et al. Citation2020), which can lead to postoperative pain and ultimately requiring revision surgery to stabilize the spinal segment.
Therefore, methods to improve the preoperative planning in spinal surgery—including the accuracy of pedicle screw placement—have been studied extensively in recent years (Xiaozhao et al. Citation2016; Farshad et al. Citation2017; Esfandiari et al. Citation2018). Many studies have focused on optimization methods for the positioning of screws in bones. In a recent study (Mischler et al. Citation2020) the orientation of the screws in proximal humerus plating was optimized using finite element (FE) simulations to minimize the strain around the screw tips. Their findings suggested that an optimization based on biomechanical aspects is required to improve the screws’ orientation and plate design. They concluded that a biomechanical-based analysis including patient-specific information could reduce complications related to implant instability by improving the design of the implant and the surgical plan. In Knez et al. (Citation2016) a computational planning of pedicle screw placement was implemented using an automatic segmentation of the vertebral bodies and the pedicles at the thoracic levels. The results were quantitatively compared with postoperative data in terms of screw’s size and insertion trajectory. A different study determined the placement of pedicle screws by using an anatomical atlas with reference trajectories defined a priori (Goerres et al. Citation2017). The deformable model was registered on manually segmented vertebrae and the screw shape was optimized. The optimized trajectories were quantitatively compared to manually planned reference trajectories. The optimization results presented in these studies are not deviating from standard clinical practice, suggesting that reducing screw loosening occurrence is not addressed.
In the study performed here, a deformable 3D model with labeled regions on the surface was used as input for the optimization method. The sum of assumed Young’s modulus values inside the screw’s volume was defined to determine how the individuals performed. Subsequently, the optimization output was used to create an FE model to computationally predict the screw fixation strength. A novel combination of the genetic algorithm (GA) method together with an FE analysis produced an automated framework able to determine and test the optimal screw position and size. The implementation used a combination of the input parameters to maximize mechanical properties of the vertebral bone contained within the screw’s simplified volume. In a final step, the GA output was evaluated through comparison with screw positioning according to clinical standard. For this purpose, automatically generated FE models of single screw pull-out were used (Widmer et al. Citation2020). The advantage of the implemented GA method is that it can discover non-intuitive screw placements that have the potential to surpass performance of screw purchase in standard clinical planning, according to the FE analysis.
Materials and methods
Genetic algorithm optimization
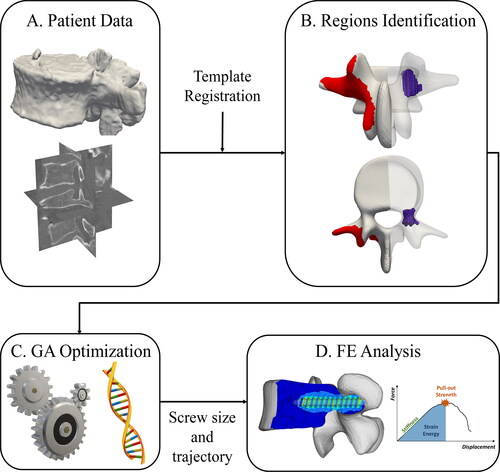
The present study was performed using four CT images of cadaver lumbar spines, acquired at the Balgrist University Hospital between 2018 and 2019 (Philips, Brilliance 64, 0.5 mm resolution). All the images were manually segmented by a medical professional using the 3D Slicer software (www.slicer.org). Five 3D models each representing one lumbar vertebra were generated from each image (). The initial population of the GA optimization was defined using a deformable 3D template model where possible screw entry points were labeled on the left and right side of the vertebral arch (). The template was non-rigidly registered on the segmented model in the Scalismo package (University of Basel, Switzerland) using a point set to image registration method as described in Clogenson et al. (Citation2015). Using the labeled regions on the template, it was possible to identify the entry region with respect to the segmented vertebral model after the non-rigid registration. The pedicles of the vertebra were automatically located after the registration step. The original CT image, the allowed screw entry points, and a 3D grid of evenly spaced points inside the pedicles were used as the initial population of the GA method. For each possible combination of entry and pedicle points, a screw was placed inside the vertebral model and evaluated using the CT image intensities transformed in Young’s modulus. The diameter and length of the screw were automatically optimized together with its position to maximize material properties within the screw volume.
Figure 1. Pipeline of the optimization process: The patient data (A) are combined with a template model to identify insertion points and pedicle regions (B) which are used as input for the GA optimization (C). The optimized screw size and trajectory are used to create an FE model to compare standard and optimized screw (D).
Initialization of the GA optimization
The identification of an initial population of insertion points on the 3D segmented lumbar vertebrae was performed with the non-rigid registration of a template model with labeled possible screw entry regions (). The pedicles are identified automatically using the vertebral endplates and the correspondence properties of the template model as shown in .
First, a line connecting the center of mass (CoM) of the vertebral body and the screw entry surface was established by selecting a random point inside the pedicle. Using polar coordinates centered at the vertebral CoM, an iterative process in axial, radial, and tangential directions was used to select other points inside the pedicles and create a 3D grid as shown in (blue area). The vertebral endplate boundaries were used to avoid the selection of points inside the vertebral body. The grid was created using doubled input image resolution, such that no image intensity information was lost during the procedure. The resulting grid was defined only inside the pedicle region with a safety distance of 2.5 mm to the vertebral surface, to avoid perforation of the lateral cortex.
In order to use the voxel intensities inside the vertebral model to evaluate the screw position, the segmented vertebra was used to create a mask of the original image. In this way, a subset of pixels from the original image could be used during the optimization, representing only the intensity values within the vertebra 3D model. All the other pixels not contained within the model volume were set to zero and therefore not considered during the GA iterations. The mask was created within the GIBBON framework (Moerman Citation2018) offering the possibility to correctly place the segmented mesh into the corresponding CT image based on DICOM information. Applying the mask substantially reduced the computational cost of the optimization.
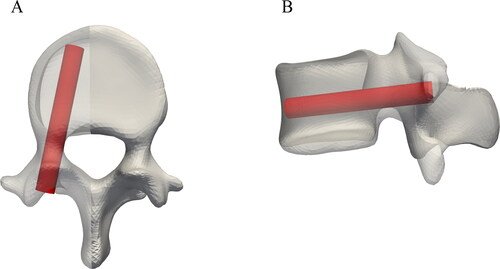
An expert spine surgeon used the planning software MySpine® (Medacta SA International, Switzerland) to define a clinically suitable standard screw trajectory for every pedicle of each considered cadaveric vertebra. Following clinical practice, this trajectory runs approximately through the middle of the pedicle and parallel to the transverse vertebral plane. Limiting factors for screw diameter and length are pedicle size and the distance to the anterior cortex of the vertebral body, respectively. The standard positions were subsequently used to place simplified screws within the vertebral 3D models () and to initialize the GA method for all the segmented vertebrae. The labeled entry points, the pedicle points, and available screw lengths and diameters were used as input for the optimization to create the initial population for the genetic algorithm. The screws dimensions varied between 25 and 80 mm in length (5 mm steps) and between 5 and 7 mm in diameter (1 mm steps). The dimensions were selected from the MUST (Medacta Universal Screw Technology) Pedicle Screw System (Medacta International SA, Castel San Pietro, Switzerland).
Figure 2. Illustration of a representative example of a standard, clinically suitable screw position defined by an expert spine surgeon in an L4 vertebrae.
To refer to the original GA definition, each combination of the optimization’s parameters is referred to as individual, which is composed of genes, i.e. the single parameters. Each individual’s performance was tested with respect to the defined fitness function (see next session). In each iteration, the previous population was used to create children. The creation of the new population was based either on mutation, where random changes were done to some individuals, or on crossover, a combination of individual’s genes. These new individuals were combined with the best performing ones from the previous population to form an updated population of candidates for the next iteration. This implementation allows a reduction of the search space in each iteration, and a faster convergence (Carrillo et al. Citation2017).
The implementation of the GA optimization
For each iteration of the optimization, a set of individuals were included in the population. The optimization parameters (genes) defining each individual were: the entry point the point in the pedicle region
the screw length
and the screw diameter
A cylinder representing the screw volume was constructed with these parameters and positioned inside the vertebra mask using the aforementioned points. The fitness function implemented to quantify each individual’s performance was considered to be the sum of the voxels’ intensities inside the cylinder transformed into Young’s modulus values. To determine the apparent bone density of each voxel in the CT image, the relationship presented in Rho et al. (Citation1995) was used on the Hounsfield Unit (HU) distribution:
(1)
(1)
The resulting apparent bone density was then converted to Young’s modulus values using the power law function found by Keller (Citation1994):
(2)
(2)
values were calculated in MPa for all the voxels of the CT image inside the vertebral structure of interest. Each voxel of the CT image was considered to be inside the screw volume if the center of the voxel was inside the cylinder, otherwise the voxels were excluded, and their respective intensity not considered in the total sum of Young’s modulus. This way, the resulting final screw position is the one indirectly maximizing the bone density within the screw’s volume. This approach follows the one based on fastening strength using HUs presented in Knez et al. (Citation2016), as it maximizes the sum of CT values by changing the position and the size of the screw.
In order to find results applicable to surgical practice two constraints were implemented. First, to avoid perforation of the cortical bone, the points of the cylindrical volume had to be inside the vertebral surface model, except for a small number of points at the cylinder’s head towards the insertion point. This account for the fact that the planar circular surface at the cylinder’s head will not perfectly match the irregular vertebral surface at the insertion point and therefore some points will be located outside of the vertebral mesh. The second constraint was implemented to avoid contact between screws in a bilateral insertion setup. For this purpose, the sagittal mid-plane was computed for all the vertebrae using the correspondence properties of the template model. Each screw was restricted to one side of the sagittal plane in all individuals. The constraints were implemented before the computation of the CT intensity’s sum, thus instantaneously excluding infeasible solutions from the next iteration of the GA, decreasing the computation time and leading to a faster convergence.
The population size for each iteration of the GA was set to 700 individuals, of which only the best performing one was guaranteed to survive and to be part of the next generation. Random changes (mutations) were allowed to explore different screws’ positions and to compare them with the best performing one in each iteration. The purpose of the latter approach was to minimize the chance that a local minimum was returned by the GA. The output of the optimization method was the combination of an entry point a point in the pedicle region
a screw length
and a screw diameter
which maximized the bone properties within the screw’s volume (). These parameters were compared with the standard screw position in terms of entry point, screw inclination on sagittal and axial planes, and screw size, i.e. diameter and length.
Table 1. Inputs of the optimization method, optimization parameters, fitness function, and constraints.
The FE model
For an evaluation of the GA optimization results in terms of the reachable screw fixation strength, FE analysis was used. Simulated resistance to axial pull-out was compared between different FE models for the optimized vs. the traditional screws’ positions. A custom developed computational testbench to simulate pull-out tests with FE models of screw-vertebra constructs has previously been validated with in vitro tests (Widmer et al. Citation2020). Two FE models with unilateral screw placement were constructed for every pedicle of every vertebra of all cadaveric lumbar spines. The screw properties in one model were based on the GA output parameters, while the screw trajectory in the second model was following a traditional trajectory as planned by a surgeon. First, Boolean subtraction of a screw triangular mesh from the mesh of the vertebral 3D model was performed to create a new volumetric mesh. The size and position of the screw mesh within the vertebra corresponded to the dimensions and location of the screw specified either by the optimization or by the standard clinical planning. Next, a tetrahedral volume mesh was created for the vertebral bone and the bone mechanical properties were mapped according to the CT intensity distribution (Rho et al. Citation1995). The bone was modeled as a bilinear elastoplastic Johnson-Cook material and a uniform plastic failure strain was used (Bianco et al. Citation2017). The friction coefficient between bone and implant was set to 0.2. The screw component was considered to be rigid and an imposed displacement in axial direction was applied on its head. All translational and rotational degrees of freedom of the outer vertebral body nodes were fixed to simulate movement restriction imposed during a biomechanical pull-out experiment. Model creation was fully automatized. The finite element solver RADIOSS (v. 2017.2, Altair Engineering Inc., Troy MI, USA) was running on 6 central processing units (Intel I9-7900 × 3.30 GHz). For further details concerning the FE analysis part, please refer to Widmer et al. (Citation2020).
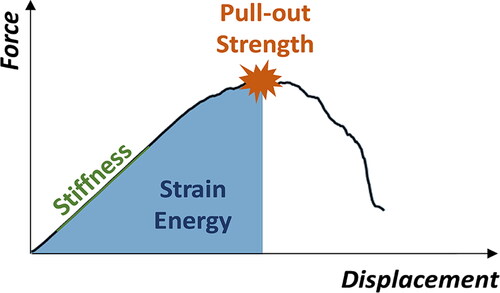
A force-displacement curve was obtained for every pull-out simulation. The optimized and the standard screw positions associated with each pedicle were compared in terms of pull-out strength, pull-out stiffness, and strain energy derived from the respective force-displacement curves (as depicted in ). The first force peak of the displacement vs. pull-out force curve with a drop of at least 30% was used as pull-out strength value, the maximal steepness of the linear part of the curve before reaching the force peak was defined as pull-out stiffness, and the area under the curve until reaching the maximal pull-out force was defined as strain energy.
Figure 3. Characteristics of the screw’s displacement vs. pull-out force behavior used for the comparison of the optimized and standard screw positions. The first force peak of the curve with a drop of at least 30% was defined as pull-out strength value. The maximal steepness of the linear part of the curve before reaching the force peak was defined as pull-out stiffness, and the area under the curve until the pull-out force was reached was the strain energy.
Statistical analysis
Descriptive statistics (either mean (SD) or median (IQR), depending on data distribution) were computed. A statistical comparison between standard screw positioning and the GA output was performed. The assumption of normal distribution of the residuals was evaluated with the Shapiro-Wilk test. Depending on these test results, either the paired t-test or the non-parametric Wilcoxon signed-rank test was used. Screw sizes (diameter and length) and screw trajectories (insertion point, sagittal inclination, and axial inclination) were compared. Further, differences in FE analysis results (pull-out strength, stiffness, and strain energy) were analyzed. The significance level α was set to 0.05.
Results
GA optimization results
The optimized pedicle screw positions for four lumbar spines were compared with the standard trajectories planned by an experienced spine surgeon. First, a quantitative comparison of the optimized pedicle screw sizes and trajectories was done by comparing the GA results with the standard ones. On average, the diameter was 0.075 (SD, 0.8) mm smaller for the optimized screws (), and the GA method resulted in shorter screws with an average difference of 4.75 (SD, 10.6) mm (). The distance between the screw insertion points of the optimized and the standard position was 10.5 (SD, 3.9) mm, the inclinations in the sagittal plane differed on average by 19.6 (SD, 11.1)° and in the axial plane the average difference was 10.9 (SD, 7.9).
Table 2 (a). Screw diameter differences [mm] between the clinical standard surgical plan vs. the GA result for the four considered cadaveric lumbar spines.
Table 2 (b). Screw length differences [mm] between the clinical standard surgical plan vs. the GA result for the four considered cadaveric lumbar spines.
shows the positions of the standard vs. the optimized screws inside the left pedicle of one vertebral model.
Figure 4. Example of a standard planned pedicle screw position in red vs. the resulting position from the GA method in blue for a L4 vertebra.
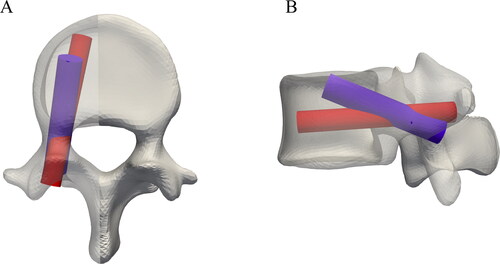
The results of the statistical analysis on screw sizes and trajectories showed significant changes in the insertion points of the screws, in the sagittal inclinations, and in the screws’ lengths (p < 0.01).
Optimized vs. standard FE models
For each vertebra, the optimization was run for the left and right pedicles and the resulting optimal position was compared to the output from standard planning using FE simulations for each side. The implemented pipeline successfully created 80 FE models automatically and performed simulation of axial pull-out experiments. The FE results were analyzed in terms of pull-out strength, stiffness, and strain energy. shows how the optimized positions resulted in an improved pull-out strength and strain energy for the majority of the cases, with a median increase of 26 (IQR, −7 to 79)% and 75 (IQR, 22 to 300)%, respectively. The optimized positions were able to increase the simulated pull-out strength by a maximum of 269% for one case. The largest decrease in performance observed was 37%, meaning the standard position produced better simulation results than the optimization solution. The pull-out strength values ranged between 113 and 2,267 N for the optimized position against 85 and 2,238 N for the standard screw insertions. The pull-out stiffness values were between 312 and 5,406 N/mm after the GA method and 459 and 7,098 N/mm in the standard cases, and the strain energy values were between 11 and 2,542 N mm, and 14 and 1,604 Nmm, for the optimized and the standard positions, respectively. Instead, the stiffness results showed overall a lower value for the optimized screw, with a median decrease of −13 (IQR, −29 to 11)%, the results are visible in .
Figure 5. Comparison between optimized and standard screws in terms of (A) pull-out strength, (B) strain energy, and (C) stiffness values across all the 80 FE simulations.
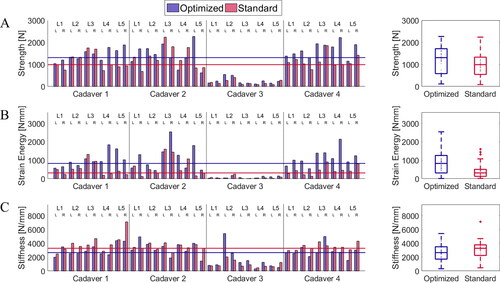
The median simulated pull-out strength, strain energy, and stiffness of the optimally positioned screws were 1,307 (IQR, 580 to 1,712) N, 827 (IQR, 311 to 1,259) N mm, 2,652 (IQR, 1,706 to 3,498) N/mm, respectively. While for the standard screws the same values were equal to 988 (IQR, 545 to 1,328) N, 314 (IQR, 127 to 507) N mm, and 3,280 (IQR, 2,244 to 3,771) N/mm, respectively. The results of the Wilcoxon signed rank test indicated that the simulated median pull-out strength differs significantly between the two compared planning methods (Z = 2.917, p = 0.004). The same was true for pull-out stiffness (Z = −2.473, p = 0.0134) and strain energy (Z = 4.261, p > 0.0001).
Discussion
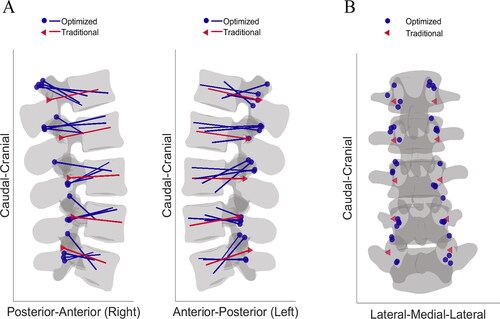
The GA implementation maximized radiologically estimated Young’s modulus values of the bone within the screw volume by optimizing screw lengths, diameters, and insertion trajectories. After manual segmentation, the optimization process and screw testing through FE simulations were performed automatically. When compared with clinical standard trajectories, the optimized screw instrumentations produced significantly better results in terms of pull-out strength and strain energy in the majority of pedicles (typical improvement of 26% and 75%, respectively). The screws’ sizes were similar in terms of diameters for the standard and GA output, whereas the optimized screws were shorter than those manually selected by the surgeon, on average. The difference in length should be analyzed together with the relative distance of the insertion point and the difference in sagittal angle. In fact, the standard insertion followed the straightforward technique parallel to the vertebral endplates (Roy-Camille et al. Citation1986). Instead, the outputs of the optimization were different in terms of trajectory, resulting in an insertion similar to the cortical bone trajectory (CBT) described in various studies (Matsukawa et al. Citation2018; Kim et al. Citation2019). The average distance of 10.5 (SD, 3.9) mm between standard and optimal insertion points reflected these different trajectories. Similarly, sagittal screw inclinations differed 19.6 (SD, 11.1). shows all the optimized trajectories visualized on a reference lumbar spine together with the standard screw trajectories of the represented spine and shows the different insertion points.
Figure 6. (A) Visualization of all the optimized screw trajectories (blue) in a reference lumbar spine projected on the sagittal plane compared with the standard plan (red). (B) Insertion points resulting from the GA method visualized on a reference lumbar spine with the standard insertion.
The differences we found are larger compared to the findings of other pedicle screw optimization studies (Goerres et al. Citation2017; Knez et al. Citation2019). In these investigations the implemented methods were more constrained and resulted in trajectories closer to the standard clinical ones. A key difference implemented in our optimization approach was the computation of Young’s moduli using HUs values from the input CT image. The power law function found by Keller (Citation1994) favored the influence of cortical bone in the GA, resulting in increased fitness values for CBT screw placement. Furthermore, the results of the FE simulations showing higher pull-out strength for optimized trajectories underlie the relevance of the optimization outcomes.
The pull-out force vs. displacement curves were analyzed in terms of stiffness and strain energy in addition to the pull-out strength. While the pull-out strength results of the optimized positions outperformed the standard position with a median 26 (IQR, −7 to 79)% improvement, the values observed for the pull-out stiffness were comparable between the optimized and the standard positions. In addition, the comparison of the strain energy was in favor of the optimized positions with an improvement of 75 (IQR, 22 to 300)%. Overall, our results suggest that the increased pull-out strength results in an overall increased strain energy outweighing the relative small decrease of the stiffness values. All the pull-out related parameters have a positive association with the material density (Varghese et al. Citation2017; Lee et al. Citation2019). When studying the contribution of various factors (i.e. density of the material surrounding the screw, insertion depth, and insertion angle) on experimental pull-out curve characteristics, density had a more considerable impact on the energy required to reach fixation failure than on the pull-out stiffness (Varghese et al. Citation2017). Our findings confirm that the strain energy is strongly affected by the optimization of the mechanical properties around the screw. The automated implementation of the GA optimization and FE model creation resulted in a robust construction of the computational models for the optimized and standard cases. The comparison of the screws was then performed between equally constructed models with the only difference being the position and the size of the screw inside the vertebral volumetric mesh. Such a comparison highlights the improved results of the optimized positions over the standard, which can be an important step towards a clinical application for surgical planning. An automated analysis of screw pull-out strength using patient-specific FE modeling can accelerate the integration of such methods in the clinical workflow (Zadpoor and Weinans Citation2015).
In this study, we presented a novel combination of an image-based optimization algorithm with an FE model, Such an approach prevents the use of costly and time-consuming biomechanical experiments for a first evaluation of the optimization results. The pipeline could be integrated into a clinical workflow to preoperatively analyze different vertebral instrumentations. The optimization method used a limited amount of constraints in order to keep a large search space for the solutions within the applicable range, which was defined a priori by an expert spine surgeon. The presented pipeline compared the GA output with a manually planned pedicle screw insertion based on results of automatically performed FE simulations. The setup allows manual changes of the screw position and testing of other screw trajectories, by creating simulation-ready FE models. This could complement traditional surgical planning by offering a quick preoperative biomechanical evaluation of different surgical solutions specifically for each patient. For severe pathological cases, i.e. if the vertebral geometry presents fractures or the vertebral body is collapsed, a user interaction is possible to manually test different screw settings using the biomechanical analysis. The GA implementation could be used as initialization to identify a population of possible solutions with higher bone properties. The surgeons could change screw’s parameters within this population and an optimal solution could be found with the support of the FE simulations. In addition, the pipeline does not depend on training data for the positioning of the screw, allowing non-intuitive screws selection and positioning being output by the GA, showing a potential improvement over standard clinical practice. It has been thoroughly studied how machine learning techniques could be beneficial for some portion of the optimization approach (Galbusera et al. Citation2019), as for the assessment of the final screw positioning (Esfandiari et al. Citation2018). However, those approaches lack the inclusion of important biomechanical aspects which are included in our automatized implementation thanks to FE simulations. Moreover, thanks to the FE simulations allowing for parametric investigations, single parameters of the surgical plan can be evaluated more accurately (Mischler et al. Citation2020).
In dorsal spinal instrumentation, methods for computational analysis supporting the preoperative planning phases are gaining considerable importance together with the increased popularity of intraoperative navigation (Dennler et al. Citation2020). Augmented reality together with the exploitation of additive manufacturing techniques for patient-specific surgical equipment have the potential to improve the accuracy of pedicle screw placement according to a preoperative plan (Malik et al. Citation2015; Farshad et al. Citation2017). These techniques combined with a computationally improved surgical plan accounting for important biomechanical aspects could not only improve clinical outcome by facilitating intraoperative instrumentation and enhancing accuracy (Farshad et al. Citation2017) but also by reducing complications such as screw loosening.
Limitations
Some limitations have to be considered related to this study. First, simulated pull-out is likely affected by a simplified representation of the screw-bone interface failure occurring in real instrumented vertebrae. Moreover, the virtual screw purchase test according to Widmer et al. (Citation2020) does not represent physiological loading since pull-out alone does not cover all clinically relevant failure modes (Kueny et al. Citation2014). In the future, additional in vitro biomechanical tests may be improved in order to investigate more physiological loading conditions as caudocephalic toggle, allowing a further validation of the FE model. Nevertheless, the validation of the FE setup showed a satisfactory agreement between simulated pull-out strength and experimental results (Widmer et al. Citation2020). Second, the clinical applicability of the optimized screw positions inside the vertebral structures has to be further evaluated by spinal surgeons. In fact, certain optimal positions may be critical in terms of bony surface skiving, also depending on the spinal level that needs to be instrumented. For this reason, the possible entry regions may have to be restricted based on the chosen surgical approach. The GA output should additionally be analyzed in terms of facet joint integrity, and in terms of continuity between the vertebrae regarding the possibility for rod positioning.
According to this analysis, the approach of leaving the optimization as unconstrained as possible may be revisited.
Conclusions
The implemented pipeline, which combines an optimization method based on a genetic algorithm with an FE framework, enables automatic creation of instrumented vertebra models and the simulation of pull-out strength for different screw positions and sizes. Comparing different vertebral instrumentations using validated FE models could reduce the risk of screw loosening by including patient-specific biomechanical aspects and therefore potentially improve surgical outcome. The FE-based analysis of pedicle screw positions demonstrated a significantly better performance of the optimized positions. Further, in vitro biomechanical tests are needed to experimentally determine the achievable improvement in screw fixation strength through the optimization of the instrumentation positioning.
Acknowledgments
The authors would like to acknowledge Med. Pract. F. Cornaz for segmenting the CT images. This work is part of ‘SURGENT’ under the umbrella of University Medicine Zurich/Hochschulmedizin Zürich.
Disclosure statement
The authors disclose ties to Incremed AG, Zurich, Switzerland, which is developing solutions for the preoperative planning of spinal surgeries. Mazda Farshad is a board member and Sebastiano Caprara is an employee of Incremed AG.
References
- Abul-Kasim K, Ohlin A. 2014. Evaluation of implant loosening following segmental pedicle screw fixation in adolescent idiopathic scoliosis: a 2 year follow-up with low-dose CT. Scoliosis. 9(1):13–17.
- Bianco RJ, Arnoux PJ, Wagnac E, Mac-Thiong JM, Aubin CÉ. 2017. Minimizing pedicle screw pullout risks: a detailed biomechanical analysis of screw design and placement. Clin Spine Surg. 30(3):E226–E232.
- Bredow J, Boese CK, Werner CML, Siewe J, Löhrer L, Zarghooni K, Eysel P, Scheyerer MJ. 2016. Predictive validity of preoperative CT scans and the risk of pedicle screw loosening in spinal surgery. Arch Orthop Trauma Surg. 136(8):1063–1067.
- Carrillo F, Vlachopoulos L, Schweizer A, Ladislav N, Snedeker J, Fürnstahl P. 2017. A time saver: optimization approach for the fully automatic 3d planning of forearm osteotomies. MICCAI 2017, Part II. p. 488–496.
- Clogenson M, Duff JM, Luethi M, Levivier M, Meuli R, Baur C, Henein S. 2015. A statistical shape model of the human second cervical vertebra. Int J Comput Assist Radiol Surg. 10(7):1097–1107. doi:.
- Dennler C, Jaberg L, Spirig J, Agten C, Götschi T, Fürnstahl P, Farshad M. 2020. Augmented reality-based navigation increases precision of pedicle screw insertion. J Orthop Surg Res. 15(1):174–178.
- Esfandiari H, Newell R, Anglin C, Street J, Hodgson AJ. 2018. A deep learning framework for segmentation and pose estimation of pedicle screw implants based on C-arm fluoroscopy. Int J Comput Assist Radiol Surg. 13(8):1269–1282.
- Farshad M, Betz M, Farshad-Amacker NA, Moser M. 2017. Accuracy of patient-specific template-guided vs. free-hand fluoroscopically controlled pedicle screw placement in the thoracic and lumbar spine: a randomized cadaveric study. Eur Spine J. 26(3):738–749.
- Galbusera F, Casaroli G, Bassani T. 2019. Artificial intelligence and machine learning in spine research. JOR Spine. 2(1):e1044.
- Goerres J, Uneri A, De Silva T, Ketcha M, Reaungamornrat S, Jacobson M, Vogt S, Kleinszig G, Osgood G, Wolinsky JP, et al. 2017. Spinal pedicle screw planning using deformable atlas registration. Phys Med Biol. 62(7):2871–2891.
- Keller TS. 1994. Predicting the compressive mechanical behavior of bone. J Biomech. 27(9):1159–1168.
- Kim DH, Hwang RW, Lee GH, Joshi R, Baker KC, Arnold P, Sasso R, Park D, Fischgrund J. 2020. Comparing rates of early pedicle screw loosening in posterolateral lumbar fusion with and without transforaminal lumbar interbody fusion. Spine J. 20(9):1438–1445.
- Kim J, Rajadurai J, Choy WJ, Cassar L, Phan K, Harris L, Fiechter M, Mobbs RJ. 2019. Three-dimensional patient-specific guides for intraoperative navigation for cortical screw trajectory pedicle fixation. World Neurosurg. 122:674–679.
- Knez D, Mohar J, Cirman RJ, Likar B, Pernuš F, Vrtovec T. 2016. Manual and computer-assisted pedicle screw placement plans: a quantitative comparison. In: Computational methods and clinical applications for spine imaging. CSI 2016. Lecture notes in computer science. Cham: Springer. 10182:105–115.
- Knez D, Nahle IS, Vrtovec T, Parent S, Kadoury S. 2019. Computer-assisted pedicle screw trajectory planning using CT-inferred bone density: a demonstration against surgical outcomes. Med Phys. 46(8):3543–3554.
- Krishnan V, Varghese V, Kumar GS, Yoganandan N. 2020. Identification of pedicle screw pullout load paths for osteoporotic vertebrae. Asian Spine J. 14(3):273–279.
- Kueny RA, Kolb JP, Lehmann W, Püschel K, Morlock MM, Huber G. 2014. Influence of the screw augmentation technique and a diameter increase on pedicle screw fixation in the osteoporotic spine: pullout versus fatigue testing. Eur Spine J. 23(10):2196–2202.
- Lee ES, Goh TS, Heo JY, Kim YJ, Lee SE, Kim YH, Lee CS. 2019. Experimental evaluation of screw pullout force and adjacent bone damage according to pedicle screw design parameters in normal and osteoporotic bones. Appl Sci. 9(3):586.
- Moerman KM. 2018. GIBBON: the geometry and image-based bioengineering add-on. JOSS. 3(22):506.
- Malik HH, Darwood ARJ, Shaunak S, Kulatilake P, El-Hilly AA, Mulki O, Baskaradas A. 2015. Three-dimensional printing in surgery: a review of current surgical applications. J Surg Res. 199(2):512–522. doi:10.1016/j.jss.2015.06.051.
- Matsukawa K, Abe Y, Yanai Y, Yato Y. 2018. Regional Hounsfield unit measurement of screw trajectory for predicting pedicle screw fixation using cortical bone trajectory: a retrospective cohort study. Acta Neurochir (Wien). 160(2):405–411.
- Mirza SK, Deyo RA. 2007. Systematic review of randomized trials comparing lumbar fusion surgery to nonoperative care for treatment of chronic back pain. Spine (Phila Pa 1976). 32(7):816–823.
- Mischler D, Windolf M, Gueorguiev B, Nijs S, Varga P. 2020. Computational optimisation of screw orientations for improved locking plate fixation of proximal humerus fractures. J Orthop Transl. 25:96–104.
- Ohlin A, Karlsson M, Duppe H, Hasserius R, Redlund-Johnell I. 1994. Complications after transpedicular stabilization of the spine. A survivorship analysis of 163 cases. Spine (Phila Pa 1976). 19(24):2774–2779.
- Rho JY, Hobatho MC, Ashman RB. 1995. Relations of mechanical properties to density and CT numbers in human bone. Med Eng Phys. 17(5):347–355.
- Roy-Camille R, Saillant G, Mazel C. 1986. Internal fixation of the lumbar spine with pedicle screw plating. Clin Orthop Relat Res. 203(203):7–17.
- Taylor M, Prendergast PJ. 2015. Four decades of finite element analysis of orthopaedic devices: where are we now and what are the opportunities? J Biomech. 48(5):767–778. doi:10.1016/j.jbiomech.2014.12.019.
- Tokuhashi Y, Matsuzaki H, Oda H, Uei H. 2008. Clinical course and significance of the clear zone around the pedicle screws in the lumbar degenerative disease. Spine (Phila Pa 1976). 33(8):903–908.
- Varghese V, Saravana KG, Krishnan V. 2017. Effect of various factors on pull out strength of pedicle screw in normal and osteoporotic cancellous bone models. Med Eng Phys. 40:28–38. doi:10.1016/j.medengphy.2016.11.012.
- Vávra P, Roman J, Zonča P, Ihnát P, Němec M, Kumar J, Habib N, El-Gendi A. 2017. Recent development of augmented reality in surgery: a review. J Healthc Eng. 2017:4574172.
- Verlaan JJ, Diekerhof CH, Buskens E, Van Der Tweel I, Verbout AJ, Dhert WJA, Oner FC. 2004. Surgical treatment of traumatic fractures of the thoracic and lumbar spine: a systematic review of the literature on techniques, complications, and outcome. Spine (Phila Pa 1976). 29(7):803–814.
- Widmer J, Fasser MR, Croci E, Spirig J, Snedeker JG, Farshad M. 2020. Individualized prediction of pedicle screw fixation strength with a finite element model. Comput Methods Biomech Biomed Engin. 23(4):155–167.
- Xiaozhao C, Jinfeng H, Baolin M, Chongnan Y, Yan K. 2016. A method of lumbar pedicle screw placement optimization applied to guidance techniques. Comput Assist Surg. 21:143–148.
- Zadpoor AA, Weinans H. 2015. Patient-specific bone modeling and analysis: the role of integration and automation in clinical adoption. J Biomech. 48(5):750–760.
- Zou D, Muheremu A, Sun Z, Zhong W, Jiang S, Li W. 2020. Computed tomography Hounsfield unit–based prediction of pedicle screw loosening after surgery for degenerative lumbar spine disease. J Neurosurg Spine. 32(5):716–721.