
 ?Mathematical formulae have been encoded as MathML and are displayed in this HTML version using MathJax in order to improve their display. Uncheck the box to turn MathJax off. This feature requires Javascript. Click on a formula to zoom.
Abstract
A methodology to explore the design space of off-the-shelf total knee replacement implant designs is outlined. Generic femur component and tibia plate designs were scaled to thousands of sizes and virtually fitted to 244 test subjects. Various implant designs and sizing requirements between genders and ethnicities were evaluated. 5 sizes optimised via the methodology produced a good global fit for most subjects. However, clinically significant over/underhang was present in 19% of subjects for tibia plates and 25% for femur components, reducing to 11/20% with 8 sizes. The analysis highlighted subtly better fit performance was obtained using sizes with unequal spacing.
1. Introduction
In total knee arthroplasty most surgeries are performed using ‘off-the-shelf’ (OTS), sized, implant components. Surgeons use X-ray imaging to select the most appropriate components from available stocks, usually from 5–8 sizes (Hitt et al. Citation2003; Wernecke et al. Citation2012). Due to the limited choice, the selection generally involves a compromise between preventing misalignment, achieving adequate bone coverage, and avoiding excessive areas of prosthesis over/underhang (OUH) (Shao et al. Citation2020). Oversizing and overhang have been found to result in painful soft-tissue irritation, osteophytes, intra-articular fibrous bands and can affect balancing in both femur components and tibia plates (Bonnin et al. Citation2013; Bonnin et al. Citation2016). Consequentially, femur components are often downsized during surgery (Dai, Scuderi, Penninger, et al. Citation2014). Undersizing and underhang however can lead to increased bleeding, osteolysis, laxity in flexion, subsidence, and instability (Hitt et al. Citation2003; Dai, Scuderi, Penninger, et al. Citation2014). Various authors have reported that OUH ≥3 mm can be regarded as clinically significant and leads to increased probability of complications post-surgery (Dai, Scuderi, Penninger, et al. Citation2014; Schroeder and Martin Citation2019; Shao et al. Citation2020).
The morphologies of the distal femur and proximal tibia vary considerably between patients. Many studies have looked at how the morphologies differ with factors including gender, race, and height, reporting substantial difference in medial-lateral (ML) and anterior-posterior (AP) sizing, as well as ML-AP aspect ratios (Hitt et al. Citation2003; Cheng et al. Citation2009; Gillespie et al. Citation2011; Mahfouz et al. Citation2012; Lim et al. Citation2013; Dai, Scuderi, Penninger, et al. Citation2014; Bonnin et al. Citation2016; Budhiparama et al. Citation2021). Manufacturers therefore offer total knee replacement (TKR) designs with differing sizes, ML-AP aspect ratios, as well as gender-specific options (Guy et al. Citation2012; Kim et al. Citation2015).
Numerous articles have investigated the fit of TKR models, adopting both clinical and virtual approaches. Hitt et al. (Citation2003); Li et al. (Citation2019); and Budhiparama et al. (Citation2021) measured the ML/AP sizes and aspect ratios for distal femurs and proximal tibias and compared them to common manufacturers’ models. Wernecke et al. (Citation2012) superimposed scans of tibia plates onto MRI images and evaluated the fit of different designs in terms of bone coverage and OUH. Sharma et al. (Citation2017) reported femur dimensions measured intraoperatively and compared the fit of standard and narrow components in terms of OUH. Bonnin et al. (Citation2013) performed analyses post-operatively linking tibia plate fit to clinical outcomes including pain and flexion. Clary et al. (Citation2014); Dai, Scuderi, Penninger, et al. (Citation2014); and Shao et al. (Citation2020) utilised computational-based approaches where ‘virtual surgery’ was performed to assess the fit of manufacturer models on digital subjects. The algorithms involved automatically placing the sized components on segmented CT scan data and evaluating the fit in terms of OUH. However, no studies were found that utilised a design of experiments (DOE) based approach to adjust implant geometry across the full sizing window and evaluate the resulting fit of different design types via clinical or computational means.
OTS implant components were not generally found to achieve satisfactory fits in related works. Mahoney and Kinsey (Citation2010) reported that overhang of ≥3 mm was present in 40% of 176 male and 68% of 261 female knees studied after TKR surgery, whilst Wernecke et al. (Citation2012) reported 49% of 101 subjects would see posterolateral overhang enough to cause popliteal tendon impingement in a study evaluating six different tibia plate designs. Schroeder and Martin (Citation2019) reported that by using customised solutions, cases of tibia plate overhang of ≥3 mm were reduced from 18% for OTS implant designs to zero in an intraoperative study featuring 44 knees. Furthermore, Arnholdt et al. (Citation2020) reported no OUH of of ≥3 mm was present in any of the planes measured after fitting custom femur and tibia plate components to 106 patients. The improved fit of customised options compared to OTS implant models has been shown to translate into lower revisions and complications post-surgery (Culler et al. Citation2017; Buller et al. Citation2018; Schroeder and Martin Citation2019).
Related works evaluating OTS implants have concentrated on a limited number of manufacturer sizes and implant designs and haven’t demonstrated how these could be optimised to improve outcomes for patients. Therefore, this study introduces a new approach for virtually assessing TKR implant designs utilising a full factorial DOE based methodology. The computational approach allows for a potentially infinite range of sizes and designs to be evaluated, without the need for clinical work. The study utilised generic implant designs to demonstrate the application of the method to optimise the implant sizes for a test population. The outcomes were then compared to results reported in the literature for commercially available OTS implant models as well as custom solutions.
2. Materials and methods
Two independent datasets were used for test subjects. CT scans of Asian Korean cadavers with a consistent resolution of 0.832 × 0.832 × 1 mm were received from the Korea Institute of Science and Technology Information (KISTI) (Lee and Lee Citation2010). Data was also sourced from the Osteoarthritis Initiative (OAI) consisting of high resolution (all 0.365 × 0.365 × 0.7 mm) MRI scans of White American subjects (Nevitt et al. Citation2006). For the OAI dataset, manual segmentation of the MRI data for 47 female and 30 male subject knees (77 in total) was performed to generate 3 D models of femur and tibia bones using 3 D Slicer (Fedorov et al. Citation2012). A ‘median’ smoothing function was applied to all segmented bones with a consistent kernel. The KISTI dataset was supplied with pre-segmented 3 D models from which 90 female and 77 male (167 in total) femur and tibia bones were utilised. Examples of the segmented 3 D models are shown in the left of .
Figure 1. The subject anatomy (left), scaled implant components (middle), and virtual fitting (right) is shown for the femur (top row) and the tibia (bottom row). Red dots on the right images show the location of the maximum OUH. Yellow plane illustrates the tibia bone resection plane.
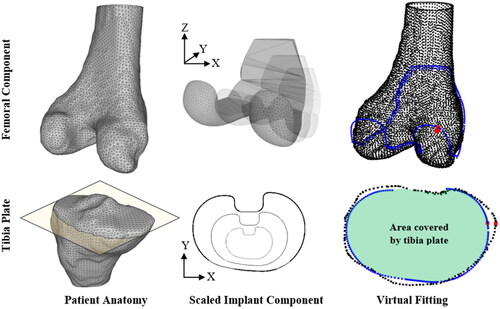
All segmented bone models were consistently aligned with the ML axis in the X direction, the AP axis in the Y direction, and the axial axis in the Z direction. This was done prior to implant fitting and completed automatically using a MATLAB script comprising of the ‘pcregrigid’ iterative-closest-point (ICP) method and correctly aligned, reference femur and tibia bone models.
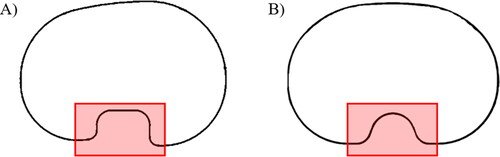
Generic base TKR femur and tibia plate components were modelled for use in the virtual fittings (). The design and dimensions of the base 3 D femur component were selected to closely mimic common manufacturer models. For tibia plates two generic 2 D profiles, one anatomic (asymmetric) and another symmetric, were designed ().
Figure 2. Tibia plate base designs ((A) anatomic, (B) symmetric). Red squares indicate the region of the tibia plate design not included in the fit analysis.
Before virtual fitting was performed each tibia plate was scaled in the X (ML) and Y (AP) dimensions (illustrated in ). Scaling in the XY plane, only, was satisfactory as the function of the tibia plate is to best match the profile of the resected bone, rather than replicating the 3 D form of the condylar region. Similar approaches were adopted by Clary et al. (Citation2014) and Shao et al. (Citation2020). For femur components scaling was applied in the X and Y dimensions, as well as with/without in the Z dimension. This facilitated investigation of fixed height and proportional design options. When scaling in the Z dimension was applied, the mean of the X and Y scaling factors was utilised instead of treating it as an independent degree of freedom. This helped limit the size of the DOE in this study but could be treated independently in future work.
Utilising a full factorial DOE allowed the complete sizing design space between specified ML and AP dimensions to be explored. Femur components were scaled, using increments of 1 mm, to ML and AP dimensions of 40–110mm to cover all subject bone sizes. Subsequently, the study had 1,024,800 design points including 4,200 different component size options fitted to the test subjects from each dataset. Tibia plates were scaled to ML dimensions of 35–110 mm and AP dimensions of 30–75mm, also in increments of 1 mm. This resulted in 823,500 design points including 3,375 different sizes to be fitted to the test subjects.
Component scaling and virtual implant fitting was performed automatically for each of the design points using scripts written in Python 3. Within the automated Python scripts, components were scaled to the required sizes and then fitted to the test subjects using a ridged ICP method included in the Visualization Toolkit (VTK version 9.0.3.) library in a similar way to that described by (Clary et al. Citation2014). For femur components the fitting process was performed between the 3 D patient anatomy and the implant surface. For tibia plates the 2 D profile of the scaled plate was fitted to a 2 D cross-section of the bone captured via a bisection plane positioned 2 mm below the height of the widest point of the medial condyle, parallel with the surface of the tibia plateau. The method, illustrated in , was used to achieve the largest possible surface area for stability, whilst minimising bone loss (Schnurr et al. Citation2011). The 2 mm offset was used to ensure a continuous resection plane could be created through the bone below the articular surfaces of the condyles. The cut sections highlighted by the box in were excluded during the fitting process.
Various methods have been reported for calculating OUH for TKR implant components with authors utilising specific regions or measurements such as the widest mediolateral dimensions (Bonnin et al. Citation2013; Dai, Scuderi, Penninger, et al. Citation2014; Sharma et al. Citation2017), whilst others reported distances at any point along the edges of the components (Wernecke et al. Citation2012; Clary et al. Citation2014; Shao et al. Citation2020). In this study, the maximum OUH was reported as the Hausdorff distance (h) anywhere between the edges of the component (C) to the edges of the bone after resection (B), described by EquationEquation (1)(1)
(1) . The distance (d) between each point along the edges of the component (c) and bone (b) were calculated as the Euclidian distance.
(1)
(1)
The root-mean-squared error (RMSE) between the surface of the component and the subject anatomy was calculated as an indication of the global fit, described by EquationEquation (2)(2)
(2) :
(2)
(2)
where N is the number of points and
is the Euclidian distance between each point of the component surface and the bone. For tibia plates, OUH and RMSE were calculated using the 2 D profile of the fitted plate and the cross-section at the resection point on the tibia ().
A filtered down subset comprising just the results for each test subject with the lowest maximum OUH value, as well as the lowest RMSE, were collected and used as ‘best fit’ data. For analysing the results independent parametric samples t-tests were utilised with p values ≤ 0.05 considered statistically significant.
3. Results
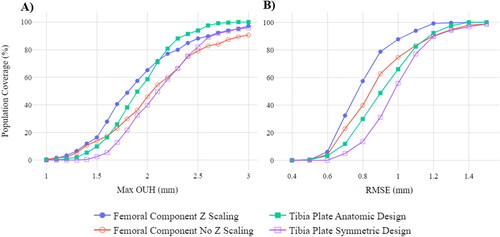
Z scaling of femur components (fixed height and proportional designs) and the two tibia plate design styles (anatomic and symmetric) were evaluated in terms of population coverage when all possible component sizes were considered. illustrates the percentage of the test population covered at different threshold values for maximum OUH (A) and RMSE (B). In terms of maximum OUH, femur components with Z scaling resulted in 97.13% of the population attaining values of <3 mm, compared to just 90.57% without. For the tibia plate designs at the same threshold, 100% were covered for the anatomic design compared to 95.90% for the symmetric. For RMSE, both variants for each component type were found to cover >98% of the population at a < 1.5 mm RMSE threshold.
Figure 3. Population coverage at various thresholds when all possible component sizes considered for various design types. Maximum OUH (A) and RMSE (B).
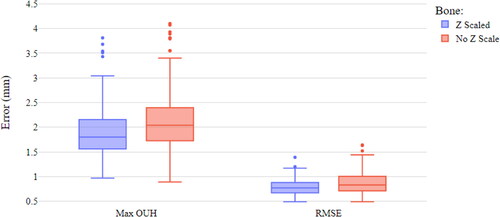
shows a box plot of the best fit data for femur components with and without Z scaling. The medians for both the maximum OUH and RMSEs can be seen to be higher when Z scaling was not applied with 9.43% achieving maximum OUH results ≥3mm. Nonetheless, even when Z scaling was included, 2.87% of subjects were above the clinically significant maximum OUH of ≥3 mm. The differences in maximum OUH and RMSE for with and without Z scaling were found to be statistically significant.
Figure 4. Box plot of femur component results with and without Z scaling.
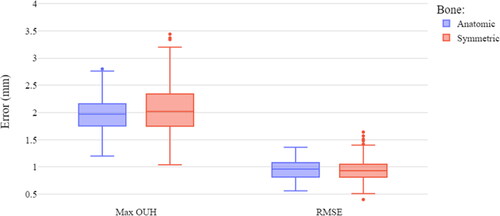
presents the difference between the best fit data for the two tibia plate designs. The anatomic design produced median values of maximum OUH slightly below the symmetric design. However, for RMSE the median for the symmetric design was marginally lower than the anatomic, but with more variability. The anatomic design resulted in no subjects with OUH ≥3mm, compared to 4.10% for the symmetric. The difference in maximum OUH for the two designs was found to be statistically significant, but the difference in RMSE was not. Based on these results the remainder of the analysis was limited to femur components with Z scaling (proportional designs) and the anatomic tibia plate design.
Figure 5. Box plot of tibia plate design results.
shows the size differences relating to gender and ethnicity in terms of ML and AP sizing. shows the ML-AP aspect ratio in relation to the AP size, also for gender and ethnicity. The best fit curves for each component type are included.
Figure 6. ML sizing (A) and ML/AP ratio (B) vs. AP sizing for genders and ethnicities, split by femur and tibia plate components.
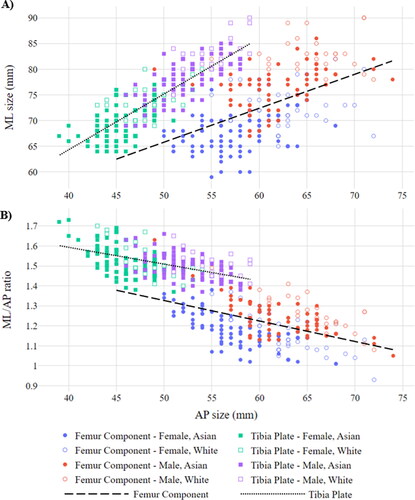
The maximum OUH best fit data subset was used to assess the difference in size requirements between genders and ethnicities. The average male subject required a femur component with a ML size of 78 mm (SD 4.89 mm) and an AP size of 63 mm (SD 4.55 mm), whilst females required 69 mm (SD 2.25 mm) and 58 mm (SD 5.16 mm), respectively. For tibia plates, males on average required a ML size of 79 mm (SD 4.47 mm) and an AP size of 53 mm (SD 3.23 mm), whilst females required 71 mm (SD 3.84 mm) and 46 mm (SD 2.91 mm), respectively.
The average Asian Korean required a femur component with a ML size of 72 mm (SD 6.05 mm) and an AP size of 59 mm (SD 5.18 mm), whilst White Americans required 76 mm (SD 6.29 mm) and 64 mm (SD 4.19 mm), respectively. For tibia plates, Asian Koreans on average required a ML size of 73 mm (SD 5.52 mm) and an AP size of 48 mm (SD 4.23 mm), whilst White Americans required 77 mm (SD 5.33 mm) and 51 mm (SD 4.07 mm), respectively. All the differences in size requirements between the Asian Korean and White American subjects were statistically significant.
In terms of ML-AP aspect ratios, the average male required a femur component with a ratio of 1.25 (SD 0.096) and 1.50 (SD 0.062) for a tibia plate. The average female required a femur component with a ratio of 1.19 (SD 0.11) and 1.52 (SD 0.078) for a tibia plate. The differences in ML-AP aspect ratio between males and females for both femur and tibia plate components were statisically significant.
The average Asian Korean required a femur component with a ML-AP aspect ratio of 1.22 (SD 0.11) and 1.51 (SD 0.074) for a tibia plate. The average White American subject required a ratio of 1.21 (SD 0.11) for a femur component and 1.51 (SD 0.070) for a tibia plate. The differences in ML-AP aspect ratio between Asian Koreans and White Americans for both femur and tibia plate components were not statisically significant (p values of 0.26 for femur components and 0.98 for tibia plates).
4. Discussion
The analysis has shown the effect that different designs and scaling techniques can have on the fit performance of TKR implant components. Comparing anatomic and symmetric tibia plate designs supported conclusions made in previous works that the former resulted in better fitting components (Wernecke et al. Citation2012; Martin et al. Citation2014). Completing the femur component analysis with and without Z scaling showed the importance of implant sizing being proportional in all three dimensions. The differences in maximum OUH between femur and tibia plate component types were found to be statistically significant and, in both cases, the inferior options resulted in an increased proportion of subjects with maximum OUH ≥3 mm. This is particularly important for effective implant design due to the increased probability of complications post-surgery (Dai, Scuderi, Penninger, et al. Citation2014; Schroeder and Martin Citation2019; Shao et al. Citation2020).
Looking at the difference in best fitting components split by gender and ethnicity () confirmed male and White American subjects required larger sizes for both femur and tibia plate components. In terms of ML-AP aspect ratio, males required femur components with larger ratios, but the opposite was found to be true for tibia plates where females benefited from slightly larger ratios. These findings were statistically significant and consistent with results published by Mahfouz et al. (Citation2012) and Lim et al. (Citation2013). Despite the difference identified in size between Asian Koreans and White Americans, the discrepency in ML-AP aspect ratios between the datasets was however not significant. Lastly, shows a strong negative correlation between increasing AP sizes and the corresponding ML-AP aspect ratios across all subjects and component types which is consistent with other authors (Hitt et al. Citation2003; Li et al. Citation2019).
shows that the best fitting components for the test subjects evaluated did not perfectly follow linear ML-AP sizing relationships, as shown in other studies (Gillespie et al. Citation2011; Lim et al. Citation2013). shows that when any size within the limits of the DOE was offered, the population covered within clinically significant thresholds approached 100% as expected. Nevertheless, offering thousands of sizes covering all ML-AP aspect ratios would be challenging in terms of cost and logistics. Consequentially, manufacturers usually only offer around eight, equally spaced options, typically following a linear ML-AP relationship (Hitt et al. Citation2003; Lim et al. Citation2013; Dai, Scuderi, Bischoff, et al. Citation2014). Hence this provokes the question ‘how adequately can OTS implant designs, with a limited number of sizes, cover a broad population?’.
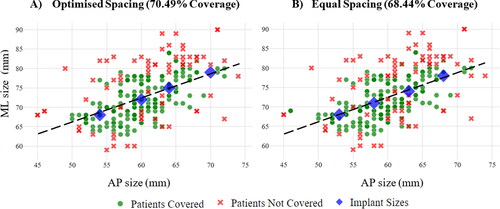
By evaluating the population coverage of all sizing combinations when limited to a discrete number of options, it was possible to determine the optimal fit performance of the generic models used in this study. For one to eight sizes, all combinations within the limits of the DOE that fell on the best fit curves shown in were considered before the selection resulting in the highest population coverage for each fit metric were chosen. gives an example of the population covered at a maximum OUH of <3 mm with the best possible combinations of four femur component sizes when optimised (A) and equal (B) spacing was used, demonstrating a subtle improvement. It should be noted that although some ‘not covered’ data points are close to the selected sizes, the best possible result for the individual may still be above the maximum OUH of <3 mm threshold.
Figure 7. Population coverage (in terms of maximum OUH values of <3mm) for four femur component sizes with optimised spacing (A) and equal spacing (B).
details the outcome of the full analysis for both component types utilising various thresholds. It includes results for equal and optimised spacing where no fixed gap between sizes was mandated. Optimised spacing resulted in slightly better population coverage compared to equally spaced (∼2% average improvement) when four or more sizes were used.
Figure 8. Population coverage (for various fit metrics) vs. number of femur component and tibia plate sizes for equal and optimised spacing.
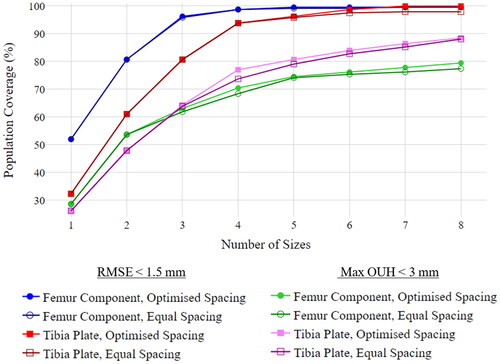
In terms of a global fit, a threshold of <1.5 mm RMSE resulted in >95% of the population being covered with just three femur component and five tibia plate sizes. However, if a threshold of <3 mm maximum OUH is required, for eight optimally spaced sizes, the best selection covered 79.51% of the population for femur components and 88.52% in the case of tibia plates. Therefore, although a reasonably low number of sizing options was found to afford a high population coverage in terms of global sizing, regions of exposed bone and clinically significant OUH would still be present in a high proportion of subjects. Consequently, it should be noted that sizing optimisation should not be limited to singular metrics. The analysis was also run with a tighter threshold of <2 mm maximum OUH which, for eight optimally spaced sizes, yielded only a 27.46% population coverage for femur components and 23.77% for tibia plates. Repeating the analysis with 25 sizes for each (effectively covering the full length of the best fit lines in AP increments of 1 mm) showed only marginal improvements to 31.15% for femur components and 29.51% for tibia plates at this threshold. Based on these results, and the spread shown in , it can be concluded that simply increasing the number of fixed sizes further wouldn’t achieve a coverage comparable to that achieved for <3 mm whilst a linear ML-AP relationship is utilised.
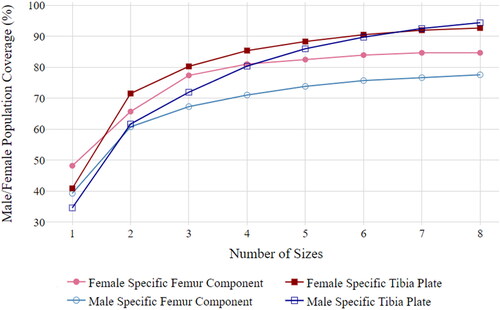
As a significant difference between genders was found in terms of ML-AP aspect ratio, the analysis was repeated for maximum OUH <3 mm with two separate sets of optimally spaced sizes using separate best fit curves created for males and females. demonstrates that with two sets of eight gender-specific sizes, 84.67% of females and 77.57% of males acheived maximum OUH values of <3 mm for femur components, along with 92.70% of females and 94.39% of males for tibia plates. This improvement for both component types suggests, although gender-specific sizes may not be needed for a good global fit, they could help minimise areas of OUH. This conclusion supports findings reported by Kim et al. (Citation2015) and Sappey-Marinier et al. (Citation2020), however the authors argued that the reduction in overhang did not translate into improved clinical outcomes.
Figure 9. Male/female population coverage (in terms of maximum OUH values of <3mm) vs. number of femur component and tibia plate sizes for female and male-specific designs with optimised spacing.
Previous works have demonstrated increasing the number of component sizes can improve performance (Dai, Scuderi, Penninger, et al. Citation2014; Morris et al. Citation2016; Budhiparama et al. Citation2021). However this study has shown, even with optimally spaced gender-specific sizes and designs, a limited number of implant sizes will never achieve results comparable to those reported for custom solutions (Schroeder and Martin Citation2019; Arnholdt et al. Citation2020). That being said, customised solutions currently only make up <1% of the TKR market (Evers Citation2019). Recent advancements in customised solutions however have sought to overcome the inherent issues of the technology including the need for 3 D medical imaging, higher component costs and longer lead times. Jun (Citation2011) and Burge et al. (Citation2022) outlined novel customisation processes with the latter describing a fully automated pipeline based on bi-planar X-rays. Nevertheless, solutions like these have not yet been commercialised or clinically validated. When the drawbacks of customisation (need for 3 D imaging, longer lead times and higher component costs) are mitigated, and the technology becomes more widely adopted, rather than replacing OTS implant components altogether, customised implants could compliment them by servicing patients who lie outside of the sizing architypes. and demonstrated that OTS solutions can afford adequate coverage for a large proportion of patients and that by using the method outlined in this paper considerably higher performance could be obtained for OTS implant components with optimised sizing compared to that reported in the literature (Mahoney and Kinsey Citation2010; Wernecke et al. Citation2012). Nethertheless, having the option of additional customisation for ‘non-standard’ anatomies, where a poor fit would be likely, could help improve patients outcomes.
The virtual fitting-based approach used in this study allowed the full sizing design space of OTS implant components to be assessed without clinical burden. The study concentrated on a limited number of generic base component designs which have not been clinically tested nor approved for use. The intent is that manufacturers could adopt the methodology outlined to help expedite the design of new implant designs or assess the performance of current models for specific populations. It is hoped that this could help limit costs and time required to bring new products to market and encourage innovation. By optimising the sizing and spacing between sizes of components manufacturers could also potentially minimise the number of model sizes needed. Healthcare providers could use the methodology to identify the best manufacturer models and reduce the need for large inventories of implants and instrumentation trays. It should be noted that, like with other virtual approaches (Clary et al. Citation2014; Shao et al. Citation2020), the method outlined is limited in its ability to detect and account for osteophytes or bony irregularities which could lead to unreliable results for subjects with more severe arthritis. The study results were not verified by a medical professional and no real clinical outcomes were assessed. Instead, results were determined by calculated fit metrics compared to thresholds widely accepted in the literature.
5. Conclusion
This paper outlined a novel, full factorial DOE based approach for evaluating and optimising the performance of OTS TKR implants computationally. The analysis demonstrated through case studies that, in terms of global fit, implants with at least 5 sizes, following a linear ML-AP relationship, adequately covered >95% of test subjects. However, achieving clinically acceptable OUH for a similar proportion of subjects, even when up to 16 (two sets of 8) gender-specific sizes were used, was not found to be feasible. Consequentially, customised solutions would need to be used in parallel with OTS models to adequately cover the full test subject population. Furthermore, the analysis demonstrated that subtly better fit performance could be obtained when using optimised sizes with unequal spacing.
Acknowledgments
Data and/or research tools used in the preparation of this manuscript were obtained and analysed from the controlled access datasets distributed from the Osteoarthritis Initiative (OAI), a data repository housed within the NIMH Data Archive (NDA). OAI is a collaborative informatics system created by the National Institute of Mental Health and the National Institute of Arthritis, Musculoskeletal and Skin Diseases (NIAMS) to provide a worldwide resource to quicken the pace of biomarker identification, scientific investigation and OA drug development. Dataset identifier(s): [10.15154/1523045]. The study also used data from the Digital Korean provided by the Korea Institute of Science and Technology Information (KISTI).
Disclosure statement
No potential conflict of interest was reported by the authors.
Data availability statement
Access to the data used in this study can be requested by contacting the OAI and the KISTI.
Additional information
Funding
References
- Arnholdt J, Kamawal Y, Horas K, Holzapfel BM, Gilbert F, Ripp A, Rudert M, Steinert AF. 2020. Accurate implant fit and leg alignment after cruciate-retaining patient-specific total knee arthroplasty. BMC Musculoskelet Disord. 21(1):699.
- Bonnin MP, Saffarini M, Bossard N, Dantony E, Victor J. 2016. Morphometric analysis of the distal femur in total knee arthroplasty and native knees. Bone Joint J. 98-B(1):49–57.
- Bonnin MP, Saffarini M, Shepherd D, Bossard N, Dantony E. 2016. Oversizing the tibial component in TKAs: incidence, consequences and risk factors. Knee Surg Sports Traumatol Arthrosc. 24(8):2532–2540.
- Bonnin MP, Schmidt A, Basiglini L, Bossard N, Dantony E. 2013. Mediolateral oversizing influences pain, function, and flexion after TKA. Knee Surg Sports Traumatol Arthrosc. 21(10):2314–2324.
- Budhiparama NC, Lumban I, Nadia G, Ifran N, De Groot PCJ, Novembri D, Rob U. 2021. Mismatched knee implants in Indonesian and Dutch patients: a need for increasing the size. Knee Surg Sports Traumatol Arthrosc. 29(2):358–369.
- Buller LT, Menken L, Rodriguez JA. 2018. The custom total knee replacement: A bespoke solution. Semin. Arthropl. 29(3):209–213.
- Burge TA, Jeffers JRT, Myant CW. 2022. Development of an automated mass-customization pipeline for knee replacement surgery using biplanar X-rays. J Mech Des. 144(2):1–11.
- Cheng FB, Ji XF, Lai Y, Feng JC, Zheng WX, Sun YF, Fu YW, Li YQ. 2009. Three dimensional morphometry of the knee to design the total knee arthroplasty for Chinese population. Knee. 16(5):341–347.
- Clary C, Aram L, Deffenbaugh D, Heldreth M. 2014. Tibial base design and patient morphology affecting tibial coverage and rotational alignment after total knee arthroplasty. Knee Surg Sports Traumatol Arthrosc. 22(12):3012–3018.
- Culler SD, Martin GM, Swearingen A. 2017. Comparison of adverse events rates and hospital cost between customized individually made implants and standard off-the-shelf implants for total knee arthroplasty. Arthroplast Today. 3(4):257–263.
- Dai Y, Scuderi GR, Bischoff JE, Bertin K, Tarabichi S, Rajgopal A. 2014. Anatomic tibial component design can increase tibial coverage and rotational alignment accuracy: a comparison of six contemporary designs. Knee Surg Sports Traumatol Arthrosc. 22(12):2911–2923.
- Dai Y, Scuderi GR, Penninger C, Bischoff JE, Rosenberg A. 2014. Increased shape and size offerings of femoral components improve fit during total knee arthroplasty. Knee Surg Sports Traumatol Arthrosc. 22(12):2931–2940.
- Evers M. 2019. Robotics, ASCs will continue to drive knee replacement market trends. [Chagrin Falls, (OH)]: ORTHOWORLD; [accessed 2022 Jan 18]. https://www.orthoworld.com/robotics-ascs-will-continue-to-drive-knee-market-trends/.
- Fedorov A, Beichel R, Kalpathy-Cramer J, Finet J, Fillion-Robin JC, Pujol S, Bauer C, Jennings D, Fennessy F, Sonka M, et al. 2012. 3D Slicer as an image computing platform for the Quantitative Imaging Network. Magn Reson Imag. 30(9):1323–1341.
- Gillespie RJ, Levine A, Fitzgerald SJ, Kolaczko J, DeMaio M, Marcus RE, Cooperman DR. 2011. Gender differences in the anatomy of the distal femur. J Bone Jt Surg. 93-B(3):357–363.
- Guy SP, Farndon MA, Sidhom S, Al-Lami M, Bennett C, London NJ. 2012. Gender differences in distal femoral morphology and the role of gender specific implants in total knee replacement: a prospective clinical study. Knee. 19(1):28–31.
- Hitt K, Shurman JR, Greene K, McCarthy J, Moskal J, Hoeman T, Mont MA. 2003. Anthropometric measurements of the human knee: correlation to the sizing of current knee arthroplasty systems. J Bone Jt Surg. 85:115–122.
- Jun Y. 2011. Morphological analysis of the human knee joint for creating custom-made implant models. Int J Adv Manuf Technol. 52(9-12):841–853.
- Kim JM, Kim SB, Kim JM, Lee DH, Lee BS, Bin SI. 2015. Results of gender-specific total knee arthroplasty: comparative study with traditional implant in female patients. Knee Surg Relat Res. 27(1):17–23.
- Lee SH, Lee SB. 2010. Production and usage of korean human information in KISTI. J Korea Cont Assoc. 10(5):416–421.
- Li K, Saffarini M, Valluy J, Desseroit MC, Morvan Y, Telmon N, Cavaignac E. 2019. Sexual and ethnic polymorphism render prosthetic overhang and under-coverage inevitable using off-the shelf TKA implants. Knee Surg Sports Traumatol Arthrosc. 27(7):2130–2139.
- Lim HC, Bae JH, Yoon JY, Kim SJ, Kim JG, Lee JM. 2013. Gender differences of the morphology of the distal femur and proximal tibia in a Korean population. Knee. 20(1):26–30.
- Mahfouz M, Fatah EEA, Bower LS, Scuderi G. 2012. Three-dimensional morphology of the knee reveals ethnic differences. Clin Orthop Relat Res. 470(1):172–185.
- Mahoney OM, Kinsey T. 2010. Overhang of the femoral component in total knee arthroplasty: Risk factors and clinical consequences. J Bone Jt Surg. 92A(5):1115–1121.
- Martin S, Saurez A, Ismaily S, Ashfaq K, Noble P, Incavo SJ. 2014. Maximizing tibial coverage is detrimental to proper rotational alignment knee. Clin Orthop Relat Res. 472(1):121–125.
- Morris WZ, Gebhart JJ, Goldberg VM, Wera GD. 2016. Implant size availability affects reproduction of distal femoral anatomy. J Knee Surg. 29(5):409–413.
- Nevitt M, Felson D, Lester G. 2006. The osteoarthritis initiative: protocol for the cohort study. The Osteoarthritis Initiative. Retrieved from: https://nda.nih.gov/oai/study-details
- Sappey-Marinier E, Swan J, Batailler C, Servien E, Lustig S. 2020. No clinical benefit from gender-specific total knee replacement implants: A systematic review. Sicot J. 6(25):25–28.
- Schnurr C, Csécsei G, Nessler J, Eysel P, König DP. 2011. How much tibial resection is required in total knee arthroplasty? Int Orthop. 35(7):989–994.
- Schroeder L, Martin G. 2019. In vivo tibial fit and rotational analysis of a customized, patient-specific TKA versus off-the-shelf TKA. J Knee Surg. 32(6):499–505.
- Shao L, Wu XD, Wang T, Liu XK, Xu W, Huang W, Zeng ZM. 2020. Approximating the maximum tibial coverage in total knee arthroplasty does not necessarily result in implant malrotation. Sci Rep. 10(10529):1–9.
- Sharma G, Liu D, Malhotra R, Zhou YX, Akagi M, Kim TK. 2017. Availability of additional mediolateral implant option during total knee arthroplasty improves femoral component fit across ethnicities results of a multicenter study. JBJS OA. 2(2):e0014–10.
- Wernecke GC, Harris IA, Houang MTW, Seeto BG, Chen DB, MacDessi SJ. 2012. Comparison of tibial bone coverage of 6 knee prostheses: a magnetic resonance imaging study with controlled rotation. J Orthop Surg (Hong Kong). 20(2):143–147.