
Abstract
Objectives: The biological mechanisms linking diet-related obesity and depression remain unclear. Therefore, we examined the impact of high-fat diet (HFD) on murine behaviour, intestinal microbiome, brain metabolome, neuropeptide Y (NPY) expression, and dipeptidyl peptidase-4 (DPP-4) activity.
Methods: Male C57Bl/6J mice were fed an HFD (60 kJ% from fat) or control diet (12 kJ% from fat) for 8 weeks, followed by behavioural phenotyping. Caecal microbiome was analysed by 16S rDNA sequencing, brain metabolome by 1H nuclear magnetic resonance, NPY expression by PCR and immunoassay, and dipeptidyl peptidase-4 (DPP-4) activity by enzymatic assay. The effect of a 4-week treatment with imipramine (7 mg/kg/day) and the DPP-4 inhibitor sitagliptin (50 mg/kg/day) on HFD-induced behavioural changes was also tested.
Results: HFD led to a depression-like phenotype as revealed by reduced sociability and sucrose preference. In the caecum, HFD diminished the relative abundance of Bacteroidetes and increased the relative abundance of Firmicutes and Cyanobacteria. In the brain, HFD modified the metabolome of prefrontal cortex and striatum, changing the relative concentrations of molecules involved in energy metabolism (e.g. lactate) and neuronal signalling (e.g. γ-aminobutyric acid). The expression of NPY in hypothalamus and hippocampus was decreased by HFD, whereas plasma NPY and DPP-4-like activity were increased. The HFD-induced anhedonia remained unaltered by imipramine and sitagliptin.
Discussion: The depression-like behaviour induced by prolonged HFD in mice is associated with distinct alterations of intestinal microbiome, brain metabolome, NPY system, and DPP-4-like activity. Importantly, the HFD-evoked behavioural disturbance remains unaltered by DPP-4 inhibition and antidepressant treatment with imipramine.
Introduction
Unfavourable nutritionCitation1,Citation2 and obesityCitation3 are risk factors for developing depression. Moreover, obesity is a predictor of poor prognosis of depression and an unfavourable response to antidepressants.Citation4 In spite of this epidemiological evidence, the pathophysiological mechanisms that are responsible for the enhanced risk of depression due to low diet quality and obesity remain unclear. Obesogenic diet and obesity affect the composition of the intestinal microbiota in humans and experimental animals.Citation5,Citation6 Several studies have also identified significant differences in the intestinal microbiome of depressed and non-depressed subjects.Citation7,Citation8 It is, however, largely unexplored whether diet-induced alterations in the community structure and function of the intestinal microbiota are associated with the development of depression.
Neuropeptide Y (NPY) is a factor that potentially links diet-induced obesity to mood alterations. On the one hand, NPY is a regulator of appetite and food intake, and an obesogenic diet is known to affect the NPY system in several brain areas.Citation9 On the other hand, NPY is involved in the regulation of emotional-affective behaviour and stress resilience.Citation10 Therefore, altered NPY signalling in response to an obesogenic diet may contribute to the neuropsychiatric disturbances observed in obese subjects. NPY signalling can be altered not only by changes in the activity of Y receptors but also by changes in the expression, release, and degradation of the peptide. For instance, the activity of NPY is under the influence of dipeptidyl peptidase-4 (DPP-4) which truncates NPY(1–36) to NPY(3–36), thus changing its affinity to Y receptor subtypes.Citation11
Apart from their effects on the intestinal microbiome and cerebral NPY system, obesogenic diets have a major impact on metabolic pathways and metabolite levels throughout the body.Citation12 These metabolic imbalances may also transcend to the brain, affecting the production of neurotransmitters and other molecules relevant to neuronal signalling and behaviour and thus contributing to neuropsychiatric disorders observed in obese subjects. High-throughput screening of brain metabolites in an animal model of diet-associated perturbations of behaviour could thus provide important insights into the mechanisms of diet-induced disturbances of brain metabolism and their potential role in neuropsychiatric disorders associated with obesity.
The overall aim of this work was to explore the effect of a high-fat diet (HFD) for 8 weeks on emotional-affective and cognitive behaviour in mice and to investigate select mechanisms that may accompany diet-induced disturbances of brain function. In pursuing this goal, five specific hypotheses were tested: (i) HFD induces a depression-like phenotype in mice. (ii) The depression-like phenotype induced by HFD is associated with distinct alterations in the intestinal microbiome. (iii) HFD changes distinct metabolite concentrations in the brain that provide clues to the molecular basis of diet-induced perturbations of behaviour. (iv) The HFD-induced depression-like behaviour is associated with dysregulated NPY signalling in the brain and altered DPP-4-like activity in the periphery. (v) The HFD-induced depression-like phenotype is reversible by imipramine and the DPP-4 inhibitor sitagliptin.
Methods
Experimental animals
The experiments were carried out with male C57BL/6J mice obtained from Charles River (Sulzfeld, Germany) at the age of 8 weeks. The animals were housed two or three per cage under controlled conditions of temperature (set point 21°C) and air humidity (set point 50%) and under a 12 h light/dark cycle (lights on at 6:00 h, lights off at 18:00 h). Mice were habituated for at least 10 days in the animal facility while being fed a control diet.
Study design
The study was carried out with 156 mice. In all experiments, mice were fed either an HFD (S9003-E710; 60 kJ% from fat, with refined palm oil as a main source, 24 kJ% from carbohydrate, 16 kJ% from protein) or a control diet (control; S5745-E7022; 12 kJ% from fat, 65 kJ% from carbohydrate, 23 kJ% from protein) for 8 weeks. The diets were purchased from Sniff (Soest, Germany) (Supplementary table S1). Tap water and respective chow were provided ad libitum and mice continued to receive the same diet during behavioural tests. Throughout the study, mice were weighed once weekly, and weekly food intake per cage was calculated from the change in food pellet weights. After the 8-week feeding period the animals were allocated to four experimental groups as shown in A.
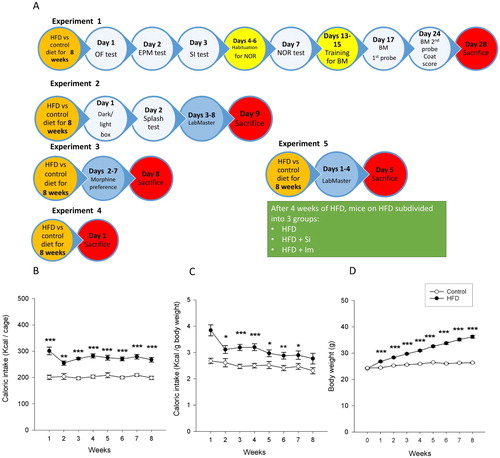
Figure 1 Study design, caloric intake, and body weight of mice fed a control or high-fat diet (HFD). (A) Study design. After 8 weeks on an HFD or control diet, mice underwent a battery of behavioural tests (experiments 1, 2, 3, and 5) or were sacrificed without behavioural testing (experiment 4). In experiment 5, after 4 weeks of HFD, mice were subdivided into three groups: an HFD+Si group which received sitagliptin (50 mg/kg/day in drinking water), an HFD+Im group which received imipramine (7 mg/kg/day in drinking water), and a group which received no medications (HFD group). All three groups continued to be on an HFD for a total of 8 weeks. OF, open field; EPM, elevated plus maze; SI, social interaction; NOR, novel object recognition; BM, Barnes maze. (B) Weekly caloric intake (calculated per cage, n=11 cages per group), (C) weekly caloric intake for each gram of body weight (calculated per cage, n=11 cages per group) and (D) body weight of mice (n=33 per group) recorded weekly during the 8-week feeding period. The data shown in panels B, C, and D were pooled from experiments 1, 2, and 4. Means±standard error of the mean; *P<0.05, **P<0.01, ***P<0.001 (t-test for comparing groups at each time point).
In experiment 1, mice were subjected to a behavioural test battery including the open field (OF) test, elevated plus maze (EPM) test, social interaction (SI) test, novel object recognition (NOR) test, Barnes maze (BM) test, and hair coat index assessment. The order of the tests is described in A. Mice were sacrificed 4 days after the second BM probe trial, and their brains were collected for metabolomic analysis while blood plasma and colonic tissue were collected for the DPP-4 assay.
In experiment 2, mice were first subjected to the dark/light box and splash tests. Then they were single-housed in the LabMaster system (TSE Systems, Bad Homburg, Germany) to record locomotion, fluid intake, food intake, and sucrose preference over a 6-day period starting with the beginning of the light cycle on the second day in the LabMaster system.
In experiment 3, mice were single-housed in the LabMaster system to conduct the morphine preference test.
In experiment 4, mice were sacrificed after the end of the 8-week feeding period without any behavioural intervention. Brain, heart blood, colonic tissue, and caecal contents were collected for assessment of cerebral NPY, Y1 and Y2 receptor mRNA, corticosterone and NPY levels in blood plasma, myeloperoxidase (MPO) concentration in colon, and microbial community in caecal contents, respectively.
In experiment 5, after 4 weeks of HFD, mice on HFD were subdivided into three groups: the first group (HFD group) continued to receive plain drinking water, the second group (HFD+Si group) received sitagliptin (MedChemExpress, Monmouth Junction, NJ, USA) in the drinking water (50 mg/kg body weight) for 4 weeks. The third group (HFD+Im group) received imipramine (Sigma, Vienna, Austria) at a dose of 7 mg/kg body weight for 4 weeks. The concentration of the medications in the drinking water was adjusted as described in Supplementary information. The selected dose of imipramine given for 3 weeks blocks depression-like behaviour induced by chronic stress in mice.Citation13 The effect of the selected doses of sitagliptin and imipramine on plasma DPP-4-like enzyme activity and hair coat index were tested in a separate group of mice which were sacrificed after the end of the 8-week feeding period without any behavioural intervention. In the behavioural experiments, sitagliptin and imipramine were tested for their ability to reverse the HFD-induced behavioural changes in the LabMaster system, because in experiment 2 the HFD-induced alterations of behaviour had proved to be most pronounced in this test paradigm. After 8 weeks of HFD, mice were single-housed in the LabMaster system to record locomotion, fluid intake, food intake, and sucrose preference over a 60-hour period starting from the beginning of the dark cycle on the second day until the end of the dark cycle of the fourth day. This time window was selected as it showed clear differences between the groups in experiment 2.
Behavioural tests
The OF, EPM, and dark/light box tests were used to assess anxiety-like behaviour, while the NOR and BM tests were used to estimate learning and memory. The 3-chamber SI paradigm was used to determine sociability. The hair coat index and splash test were used to assess self-care. The hedonic effects of sucrose and morphine were measured by the sucrose and morphine preference tests. The circadian pattern of locomotion, exploration, drinking, and feeding, as well as sucrose preference and morphine preference were recorded with the LabMaster system which allows continuous monitoring of murine behaviour in a special housing cage. Details of the behavioural tests are described in Supplementary information.
Collection of tissues
Mice were sacrificed by decapitation after they had been deeply anaesthetised with pentobarbital (150 mg/kg IP). Blood was collected by cardiac puncture with EDTA as anticoagulant. After centrifugation at 4100g for 15 min at 4°C, the plasma was frozen immediately on dry ice. A 1-cm segment of the distal colon was opened longitudinally, washed in saline, dried with tissue paper, and then shock-frozen in liquid nitrogen. The caecal contents were collected in sterile tubes and shock-frozen on dry ice. The brains were collected and frozen in 2-methylbutane on dry ice. All the samples were then stored at −70°C until analysis.
Microbiome analysis
As described previously,Citation14 caecal contents were homogenised on a MagNA Lyser Instrument using MagNA Lyser Green Beads (Roche Diagnostics GmbH, Mannheim, Germany) and incubated with 25 mg/ml Lysozyme Chicken Egg White (Calbiochem) for 30 min at 37°C. DNA was extracted using the Maxwell RSC automated DNA extraction system and the Maxwell® RSC Blood DNA Isolation Kit (Promega Corp., Madison, WI, USA) including a proteinase K digestion step according to the manufacturer’s instructions. The DNA concentration was determined, and bacterial 16S rDNA was amplified by PCR with the Rotor-Gene SYBR Green PCR Kit (Qiagen, Hilden, Germany) using 20 ng DNA as a template. To this end, the 16S primers F27 – AGAGTTTGATCCTGGCTCAG – and R357 – CTGCTGCCTYCCGTA – were used as fusion primers containing Ion Torrent sequencing adapters. Afterwards PCR products were gel-purified and the amplicon DNA concentration was determined. Sequencing of pooled amplicons was performed with the Ion PGM Sequencer and an Ion Sequencing 400 Kit (both from Life Technologies, Carlsbad, CA, USA). Contaminating non-bacterial sequences were removed and Acacia error correction was applied on all reads using standard parameters.Citation15 Chimeras were identified by the Usearch algorithm and removed. The resulting bam file was introduced into QIIME (v1.8.0) 16S workflow (www.qiime.org).Citation16
Colonic myeloperoxidase (MPO)
The MPO content of the colon was measured with an EIA kit specific for the rat and mouse protein (Hycult Biotechnology, Uden, The Netherlands). Colonic tissue was homogenised and the assay was run according to the manufacturer’s instructions. Assay values were normalised to protein content of the samples, which was measured with the BCA protein assay kit (Pierce Biotechnology, Rockford, IL, USA).
Brain microdissection
The frozen brains were transferred to a cryostat at −20°C and cut manually into approximately 1 mm thick slices. These slices were placed on a cold plate (Weinkauf Medizintechnik, Forchheim, Germany) set at −18°C, on which prefrontal cortex (Bregma, +3.20 to −0.22), striatum (Bregma, +1.70 to −1.94), hypothalamus (Bregma, +0.26 to −2.92), and hippocampus (Bregma, −0.94 to −4.04) were microdissected with an iris spatula.Citation17 The microdissected brain areas were kept in homogenisation tubes on dry ice and subsequently stored at −70°C until further processing.
Brain metabolomics
Brain regions of the prefrontal cortex, hypothalamus, hippocampus, and striatum were homogenised in 0.8 ml mixture of MeOH/H2O/CHCl3 (3:1:3) for 3 min at T=1/50 in a tissue lyser (TissueLyser LT, Qiagen). Samples were then centrifuged for 10 min at 4°C at 1228g and 450 μL of the supernatant was dried at 45°C for 3 h in a speed-vacuum (Concentrator plus, Eppendorf, Hamburg, Germany). The pellet was resuspended in 100 μL of phosphate buffer (0.2 M, 1 mM sodium 3-(tri-methylsilyl)propionate-2,2,3,3-d4 (TSP) in D2O/H2O 8:2, pH 7.4), and 50 μL was transferred to 1.7 mm NMR capillary tubes for NMR acquisition. 1H NMR spectra were acquired on a Bruker AV700 NMR Spectrometer equipped with a 5 mm 1H(13C/15N) inverse Cryoprobe®. All samples were analysed at 300 K with a standard 1H-1D NOESY (noesypr) and 1H-1D Carr Purcell Meiboom–Gill spin-echo (CPMG) pulse sequence (cpmgpr) with water signal suppression applied during relaxation delay (RD). The cpmgpr experiment helped in the suppression of broad resonances of lipophilic molecules, allowing the detection of small polar metabolites. For each spectrum, 8 dummy transients were followed by a total of 128 scans, with an RD of 5 s and an acquisition time (AQ) of 1.5 s. Scans were accumulated in 64k data points over a spectral width of 9803.9 Hz. The free induction decays were multiplied by an exponential function corresponding to 0.3 Hz line broadening prior Fourier transformation. All spectra were referenced to the singlet peak of TSP at 0.0 ppm, manually phased and automatically baseline corrected applying a Whittaker smoother algorithm in MNova NMR version 10.0.2 (Mestrelab Research, Santiago de Compostela, Spain). Metabolites were assigned using Chenomx Software (Chenomx Inc., Edmonton, Canada), metabolic databases (HMDB, http://www.hmdb.ca; BMRB, http://www.bmrb.wisc.edu), and published literature.
Quantitative polymerase chain reaction (qPCR)
NPY, Y1, and Y2 receptor mRNA was quantified with real-time PCR (qPCR) as described in Supplementary information.
Peptide extraction and neuropeptide Y (NPY) assay
For NPY peptide extraction, microdissected hypothalamic and hippocampal tissues were homogenised in lysis buffer (50 mM Tris-HCl pH 8, 150 mM NaCl, 1% (v/v) Triton X-100, 0.5% (v/v) sodium deoxycholate and 10 mM PMSF) using a Peqlab Precellys 24 homogeniser. The tissue homogenates were centrifuged (10,000 rpm, 4°C, 10 min) to pellet debris, and the protein content of the supernatant was measured with the BCA protein assay kit (Pierce Biotechnology, Rockford, IL, USA). Then, a protein amount of 200 µg from the samples was added to 0.5 ml 2 N acetic acid, and centrifuged for 10 min at 2400 rpm and 4°C. The supernatants were lyophilised and stored at −70°C until assay. To determine NPY in the brain samples, the lyophilisates were reconstituted in assay buffer, while plasma samples were assayed after a 1:4 dilution with assay buffer. The fluorescence immunoassay (Phoenix Pharmaceuticals, Burlingame, CA, USA) was used to measure NPY in both plasma and extracted brain samples. The assay was run according to the manufacturer’s instructions. According to the information provided by the manufacturer, the kit recognises mainly NPY(1–36) and has 14.3% cross-reactivity with NPY(3–36), while there is no cross-reactivity with peptide YY or pancreatic polypeptide. The sensitivity of the assay is 11.9 pg/ml, the intra-assay variability 5–7%, and the inter-assay variability 12–15%.
DPP-4-like activity
DPP-4-like activity was determined by the cleavage of para-nitroanilide (PNA) from the synthetic substrate glycine-proline-PNA (Gly-Pro-PNA; Sigma, St Louis, MO, USA). Briefly, 20–50 mg of colonic tissue was resuspended in Tris base buffer (50 mM, pH 8.3) with 1% (w/v) of n-octyl-glucoside and homogenised with a Tissue Ruptor (Qiagen). The samples were centrifuged (3000g, 20 min, 4°C) and the supernatants were collected and kept on ice for the DPP-4 assay. A volume of 20 µL of the supernatants or blood plasma was incubated with the substrate Gly-Pro-PNA. The enzymatic activity resulting in the release of PNA was measured in a kinetic of 30 min at 37°C with absorbance measurements (380 nm) every minute (SpectraMax M2, Molecular Devices, Sunnyvale, CA, USA). DPP-4-like activity in the tissue and blood plasma samples was quantified relative to a standard curve generated with free PNA (Sigma). Blanks with Tris base buffer and the substrate glycine-proline-PNA were included in the assay. The mean absorbance value of the blanks was subtracted from that of the samples. DPP-4-like activity in plasma was expressed as mU/ml. In the colonic tissue, the values were normalised to the amount of protein quantified by the Bradford method to express the enzymatic activity as mU/mg protein.
Corticosterone
Plasma levels of corticosterone were determined with an enzyme-linked immunosorbent assay (EIA) kit (Assay Designs, Ann Arbor, MI, USA). The assay was run according to the manufacturer’s instructions.
Statistical analysis
Data obtained by behavioural tests, qPCR, and EIA were analysed with SPSS 22 (SPSS Inc., Chicago, IL, USA) and SigmaPlot 13 (Systat Software GmbH, Erkrath, Germany). For analysis, t-test, Mann Whitney U-test, one-way ANOVA followed by post hoc Dunnett’s test or Kruskal–Wallis H test followed by post hoc Dunn’s test were used as appropriate. In Dunnett’s and Dunn’s post hoc tests, HFD was used as a reference group. A P-value<0.05 was considered as statistically significant.
Microbiome analysis results were statistically evaluated with R (R Development Core Team, 2011, v3.2.1, packages stats, missMDA, nlme) using Tibco® Spotfire® (v7.0.0). Principal coordinate analysis (PCoA) was performed centred and scaled to unit variance (R function prcomp). The ADONIS test of weighted UniFrac distances was conducted with the QIIME compare categories script. The linear discriminant analysis (LDA) effect size (LEfSe) method (http://huttenhower.sph.harvard.edu/lefse/) for biomarker discovery was used to identify differences in the composition of the bacterial community and the expected categorised metagenomic data obtained by PICRUSt.Citation18,Citation19 An LDA score of 2 (or −2) was set as threshold. An alpha significance level of 0.05 was used in all statistical tests.
As regards the metabolomics data, multivariate statistical analysis was performed on cpmgpr spectra using Matlab software (The Mathworks, version R2016a) and algorithms were provided by Korrigan Sciences Ltd. Cpmgpr spectra were digitalised and imported into Matlab, where the residual signal of water resonance was manually deleted. All spectra were normalised under the total area and unit variance (UV) scaled. Principal component analysis (PCA) was performed to detect metabolic group variations and possible outliers. Data were further analysed using orthogonal projection to latent structure-discriminant analysis (O-PLS-DA) where 1H NMR spectroscopic profiles were used as matrix of independent variables (X) and diet as response vector (Y). The two values R2Y (goodness of fit: percentage of Y explained by the model) and Q2Y (goodness of prediction: percentage of Y predicted after 7-fold cross validation) were considered to evaluate the validity of O-PLS models. The significance of selected models was further validated by 500 random permutation tests. Loadings plots were colour coded to represent the correlation between the X matrix and the model scores, allowing for easier identification of metabolites associated with class membership.
Results
Mice on HFD gain more weight
HFD-fed mice consumed more calories and gained more weight than mice on the control diet (B–D). The average weekly caloric intake relative to body weight was higher in mice on HFD (mean+SEM=3.1+0.13 kcal/g) than in mice on the control diet (mean+SEM=2.5+0.08 kcal/g) (t20=−4.1; P<0.001). Mice on HFD also gained more weight over the 8-week period (mean+SEM=12.0+0.54 g) compared to mice on the control diet (mean+SEM=2.0+0.24 g) (t44.5=−16.9; P<0.001).
HFD induces a depression-like phenotype
Mice on HFD exhibited a depression-like phenotype as disclosed by the SI test, hair coat index assessment and sucrose preference test (SPT). In the SI test, four mice of the control group and two mice of the HFD group were excluded from analysis as they did not explore the three chambers of the test apparatus within the first two minutes (for details, see Supplementary information). Sociability was reduced by HFD, relative to the control diet, as revealed by a significant decrease of mouse compartment preference (t16=2.6; P=0.018) and mouse near vicinity preference (t16=2.7; P=0.016) (A and B).
Figure 2 Behavioural readouts in mice fed a control or high-fat diet (HFD) for 8 weeks. (A,B) Behaviour of mice in the three-chamber social interaction test (n=8 in the control and n=10 in the HFD group). (C) Hair coat index (n=12 per group). (D,E) Sucrose solution intake and preference over water measured during a 6-day period (n=5 in the control and n=7 in the HFD group). (F,G) Total caloric intake and percent food intake during the light cycle, relative to the total daily food intake, as measured during a 6-day period (n=9 in the control and n=7 in the HFD group). (H,I) Horizontal and vertical locomotion measured during a 6-day period (n=9 per group). (J–L) Morphine solution intake, morphine solution preference over quinine solution, and total intake of saccharin solution (present in both morphine and quinine solutions) as measured during a 6-day period (n=6 in the control and n=7 in the HFD group). The data shown in panels A–C were derived from experiment 1, those in panels D–I from experiment 2, and those in panels J–L from experiment 3. The bars in panels A, B, D–L represent means+standard error of the mean. The box plot in panel C depicts the 25th and 75th percentiles (boxes) and the 10th and 90th percentiles (error bars); *P<0.05, **P<0.01, ***P<0.001 (Mann Whitney U-test in panel C, t-test in all other panels).
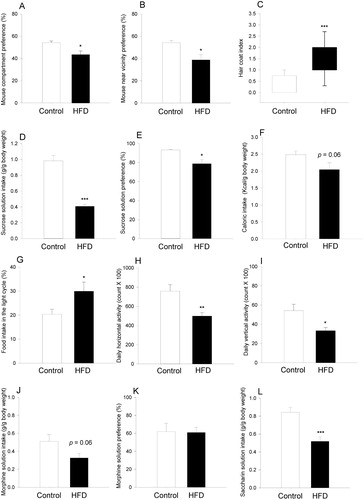
The hair coat index (indicative of diminished self-care) was significantly higher in HFD-fed mice than in mice on the control diet (U=12; P<0.001) (C) although no significant difference between the two groups was seen in the splash test (Supplementary figure S4). HFD-fed mice exhibited anhedonia as disclosed by a reduction of cumulative sucrose intake (t10=6.8; P<0.001) and sucrose preference (t4.1=3.2; P=0.03) (D and E). In contrast to group-housed mice which enhanced their caloric intake when on HFD (B and C), there was a nominal reduction of caloric intake in HFD-fed mice kept single-housed in the LabMaster system, but this reduction was statistically not significant (t14=2.1; P=0.06) (F). Moreover, HFD disrupted the circadian ingestion pattern as shown by an increase of the percent food intake during the light cycle relative to the total daily food intake (t14=−2.4; P=0.034) (G). In addition, HFD reduced both horizontal (t16=3.3; P=0.004) and vertical locomotor activity (t16=2.7; P=0.013) (H and I) in the LabMaster system.
In the morphine preference test, there was a nominal decrease in morphine consumption by HFD-fed mice, but this decrease was statistically not significant (t11=2.1; P=0.064) (J), while morphine preference over quinine did not significantly differ between mice on HFD and those on the control diet (K). On the other hand, the total intake of saccharin solution (combined consumption of morphine and quinine provided in saccharin solution) was significantly blunted in HFD-treated mice (t11=4.4; P<0.001) (L). No significant differences between mice on the HFD or control diet were observed in the tests used to measure anxiety (OF, EPM, and dark/light box tests), learning and memory (NOR and BM tests) (Supplementary figures S1–S3). In the NOR test, mice on the control diet and HFD performed almost identically (t21=0.31, P=0.76). In the BM test, the percent time spent in the target quadrant was nominally shorter in mice on HFD in both probe trials (Supplementary figure S2), but statistically not significant in the first (t22=1.6; P=0.12) and second (t22=1.3; P=0.2) probe trials, respectively.
HFD influences the caecal microbiota composition and predicts alterations in its metabolic function
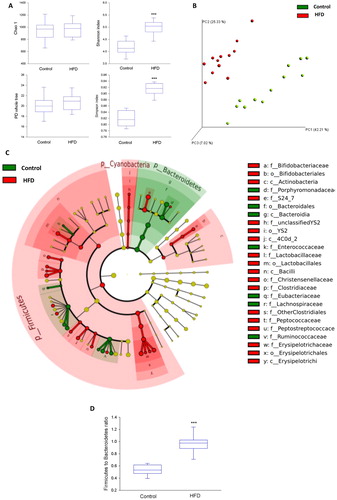
The alpha diversity of the microbiome was significantly increased in mice on HFD as revealed by both Shannon and Simpson indices (A), and PCoA showed that HFD-fed mice harboured a significantly different microbial community compared to control mice (P=0.001 by the ADONIS test) (B). The effect of HFD on the microbial community remained statistically significant when just one mouse from each cage was included in the analysis (n=4 per group; P=0.023 by the ADONIS test). LEfSe analysis revealed significant differences at different taxonomic levels between the two treatment groups. At the phylum level, Bacteroidetes were relatively more abundant in the control group, while Firmicutes and Cyanobacteria were relatively more abundant in the HFD group (C). These changes were reflected in the Firmicutes to Bacteroidetes ratio which was significantly higher in the HFD group (U=0; P<0.001) (D). Additionally, changes between the two treatment groups were observed at class, order, family, and genus levels (C, Supplementary figure S5). To obtain some insight into the potential impact of these changes on the functional capacity of the microbiome, we ran an LefSe analysis on the expected metagenome that was generated by the PICRUSt tool. The results identified several metabolic entities that may be affected, including tryptophan, sphingolipid, aspartate, and glutamate pathways (Supplementary figure S6).
Figure 3 Microbial community profile based on 16S rDNA sequencing of caecal contents of mice fed a control or high-fat diet (HFD) for 8 weeks (n=12 per group). (A) Microbial diversity and richness indices. (B) Principal coordinate analysis (PCoA) plot based on weighted UniFrac distance between samples. (C) Taxonomic cladogram obtained from the linear discriminant analysis (LDA) effect size (LEfSe) analysis representing statistically significant differences in the abundance of microbial taxa between mice on the HFD and control diet. Taxa which are relatively more abundant in control mice are shown in green colour while those which are more abundant in mice on HFD are shown in red colour. To the right side of the cladogram, statistically significant differences down to the family level are marked by the taxonomic level: phylum (p), class (c), order (o), and family (f). Only statistically significant changes (P<0.05) with an LDA score above 2 are presented. (D) Effect of diet on the Firmicutes to Bacteroidetes ratio. The data shown were derived from experiment 4. The box plots in panels A and D depict the 25th and 75th percentiles (boxes) and the 10th and 90th percentiles (error bars), the transverse line indicating the median; ***P<0.001 (Mann Whitney U-test).
HFD reduces colonic MPO
The colonic MPO content was significantly lower in mice on HFD compared to mice on the control diet (t14.2=2.4; P=0.028) (Supplementary figure S7).
HFD modulates metabolite production in prefrontal cortex and striatum
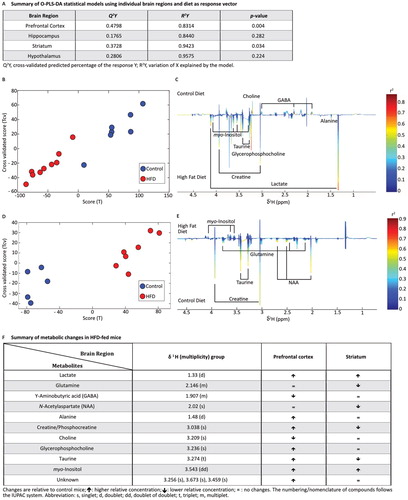
PCA analysis-based O-PLS-DA models of four brain regions (prefrontal cortex, hypothalamus, hippocampus, and striatum) were obtained by regressing the metabolome of each region individually against diet. The summary of the statistical models is shown in A. Since the validation test on the O-PLS-DA model for the hippocampus and hypothalamus gave a P-value>0.05, these regions were excluded from further analysis. In the prefrontal cortex (B and C), HFD was strongly correlated with enhanced relative concentrations of lactate and glycerophosphocholine. A similar but weaker correlation between HFD and a rise of alanine, creatine/phosphocreatine, taurine, myo-inositol, and three unknown singlets at 3.256, 3.673, and 3.459 ppm were also observed in the prefrontal cortex. In contrast, the relative concentrations of γ-aminobutyric acid (GABA) and choline in this brain region were negatively correlated with HFD (B and C). In the striatum (D and E), HFD was associated with low relative concentrations of N-acetylaspartate, glutamine, creatine/phosphocreatine, and taurine, and high relative concentrations of myo-inositol. The metabolic variations of the prefrontal cortex and the striatum as identified by the O-PLS-DA model are summarised in F.
Figure 4 Effect of high-fat diet (HFD) on brain metabolome determined by 1H NMR. (A) Summary of O-PLS-DA models using individual brain regions and diet as response vector. (B,D) Score plots using HFD (red) and control diet (blue) as vector response in the prefrontal cortex (B) and striatum (D). The calculated scores (x-axis) are plotted against the cross-validated scores (y-axis). (C,E) Loading plots derived from the corresponding O-PLS-DA models showing the metabolic changes and correlations with HFD and control diet in the prefrontal cortex (C) and striatum (E). In the prefrontal cortex (C), the metabolic changes are downwards correlated to HFD and upwards to the control diet, while in the striatum (E) the metabolic changes are upwards correlated to HFD and downwards to the control diet. (F) Summary of metabolic changes in HFD-fed mice in the prefrontal cortex and striatum. The data shown were derived from experiment 1. Changes are relative to control mice: ↑ higher relative concentration; ↓ lower relative concentration; = no changes. The numbering/nomenclature of compounds follows the IUPAC system. Abbreviations: GABA, γ-aminobutyric acid; NAA, N-acetylaspartate; s, singlet; d, doublet; dd, doublet of doublets; t, triplet; m, multiplet.
HFD reduces NPY expression in the hypothalamus and hippocampus
HFD attenuated the relative NPY mRNA expression in the hippocampus (t10=3.7; P=0.004) and hypothalamus (t10=3.7; P=0.004) (A and B) but not in the striatum and prefrontal cortex (Supplementary figure S8). In contrast, the expression of Y1 and Y2 receptor mRNA remained unchanged by HFD in all brain areas examined (Supplementary figures S9 and S10). Analysis of the NPY system at the peptide level in a different set of mice with EIA showed that the hypothalamic NPY concentration was significantly reduced in HFD-fed mice relative to mice on the control diet (t10=2.9; P=0.016) (E). Likewise, the hippocampal NPY level was nominally lower in mice on HFD but this difference was statistically not significant (D).
Figure 5 Molecular readouts in brain and plasma of mice fed a control or high-fat diet (HFD) for 8 weeks. (A) Relative expression of neuropeptide Y (NPY) mRNA in hippocampus (n=6 per group). (B) Relative expression of NPY mRNA (n=6 per group) in hypothalamus. (C) Plasma concentration of NPY in control (n=7) and HFD group (n=8). (D) Hippocampal concentration of NPY (n=6 per group). (E) Hypothalamic concentration of NPY (n=6 per group). (F) Dipeptidyl peptidase-4 (DPP-4)-like activity in blood plasma (n=12 per group). The measurements in panels A–E were taken after 8 weeks of dietary intervention without behavioural testing (experiment 4) while those in panel F were taken after 8 weeks of dietary intervention followed by behavioural testing (experiment 1). Means+standard error of the mean; *P<0.05, **P<0.01, ***P<0.001 (t-test).
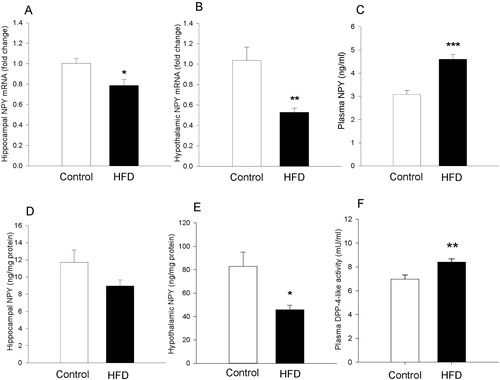
HFD increases plasma NPY and DPP-4-like enzyme activity
Relative to the control diet, HFD increased the plasma level of both NPY (t13=−5.3; P<0.001) and DPP-4-like activity (t22=−3.2; P=0.004) (C and F). In contrast, DPP-4-like activity in the colonic tissue did not differ between HFD-fed and control animals (Supplementary figure S11). The plasma concentration of corticosterone remained also unaltered in mice on HFD, independently of whether they were housed in groups or singly in the LabMaster system (Supplementary figure S12).
Sitagliptin reverses the HFD-induced rise of plasma DPP-4-like enzyme activity
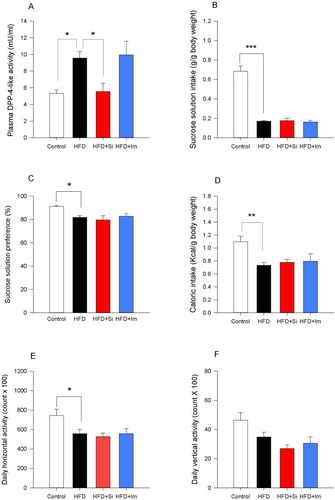
Plasma DPP-4-like enzyme activity differed significantly between mice on the control diet, mice on HFD and HFD-fed mice treated with sitagliptin or imipramine as revealed by one-way ANOVA (F(3,22)=5.0; P=0.008). Dunnett’s post hoc test disclosed that the HFD-evoked rise of plasma DPP-4-like enzyme activity was reversed by sitagliptin but remained unaltered by imipramine (A). The hair coat index which was evaluated in these mice differed also significantly between the treatment groups (H3=17.7; P<0.001). Dunn’s post hoc test revealed a significantly higher hair coat index in mice on HFD compared to those on the control diet, while no significant change was seen in mice treated with sitagliptin or imipramine (Supplementary figure S13).
Figure 6 Dipeptidyl peptidase-4 (DPP-4)-like enzyme activity (A) and behavioural readouts (B–F) in mice fed for 8 weeks a control or high-fat diet (HFD) and in HFD-fed mice treated with sitagliptin (Si; 50 mg/kg/day in drinking water) or imipramine (Im; 7 mg/kg/day in drinking water) for 4 weeks. (A) DPP-4-like activity in blood plasma of mice sacrificed after diet and drug interventions without behavioural testing. (B,C) Sucrose solution intake and preference (n=7–9 per group), (D) caloric intake, and (E,F) horizontal and vertical locomotor activity (n=9–10 per group) recorded over a 60-hour period in the LabMaster system after diet and drug interventions. The bars represent means+standard error of the mean. The data shown in panels B–F were derived from experiment 5 while those in panel A were derived from a separate group of mice which received the same drug treatment as the mice in experiment 5 but were not subjected to testing in the LabMaster system. *P<0.05, **P<0.01, ***P<0.001 (one-way ANOVA followed by Dunnett’s post hoc test using HFD as a reference group).
Sitagliptin and imipramine fail to change HFD-induced behavioural disturbances
When the behaviour of mice on the control diet, mice on HFD and HFD-fed mice treated with sitagliptin or imipramine was compared with each other, one-way ANOVA revealed significant differences in sucrose intake (F(3,30)=51.9; P<0.001), sucrose preference (F(3,30)=4.1; P=0.015), caloric intake (F(3,35)=4.3; P=0.010), and horizontal activity (F(3,35)=3.8; P=0.019) (B–E). Dunnett’s post hoc test revealed that the HFD-induced decrease in sucrose intake, sucrose preference, caloric intake, and horizontal activity remained unchanged by sitagliptin and imipramine (B–E). A similar pattern was seen with vertical activity, with significant differences between the groups revealed by one-way ANOVA (F(3,35)=4.1; P=0.014) but not with Dunnett’s post hoc test (F).
Discussion
Summary of main findings
The current results show that a palm oil-based HFD induced a particular depression-like phenotype as deduced from a decrease in sociability and anhedonia, reduced activity, and a disturbed circadian ingestion pattern. The behavioural changes were accompanied not only by disturbances of the intestinal microbiota composition and its predicted metabolic function but also by distinct alterations of brain metabolite levels, peripheral and cerebral NPY expression, and plasma DPP-4-like activity. Importantly, the HFD-induced anhedonia and reduced locomotion were resistant to treatment with either imipramine or sitagliptin.
HFD-induced behavioural disturbances
Depression is a complex disorder with a wide range of symptoms, some of which such as social withdrawal, anhedonia, reduced self-care, rapid fatigability, and cognitive impairment can be modelled in rodents.Citation20 Using a multidimensional approach, we found that mice on HFD showed a depression-related phenotype, a conclusion based on the results of SI test, hair coat assessment, SPT, and circadian activity and ingestion monitoring. A relationship between HFD and depression-like behaviour in mice and rats has previously been found, although with inconsistent results. On the one hand, feeding of single-housed mice with an HFD (45% of calories from fat) has been reported to protect against the depressogenic impact of social stress.Citation21 On the other hand, feeding with an HFD (60% of calories from fat) for 10 weeks or longer has been reported to induce depression-like behaviours.Citation6,Citation22–24
Our findings are consistent with the latter observation and attest to the reproducibility of HFD-induced depression-like behaviour which appears to be unrelated to the type of fat ingested, given that an HFD based on lard,Citation6,Citation23–25 coconut oil,Citation22 or palm oil (this study) yields similar results. Unlike previous studies which addressed particular aspects of depression-like behaviour such as despair behaviour,Citation22 anhedoniaCitation26 and circadian rhythm disruption,Citation27 our work using a battery of tests revealed a particular pattern of depression-like behaviour: social withdrawal (SI test), anhedonia (SPT), fatigue (reduced locomotion in the LabMaster system), and a disturbance of the circadian ingestion pattern (measured by the LabMaster system). Continuous evaluation of diurnal activity, ingestive behaviour, and sucrose preference are among the advantages of the LabMaster system, while single housing of the experimental animals in the test system is a potential limitation, given that single housing can influence several aspects of behaviour including food intake and sleeping pattern.Citation28,Citation29 However, the sucrose preference of male mice has been reported to remain unaffected after 7, 14, and 21 days of single housing.Citation30 Although we cannot rule out that single housing modified the effect of HFD on behaviour, there is other evidence that HFD per se is able to induce anhedonia as evaluated in diverse test paradigms. Using the progressive ratio operant task, for example, Sharma et al.Citation26 observed anhedonia towards sucrose in mice maintained on HFD for 6 weeks. Employing the female urine sniff test in parallel with the SPT, Dutheil et al.Citation24 likewise reported consistent anhedonia to be manifest in rats maintained on HFD for 16 weeks.
In our study, anhedonia was evident not only from the reduced sucrose intake and preference but also from the reduced saccharin intake, which indicates that anhedonia towards sweet solutions was independent of their caloric content. The latter observation is in keeping with reports that HFD, while having a hedonic effect in the short term, causes neuronal adaptations in the brain reward circuity in the long term and in this way gives rise to anhedonia.Citation22,Citation26 Anhedonia is a core symptom of depression, which is commonly used as a surrogate index of depression-like behaviour in rodents because it can easily be recorded without stressing the animals.Citation31
Although the HFD-induced increase in the hair coat index would also be consistent with a depression-like phenotype, this finding seen after 7 weeks+6 days in experiment 5 and after 11 weeks+3 days in experiment 1 may also reflect a direct effect of HFD on coat appearance, given that we did not observe any significant change in splash test behaviour after 8 weeks in experiment 2.
Unlike depression-like behaviour, anxiety-related behaviour examined with the OF, EPM, and dark/light box tests as well as learning and memory examined with the NOR and BM tests were not altered by HFD within the limited sample size of this study. It is worth noting that anxiety-like behaviour and/or cognitive impairment may become manifest only during particular time windows of prolonged HFD ingestion. Thus, anxiety-like behaviour in the elevated zero maze and OF and cognitive impairment in NOR were observed after a 3-week, but not 6-week, period of HFD intake.Citation32 Besides the time window of behavioural testing, the type and concentration of dietary fat seems to be crucial for the manifestation of cognitive impairment. For example, middle-aged and old mice did not develop cognitive impairment in response to chronic intake of 41% HFD (butter fat) but exhibited cognitive deficits following intake of 60% HFD (lard fat) for 16 weeks.Citation33,Citation34 We therefore hypothesise that, in addition to the type of fat (palm oil), the comparatively shorter treatment (8 weeks) of younger mice in our study may explain why HFD failed to significantly impair cognitive performance.
HFD-induced changes in gut microbiota
Given that the microbial community structure in the intestine is altered by obesogenic diet, obesityCitation5,Citation6 as well as depression,Citation7,Citation8,Citation35,Citation36 we addressed the caecal microbiota as a possible interface in the depressogenic effect of HFD. Importantly, the caecal microbiota of HFD-treated mice shared several features with those found in the stools of patients with depression. For example, HFD reduced the relative abundance of the phylum Bacteroidetes, which was also observed in the faecal microbiota of depressed subjects.Citation7 Likewise, the Firmicutes to Bacteroidetes ratio, which correlates with depression symptoms in humans,Citation37 was increased in response to HFD as has been found in obese mice and humans.Citation5 In addition, some commonalities exist at lower taxonomic levels, as the family LachnospiraceaeCitation35 and the genus RuminococcusCitation36 are underrepresented both in depressed patients and in HFD-fed mice. It is also worth noting that the overall diversity of the microbiota was increased in response to HFD. The effect of HFD on diversity of the microbiota is not consistent in the literature, and both reduced and increased microbial diversity have been reported in HFD-fed rodents.Citation6,Citation38
If the intestinal microbiota contributes to diet-induced alterations of brain function and behaviour, it is expected that this interface is carried by microbial metabolites. Estimation of the metabolic consequences of HFD-induced alterations in the intestinal microbial community structure by PICRUSt combined with LEfSe analysis predicts changes in several molecular entities that may play a role in the pathophysiology of depression, such as tryptophan,Citation8 glutamate,Citation39 and sphingolipidCitation40 metabolic pathways. An involvement of a disturbed intestinal microbiota in the aetiology of depression is supported by the findings that microbiota transplantation from depressed patients or HFD-treated mice is able to induce a depression-like phenotype in the recipient germ-free mice or antibiotic-treated mice and rats.Citation6–8
In conceptualising possible links between diet, gut microbiota, and depressive disorder, it is thought that a dysfunctional intestinal barrier and a dysregulation of the intestinal immune system play a roleCitation41 given that commensal microbes shape intestinal immune responses in health and disease.Citation42 While a lard-based HFD has been shown to enhance colonic MPO enzyme activity which is primarily expressed by neutrophils, monocytes, and macrophages,Citation43 palm oil-based HFD used in our study reduced the colonic content of MPO. We explain this apparently contradictory finding by the notion that the metabolic and inflammatory responses to HFD depend on the type of dietary fat and not just its caloric content.Citation44
HFD-induced changes in molecules relevant to brain function
In order to obtain further clues to the molecular basis of diet-induced perturbations of behaviour, an NMR-based metabolomics approach was used to uncover metabolic effects of HFD in four brain regions of the mouse. HFD had a particular impact on the metabolic fingerprints of prefrontal cortex and striatum in which it affected molecules involved in energy metabolism, such as creatine/phosphocreatine and lactate.Citation45 Apart from a shift in these metabolic entities, HFD had a distinct effect on a number of molecules relevant to neuronal signalling, such as GABA, glutamine (a substrate for the generation of both glutamate and GABA), N-acetylaspartate, choline, taurine, and myo-inositol.
Several metabolic changes induced by HFD in the mouse brain have been reported to occur in humans suffering from depression and/or in particular animal models of depression. For example, lactate levels in the cerebrospinal fluid are increased in several psychiatric disorders including major depression.Citation46,Citation47 GABA has previously been found to be reduced in the prefrontal cortex of rats on HFD.Citation48 Attenuated GABAergic signalling is considered to contribute to the pathophysiology of major depression,Citation49 as there is a depletion of GABA in the prefrontal cortex of depressed patientsCitation50 as well as of rats with depression-like behaviour induced by chronic mild stress.Citation51 Additionally, N-acetylaspartate, a marker of neuronal integrity that increases in depressed patients in response to antidepressant treatment,Citation52 was reduced in the striatum of mice with HFD-evoked depression-like behaviour. In contrast, myo-inositol, which is depleted in the prefrontal cortex of depressed patients,Citation53 was enhanced in the prefrontal cortex and striatum of mice on HFD. Although these discrepancies cannot be explained at present, metabolomic analysis of the brain combined with metabolomic analysis of the gut microbiota and the circulatory interface between gut and brain is likely to become a powerful tool to analyse gut microbiota–brain communication in health and disease.
Since NPY is a key regulator of food intake and emotional-affective behaviour,Citation10 we hypothesised that NPY signalling could be dysregulated by HFD and consequently affect emotional-affective behaviour. This was in fact the case as HFD attenuated hypothalamic NPY expression at both mRNA and peptide level, whereas in the hippocampus the diminution of NPY expression was significant at the mRNA level only. In contrast, the plasma concentration of NPY, which is able to cross the blood–brain barrier,Citation54 was elevated in mice on HFD. Our findings of reduced hypothalamic but increased circulating NPY in response to HFD is consistent with other reports in miceCitation55 and with enhanced plasma NPY levels in obese women.Citation56 In rats, the HFD-induced downregulation of hypothalamic NPY is associated with hypersensitivity to exogenous NPY, which suggests that HFD in conjunction with its effect on NPY transcription may regulate the expression and/or function of Y receptors.Citation57,Citation58 For this reason, expression of Y1 and Y2 receptor mRNA was evaluated but found unchanged. This lack of effect does not exclude the possibility that HFD impacts on Y receptor regulation at the protein level and that HFD might alter Y receptor expression only in particular subregions of the hypothalamus.
HFD enhanced DPP-4-like activity in the blood plasma as found after 8 weeks of HFD in experiment 5 and 12 weeks of HFD in experiment 1. By degrading NPY(1–36) to NPY(3–36), DPP-4 enhances the affinity of NPY towards Y2 and Y5 receptors but reduces its activity at Y1 receptors which are known to be responsible for the antidepressant effect of NPY.Citation11,Citation59 Thus, we hypothesised that elevated plasma DPP-4-like activity may contribute to the HFD-evoked depression-like phenotype, and therefore DPP-4 inhibition may attenuate the depression-like phenotype induced by HFD, given that knockout of DPP-4 reduces depression-like behaviour in mice.Citation60 Our hypothesis was tested with the LabMaster system in which the HFD-induced behavioural changes indicative of a depression-like phenotype had proved to be most pronounced. The pertinent findings, however, rejected this hypothesis, since sitagliptin did not affect the HFD-evoked anhedonia and attenuation of locomotion. In spite of the failure of sitagliptin to reverse the depression-like phenotype, the contribution of DPP-4 in depression-like behaviour cannot be totally ruled out, since sitagliptin successfully counteracts the depression-like behaviour induced by HFD in rats.Citation25 In addition, sitagliptin exerts antidepressant effects in experimental paradigms of depression-like behaviour such as the forced swim test and tail suspension test in mice.Citation61 The absence of such an antidepressant effect in our study reinforces the contention that HFD induces depression-like behaviour through distinct pathophysiological mechanisms.
The anhedonia and hypolocomotion induced by HFD were not only resistant to sitagliptin but also to the tricyclic antidepressant imipramine. This lack of effect of imipramine is consistent with previous reports that escitalopram fails to have an antidepressant effect in mice fed with HFD and that both fluoxetine and desipramine are unable to produce an antidepressant effect in db/db obese mice.Citation23,Citation62 These findings are in line with the poor response of obese patients to antidepressants.Citation4 The HFD-induced depression-like phenotype in mice could therefore be a candidate model for studying antidepressant resistance in obese subjects.
Conclusions
In conclusion, HFD induces a particular pattern of depression-like behaviour in mice. Although a causal relationship between the diet-induced disturbance of the gut microbiota and the depression-like phenotype awaits to be explored, the association of distinct changes in gut microbial community, NPY system, brain metabolome, and behavioural perturbations provides important clues to the potential signalling pathways between HFD and neurobehavioural pathologies.
Disclaimer statements
Contributors AMH and PH designed the experiments. AMH performed the HFD model, behavioural tests, brain microdissection, and PCR and analysed the pertinent data including those obtained with EIA. KK and AM ran the microbiome analysis, while GM and SPC conducted the metabolomics analysis. MO, AMN, and NMD performed the DPP-4 assay and analysed the data. EEF, RM, and FR extracted tissues for analysis. FR validated the primers used in the study. AMH and PH wrote the manuscript, and all authors revised the manuscript.
Funding This work was supported by EU grant 613979 (MyNewGut, www.mynewgut.eu) and the Austrian Science Fund (FWF grants P25912-B23 and W1241-B18). MO is a beneficiary of a ‘MOVE-IN Louvain’ Incoming Post-doctoral Fellowship co-funded by the Marie Curie Actions of the European Commission.
Conflicts of interest None.
Ethics approval All experiments were approved by an ethical committee at the Federal Ministry of Science, Research and Economy of the Republic of Austria (permit BMWFW-66.010/0131-WF/II/3b/2014 issued on 4 September 2014, and permit BMWFW-66.010/0050-WF/V/3b/2017 issued on 18 April 2017).
YNNS1465713_supplement_material.docx
Download MS Word (900.8 KB)Acknowledgments
The authors thank Margit Eichholzer for running the EIA and extracting mRNA and Martina Hatz and Theresa Maierhofer for their help with the PCR.
ORCID
Giulia Mancano http://orcid.org/0000-0003-0484-4836
Esther E. Fröhlich http://orcid.org/0000-0001-6985-0642
Florian Reichmann http://orcid.org/0000-0002-5833-3698
Marta Olivares http://orcid.org/0000-0002-7966-2781
Nathalie M. Delzenne http://orcid.org/0000-0003-2115-6082
Sandrine P. Claus http://orcid.org/0000-0002-3789-9780
Peter Holzer http://orcid.org/0000-0002-5754-395X
Related Research Data
References
- Sanchez-Villegas A, Toledo E, de Irala J, Ruiz-Canela M, Pla-Vidal J, Martinez-Gonzalez MA. Fast-food and commercial baked goods consumption and the risk of depression. Public Health Nutr 2012;15(3):424–32.
- Jacka FN, Mykletun A, Berk M, Bjelland I, Tell GS. The association between habitual diet quality and the common mental disorders in community-dwelling adults: the Hordaland Health study. Psychosom Med 2011;73(6):483–90.
- Luppino FS, de Wit LM, Bouvy PF, Stijnen T, Cuijpers P, Penninx BW, et al. Overweight, obesity, and depression: a systematic review and meta-analysis of longitudinal studies. Arch Gen Psychiatry 2010;67(3):220–29.
- Kloiber S, Ising M, Reppermund S, Horstmann S, Dose T, Majer M, et al. Overweight and obesity affect treatment response in major depression. Biol Psychiatry 2007;62(4):321–26.
- Million M, Lagier JC, Yahav D, Paul M. Gut bacterial microbiota and obesity. Clin Microbiol Infect 2013;19(4):305–13.
- Bruce-Keller AJ, Salbaum JM, Luo M, Blanchard E, Taylor CM, Welsh DA, et al. Obese-type gut microbiota induce neurobehavioral changes in the absence of obesity. Biol Psychiatry 2015;77(7):607–15.
- Zheng P, Zeng B, Zhou C, Liu M, Fang Z, Xu X, et al. Gut microbiome remodeling induces depressive-like behaviors through a pathway mediated by the host’s metabolism. Mol Psychiatry 2016;21(6):786–96.
- Kelly JR, Borre Y, O’Brien C, Patterson E, El Aidy S, Deane J, et al. Transferring the blues: depression-associated gut microbiota induces neurobehavioural changes in the rat. J Psychiatr Res 2016;82:109–18.
- Gumbs MC, van den Heuvel JK, la Fleur SE. The effect of obesogenic diets on brain neuropeptide Y. Physiol Behav 2016;162:161–73.
- Enman NM, Sabban EL, McGonigle P, Van Bockstaele EJ. Targeting the neuropeptide Y system in stress-related psychiatric disorders. Neurobiol Stress 2015;1:33–43.
- Mentlein R. Dipeptidyl-peptidase IV (CD26) – role in the inactivation of regulatory peptides. Regul Pept 1999;85(1):9–24.
- Du F, Virtue A, Wang H, Yang XF. Metabolomic analyses for atherosclerosis, diabetes, and obesity. Biomark Res 2013;1(1):17-7771-1-17.
- Cline BH, Anthony DC, Lysko A, Dolgov O, Anokhin K, Schroeter C, et al. Lasting downregulation of the lipid peroxidation enzymes in the prefrontal cortex of mice susceptible to stress-induced anhedonia. Behav Brain Res 2015;276:118–29.
- Frohlich EE, Farzi A, Mayerhofer R, Reichmann F, Jacan A, Wagner B, et al. Cognitive impairment by antibiotic-induced gut dysbiosis: analysis of gut microbiota-brain communication. Brain Behav Immun 2016;56:140–55.
- Bragg L, Stone G, Imelfort M, Hugenholtz P, Tyson GW. Fast, accurate error-correction of amplicon pyrosequences using Acacia. Nat Methods 2012;9(5):425–26.
- Caporaso JG, Kuczynski J, Stombaugh J, Bittinger K, Bushman FD, Costello EK, et al. Qiime allows analysis of high-throughput community sequencing data. Nat Methods 2010;7(5):335–36.
- Reichmann F, Hassan AM, Farzi A, Jain P, Schuligoi R, Holzer P. Dextran sulfate sodium-induced colitis alters stress-associated behaviour and neuropeptide gene expression in the amygdala-hippocampus network of mice. Sci Rep 2015;5:9970.
- Segata N, Izard J, Waldron L, Gevers D, Miropolsky L, Garrett WS, et al. Metagenomic biomarker discovery and explanation. Genome Biol 2011;12(6):R60-2011-12-6-r60.
- Langille MG, Zaneveld J, Caporaso JG, McDonald D, Knights D, Reyes JA, et al. Predictive functional profiling of microbial communities using 16S rRNA marker gene sequences. Nat Biotechnol 2013;31(9):814–21.
- Cryan JF, Mombereau C. In search of a depressed mouse: utility of models for studying depression-related behavior in genetically modified mice. Mol Psychiatry 2004;9(4):326–57.
- Finger BC, Dinan TG, Cryan JF. High-fat diet selectively protects against the effects of chronic social stress in the mouse. Neuroscience 2011;192:351–60.
- Sharma S, Fulton S. Diet-induced obesity promotes depressive-like behaviour that is associated with neural adaptations in brain reward circuitry. Int J Obes (Lond) 2013;37(3):382–89.
- Zemdegs J, Quesseveur G, Jarriault D, Penicaud L, Fioramonti X, Guiard BP. High-fat diet-induced metabolic disorders impairs 5-HT function and anxiety-like behavior in mice. Br J Pharmacol 2016;173(13):2095–3110.
- Dutheil S, Ota KT, Wohleb ES, Rasmussen K, Duman RS. High-fat diet induced anxiety and anhedonia: impact on brain homeostasis and inflammation. Neuropsychopharmacology 2016;41(7):1874–87.
- Magdy YM, El-Kharashi OA, Nabih ES, Shaker SM, Abd-Elaziz LF, Aboul-Fotouh S. Potential involvement of JNK1 repression in the hepatic effect of sitagliptin and metformin in rats subjected to high fat diet and chronic mild distress. Biomed Pharmacother 2017;85:225–38.
- Sharma S, Fernandes MF, Fulton S. Adaptations in brain reward circuitry underlie palatable food cravings and anxiety induced by high-fat diet withdrawal. Int J Obes (Lond) 2013;37(9):1183–91.
- Kohsaka A, Laposky AD, Ramsey KM, Estrada C, Joshu C, Kobayashi Y, et al. High-fat diet disrupts behavioral and molecular circadian rhythms in mice. Cell Metab 2007;6(5):414–21.
- Bartolomucci A, Cabassi A, Govoni P, Ceresini G, Cero C, Berra D, et al. Metabolic consequences and vulnerability to diet-induced obesity in male mice under chronic social stress. PLoS One 2009;4(1):e4331.
- Kappel S, Hawkins P, Mendl MT. To group or not to group? Good practice for housing male laboratory mice. Animals (Basel) 2017;7(12). DOI: 10.3390/ani7120088.
- Berry A, Bellisario V, Capoccia S, Tirassa P, Calza A, Alleva E, et al. Social deprivation stress is a triggering factor for the emergence of anxiety- and depression-like behaviours and leads to reduced brain BDNF levels in C57BL/6J mice. Psychoneuroendocrinology 2012;37(6):762–72.
- Willner P. Chronic mild stress (CMS) revisited: consistency and behavioural-neurobiological concordance in the effects of CMS. Neuropsychobiology 2005;52(2): 90–110.
- Gainey SJ, Kwakwa KA, Bray JK, Pillote MM, Tir VL, Towers AE, et al. Short-term high-fat diet (HFD) induced anxiety-like behaviors and cognitive impairment are improved with treatment by glyburide. Front Behav Neurosci 2016;10:156.
- Pistell PJ, Morrison CD, Gupta S, Knight AG, Keller JN, Ingram DK, et al. Cognitive impairment following high fat diet consumption is associated with brain inflammation. J Neuroimmunol 2010;219(1–2):25–32.
- Porter DW, Kerr BD, Flatt PR, Holscher C, Gault VA. Four weeks administration of Liraglutide improves memory and learning as well as glycaemic control in mice with high fat dietary-induced obesity and insulin resistance. Diabetes Obes Metab 2010;12(10):891–99.
- Naseribafrouei A, Hestad K, Avershina E, Sekelja M, Linlokken A, Wilson R, et al. Correlation between the human fecal microbiota and depression. Neurogastroenterol Motil 2014;26(8):1155–62.
- Jiang H, Ling Z, Zhang Y, Mao H, Ma Z, Yin Y, et al. Altered fecal microbiota composition in patients with major depressive disorder. Brain Behav Immun 2015;48:186–94.
- Jeffery IB, O’Toole PW, Ohman L, Claesson MJ, Deane J, Quigley EM, et al. An irritable bowel syndrome subtype defined by species-specific alterations in faecal microbiota. Gut 2012;61(7):997–1006.
- Lecomte V, Kaakoush NO, Maloney CA, Raipuria M, Huinao KD, Mitchell HM, et al. Changes in gut microbiota in rats fed a high fat diet correlate with obesity-associated metabolic parameters. PLoS One 2015;10(5):e0126931.
- Mitani H, Shirayama Y, Yamada T, Maeda K, Ashby Jr CR, Kawahara R. Correlation between plasma levels of glutamate, alanine and serine with severity of depression. Prog Neuropsychopharmacol Biol Psychiatry 2006;30(6):1155–58.
- Jernigan PL, Hoehn RS, Grassme H, Edwards MJ, Muller CP, Kornhuber J, et al. Sphingolipids in major depression. Neurosignals 2015;23(1):49–58.
- Slyepchenko A, Maes M, Jacka FN, Kohler CA, Barichello T, McIntyre RS, et al. Gut microbiota, bacterial translocation, and interactions with diet: pathophysiological links between major depressive disorder and non-communicable medical comorbidities. Psychother Psychosom 2017;86(1):31–46.
- Round JL, Mazmanian SK. The gut microbiota shapes intestinal immune responses during health and disease. Nat Rev Immunol 2009;9(5):313–23.
- Kim KA, Gu W, Lee IA, Joh EH, Kim DH. High fat diet-induced gut microbiota exacerbates inflammation and obesity in mice via the TLR4 signaling pathway. PLoS One 2012;7(10):e47713.
- Catta-Preta M, Martins MA, Cunha Brunini TM, Mendes-Ribeiro AC, Mandarim-de-Lacerda CA, Aguila MB. Modulation of cytokines, resistin, and distribution of adipose tissue in C57BL/6 mice by different high-fat diets. Nutrition 2012;28(2):212–19.
- Rae CD. A guide to the metabolic pathways and function of metabolites observed in human brain 1H magnetic resonance spectra. Neurochem Res 2014;39(1):1–36.
- Shungu DC, Weiduschat N, Murrough JW, Mao X, Pillemer S, Dyke JP, et al. Increased ventricular lactate in chronic fatigue syndrome. III. Relationships to cortical glutathione and clinical symptoms implicate oxidative stress in disorder pathophysiology. NMR Biomed 2012;25(9):1073–87.
- Bradley KA, Mao X, Case JA, Kang G, Shungu DC, Gabbay V. Increased ventricular cerebrospinal fluid lactate in depressed adolescents. Eur Psychiatry 2016;32:1–8.
- Sandoval-Salazar C, Ramirez-Emiliano J, Trejo-Bahena A, Oviedo-Solis CI, Solis-Ortiz MS. A high-fat diet decreases GABA concentration in the frontal cortex and hippocampus of rats. Biol Res 2016;49:15-016-0075-6.
- Luscher B, Shen Q, Sahir N. The GABAergic deficit hypothesis of major depressive disorder. Mol Psychiatry 2011;16(4):383–406.
- Hasler G, van der Veen JW, Tumonis T, Meyers N, Shen J, Drevets WC. Reduced prefrontal glutamate/glutamine and gamma-aminobutyric acid levels in major depression determined using proton magnetic resonance spectroscopy. Arch Gen Psychiatry 2007;64(2):193–200.
- Ma K, Xu A, Cui S, Sun MR, Xue YC, Wang JH. Impaired GABA synthesis, uptake and release are associated with depression-like behaviors induced by chronic mild stress. Transl Psychiatry 2016;6(10):e910.
- Taylor MJ, Godlewska BR, Norbury R, Selvaraj S, Near J, Cowen PJ. Early increase in marker of neuronal integrity with antidepressant treatment of major depression: 1H-magnetic resonance spectroscopy of N-acetyl-aspartate. Int J Neuropsychopharmacol 2012;15(10):1541–46.
- Coupland NJ, Ogilvie CJ, Hegadoren KM, Seres P, Hanstock CC, Allen PS. Decreased prefrontal Myo-inositol in major depressive disorder. Biol Psychiatry 2005;57(12):1526–34.
- Kastin AJ, Akerstrom V. Nonsaturable entry of neuropeptide Y into brain. Am J Physiol 1999;276(3 Pt 1):E479–82.
- Morris MJ, Chen H, Watts R, Shulkes A, Cameron-Smith D. Brain neuropeptide Y and CCK and peripheral adipokine receptors: temporal response in obesity induced by palatable diet. Int J Obes (Lond) 2008;32(2):249–58.
- Baranowska B, Wasilewska-Dziubinska E, Radzikowska M, Plonowski A, Roguski K. Neuropeptide Y, galanin, and leptin release in obese women and in women with anorexia nervosa. Metabolism 1997;46(12):1384–89.
- Hansen MJ, Jovanovska V, Morris MJ. Adaptive responses in hypothalamic neuropeptide Y in the face of prolonged high-fat feeding in the rat. J Neurochem 2004;88(4):909–16.
- Chen H, Hansen MJ, Jones JE, Vlahos R, Bozinovski S, Anderson GP, et al. Regulation of hypothalamic NPY by diet and smoking. Peptides 2007 Feb;28(2):384–89.
- Redrobe JP, Dumont Y, Fournier A, Quirion R. The neuropeptide Y (NPY) Y1 receptor subtype mediates NPY-induced antidepressant-like activity in the mouse forced swimming test. Neuropsychopharmacology 2002;26(5):615–24.
- El Yacoubi M, Vaugeois JM, Marguet D, Sauze N, Guieu R, Costentin J, et al. Behavioral characterization of CD26 deficient mice in animal tests of anxiety and antidepressant-like activity. Behav Brain Res 2006;171(2):279–85.
- Kamble M, Gupta R, Rehan HS, Gupta LK. Neurobehavioral effects of liraglutide and sitagliptin in experimental models. Eur J Pharmacol 2016;774:64–70.
- Guo M, Lu XY. Leptin receptor deficiency confers resistance to behavioral effects of fluoxetine and desipramine via separable substrates. Transl Psychiatry 2014;4:e486.