
ABSTRACT
Background
Tryptophan is the precursor to the mood regulating neurotransmitter serotonin. Its brain bioavailability from food can be dependent on the dietary source. Egg protein hydrolysate (EPH), a dietary supplement rich in tryptophan, has previously shown to acutely impact cognition, mood and stress benefits at 2 g dose. No data exist on the acute effects of lower doses in a food matrix.
Methods
This exploratory study tested the acute effects of low-doses EPH (0.5, 1 g) in a food matrix on cognition, mood and stress. The study employed a double-blinded randomized controlled parallel design in 45 participants with three arms. The effects of the interventions were measured after a multi-task cognitive stressor on blood biomarkers, self-reported mood states, performances of attention, autonomic parameters and, emotional reactivity responses from electroencephalographic recording.
Results
As compared to the reference, the 1 g EPH dose increased tryptophan bioavailability from baseline, and, both doses improved heart rate variability parameters related to parasympathetic activation while showing differences in the late neural response to negative versus neutral emotions. Post-hoc analyses indicated a gender difference in the baseline tryptophan bioavailability and further examination suggested the change in mood rating depends on the interaction between gender and change from baseline of tryptophan bioavailability.
Conclusions
Overall, this study suggests that low levels of tryptophan rich EPH in a food matrix positively impact mood or stress in acute settings and adds to the body of evidence linking tryptophan and dietary sources thereof with these benefits. Confirmatory randomized controlled trials are needed to confirm these findings.
Trial registration number: CER-VD N°2019-00218
1. Introduction
Tryptophan (TRP), an essential amino-acid available in food sources, is the sole precursor of the mood-regulating neurotransmitter serotonin, increasing its brain level while modulating its neurocircuit [Citation1]. Serotonergic innervations, found in brain regions related to emotion processing [Citation2], potentially play a role in cognitive functions with receptors expressed widely in memory and attention-related areas [Citation3]. Serotonin appears to interact with the homeostatic processes of the hypothalamic-pituitary adrenal (HPA) axis [Citation4] which, in response to stress, generates a set of signals coordinating the activity of the central and peripheral mechanisms and, stimulates the release of cortisol [Citation5]. Stress-induced homeostatic processes are also characterized by the activation of the ANS sympathetic branch leading to physiological arousal with heart rate acceleration and sweat gland activity [Citation6].
The biosynthesis of serotonin in the brain depends on the availability of TRP which, in turn, relies on the ratio to other large neutral amino acids (LNAA), specifically leucine, isoleucine, valine, phenylalanine, tyrosine and tryptophan [Citation7]. Interventions to increase the TRP:LNAA ratio have demonstrated mood benefits for people sensitive to stress [Citation8–11]. Rather than taking TRP supplements, ingredients with a relatively high TRP:LNAA ratio might exhibit better post-consumption outcomes with respect to mood, thanks to positive interactions between constituents [Citation12]. As an effective dietary source of TRP for the brain with high levels of TRP containing proteins and peptides and, an absorption period of approximately 90 minutes, the egg protein hydrolysate (EPH) appears as an ingredient of interest with positive effects seen on cognition, mood and stress [Citation13–15].
For the present study, a source of TRP with a controlled TRP:LNAA ratio (molar ratio approximately 0.2) has been obtained from EPH (NA2R, Bioseutica®, Netherlands). Brain TRP level has been suggested to predict mood changes according to an inverted U-shaped relation proposed in Hulsken et al. [Citation16]. This assumption is based on the observations that low doses of NA2R supplement (2 × 0.5 g NA2R in water matrix daily for 21 days) present beneficial effects on emotional and cognitive functions [Citation15]. Similarly, the consumption of 2 g of NA2R in a water matrix has shown acute mood and stress benefits. In the same study, 4 or 8 g of NA2R prevented the decline in wellbeing and increase in fatigue seen over the test session in the reference [Citation13]. This evidence of a dose-dependent effect supports the rationale that low doses of NA2R can lead to positive effects of mood and stress, although this has not been tested yet.
Stress induced with cognitive tasks, e.g. n-Back task [Citation17] or mathematical computations [Citation18], may affect working memory and attention processes [Citation19]. Acute TRP intervention has shown protective effect against stress reactivity to cognitively demanding tasks [Citation20]. Besides, acute TRP intake has been shown to counteract the negative impact of stress on emotion processing as seen in the significant shift of the subjective rating of negative facial expressions towards positive words and reduced negative bias [Citation13]. Electroencephalogram (EEG) offers a ground for exploration of the neural response to emotion faces, as event-related potentials (ERPs) [Citation21].
The purpose of this exploratory study is to test the acute effects of low doses EPH containing TRP (0.5 and 1 g EPH) in a food matrix on blood biomarkers, self-reported mood states, physiological stress parameters, emotional reactivity responses and, performances of attention after a multi-task cognitive stressor.
2. Material and methods
2.1 Design
The design of this exploratory study is parallel, randomized, double blind, controlled, 3-arms comparing two different doses of EPH (0.5 and 1 g) to a reference with no EPH, all in the same food matrix.
2.2 Participants
Healthy volunteers were recruited through a recruitment advertisement shared with Nestlé Research staff. Forty-five participants (25 females, mean age 33.3 ± 6.15 years, all right-handed) were randomly assigned to the 0.5 g EPH, 1 g EPH or reference group () and one dropped out prior to product intake. The main inclusion criteria were (i) adult male and/or female aged 25–45, (ii) healthy as determined by medical screening visit and medical history, no conditions that may affect mood or cognition e.g. lactating women, and (iv) a BMI between 18.5 and 24.9 kg/m2. Participants signed an informed consent prior to the start of the study and received financial compensation for participation. The study protocol conformed to the revised Declaration of Helsinki.
Table 1. Subject and dataset completion.
2.3 Nutritional interventions
The two investigational products were chocolate bars of about 32 g containing 0.5 g or 1 g of the low sodium version of the EPH NA2R (Bioseutica®, Netherlands), respectively and approximately containing 34 mg and 67 mg TRP. The chocolate matrix of the investigational products consisted of wafer, hazelnut flavored cream filling and a milk chocolate coating, where the sugar in the filling was partially replaced with EPH compared to the reference product. The reference product, also weighting approximately 32 g, was the same chocolate matrix except it was lacking EPH.
2.4 Procedure
Each participant completed one experimental visit of 150-min taking place in the afternoon after a 2 h food abstention period. On the experimental day, participants were requested to avoid food and beverages from a given list of products high in TRP, including products with meat, fish, soya, milk, egg or seeds. Compliance to the study restrictions was verified from a self-report prior to the experiment visit. The experiment was conducted in a sound-attenuated, shielded recording booth and was fully computerized using E-Prime® presentation software (Psychology Software tools, Sharpsburg, PA USA). Participants received the instructions from a computer screen and performed the required tasks using either a response box or a mouse pad. The study procedure is described in .
Table 2. Experimental procedure.
2.5.1 Blood samples and biomarkers
Six ml blood samples were collected by a research nurse. From these samples, hormonal signaling and TRP bioavailability markers were extracted using respectively an immunoassay module and an ultra-performance liquid chromatography-tandem mass (see description in the supplementary material).
2.5.2 Self-reports of mood states
Participants completed the Dynamic Visual Analogue Mood Scale (D-VAMS) [Citation22], the State-Trait Anxiety Inventory 6-item short form (STAI-6) [Citation23] and the 100-mm Visual Analog Scales (VAS) [Citation24]. Scores of self-reported mood states were extracted (see description in the supplementary material).
2.5.3 Multi-task cognitive stressor
Participants completed a multi-task cognitive stressor composed of Rapid Visual Information Processing (RVIP), Working Memory (WM), 1-back-symbol and mental arithmetic tasks. The task framework was implemented to induce a high workload, with tasks made more demanding and complex with time, going from low, medium to high difficulty level (see description in the supplementary material). The prior practice session involved the same tasks on a lower difficulty level, with detailed instructions and feedback.
2.5.4 Attention and emotional reactivity tasks
Participants completed RVIP and 1-back face tasks, implemented to assess attention and emotional reactivity. The task framework consisted in an 8-min 1-back face task, a 6-min RVIP task and another 8-min 1-back face task. Reaction time (RT) in milliseconds, hit (HIT) and false alarm rates were extracted from both tasks as attention performances.
2.5.5 Physiological parameters of stress
Finger blood flow and skin conductance signals were recorded with the Biosemi active-Two amplifier system (Biosemi Systems, Amsterdam, The Netherlands) at a frequency of 512 Hz. Finger blood flow was measured with a plethysmograph placed on the tip of the second finger of the left hand. Skin conductance was collected using two passive Nihon Kohden electrodes placed with electroconductive gel on the palm of the left hand. Kubios HRV software (www.kubios.com) was used to extract the heart rate (HR) and, parameters of heart rate variability (HRV) computed as the root mean square of successive differences between normal heartbeats in millisecond (RMSSD), the peak in the low frequency band [0.04–0.15 ] Hz (LF), the peak in the high frequency band [0.15–0.4] Hz (HF) and, the ratio of low frequency to high frequency peaks (LF:HF) [Citation25]. Ledalab software (www.ledalab.de) was used to compute the skin conductance level (SCL) in microSiemens [Citation26].
2.5.6 Neurophysiological responses of emotional reactivity
EEG signals were acquired with the Biosemi active-Two amplifier system at a frequency of 512 Hz. Sixty-four electrodes, referenced to the CMS-DRL ground, were placed on a headcap according to the 10–20 system. An electroconductive gel was applied on the scalp for capacitive coupling of the electrodes. The Cartool software processing pipeline (Brunet, brainmapping.unige.ch/cartool) was applied on the EEG signals recorded during the 1-back face task to extract ERPs and GFPs to emotion face stimuli. Only data with high-signal-to-noise ratio, from a subset of 21 participants (mean age 33.5±1.44), with 6 participants in each of the reference and 0.5 g EPH groups and, 9 participants in the 1g EPH group, were analyzed. The processing pipeline is detailed in the supplementary material.
2.6 Statistical approach
Study endpoints, except the neurophysiological responses, were analyzed through statistical gold-standard models implemented with the R statistical package version 3.5.2 (R Foundation for Statistical Computing, Vienna, Austria). When normality and homoscedasticity hypotheses of the endpoint were not respected, even after a log-transformation, a Wilcoxon rank sum test was applied. Changes from baseline to 95 minutes post-product intervention of bioavailability markers (TRP level and TRP:LNAA ratio) and cortisol level were analyzed through an analysis of covariance (ANCOVA) adjusted for baseline value. Changes from baseline to 95 minutes post-product intervention of insulin level was analyzed using a Wilcoxon rank sum test since the endpoint was not normally distributed. Overall ANS parameters (RMSSD, LF, HF, LF:HF ratio and SCL) were modeled with a linear mixed effects regression including the group, the timepoint and, the interaction between the group and the timepoint as fixed effects, as well as a subject-specific random effect to consider the repeated measurements at the subject level. The analyses of RMSSD and SCL were performed on a log-transformation of the endpoint to fulfill model’s assumptions. Mean HR was analyzed using a Wilcoxon rank sum test because the endpoint was not normally distributed. Post-stressor mood endpoints (D-VAMS, STAI anxiety and VAS stress scores) were analyzed through linear mixed effect models including the group, the timepoints and, the interaction between the group and the timepoint as fixed effects, as well as a subject-specific random effect. The self-reported product liking was tested using a one-way analysis of variance to assess for differences between groups. Post-stressor attention performances were analyzed through a Wilcoxon rank sum test due to the non-normal distribution of these endpoints.
GFPs from ERPs to post-stressor emotion face stimuli were compared using conventional high-density EEG procedures implemented in the Cartool software. A two-tailed paired T-test with a confidence level adjusted to 90% was used to consider for the size of data subset analyzed. Only statistical differences between GFPs data of, at least, 15-ms lengths and, associated to pronounced peaks with high signal-to-noise ratio, were considered [Citation27]. A topographic pattern analysis was also applied on ERPs, using the algorithm for agglomerative hierarchical clustering (AAHC).
In post-hoc analyses, demographic effects on baseline TRP:LNAA ratio were tested using a linear regression model including age, gender and BMI as covariates. Further linear regression models were applied to predict mood and ANS endpoints using the regressors for the change from baseline to 95 minutes post-product intervention in TRP:LNAA ratio, the gender and the interaction between them.
3. Results
3.1 Participant demographics
Participant demographics by intervention group are depicted in , showing an imbalance in gender between the 0.5 and 1 g EPH groups, with a larger proportion of females in the 1 g EPH group.
Table 3. Participant demographics and baseline blood measures.
3.2 Blood biomarkers
Differences in blood biomarkers between groups were tested ( and ). For TRP level change from baseline, significant differences were obtained between the 1 g EPH group and the reference as well as between the 1 g EPH and 0.5 g EPH groups (effect size = 8.22 umol/L with p = .0033 and, effect size = 8.31 umol/L with p = .0032, respectively). The analysis also showed that the differences in TRP:LNAA ratio change from baseline between the 1 g EPH group and the reference as well as between the 1 g EPH and 0.5 g EPH groups were significant (effect size = 0.01 point of % with p = .0002 and, effect size = 0.02 point of % with p = .0001, respectively). No other statistical differences were observed between the groups for TRP and TRP:LNAA ratio (p > .05).
Figure 1. Effects of egg protein hydrolysate (EPH) dosing on serum levels of tryptophan (TRP, in μmol/L) and ratio of tryptophan to other large neutral amino acids (TRP:LNAA). The effect was calculated as a percentage change from baseline to 95 minutes post-product intervention. The letters ‘a’ and ‘b’ respectively represent the statistical differences between the 1 g EPH group and reference and, between the 1 g EPH and 0.5 g EPH groups (p < .05).
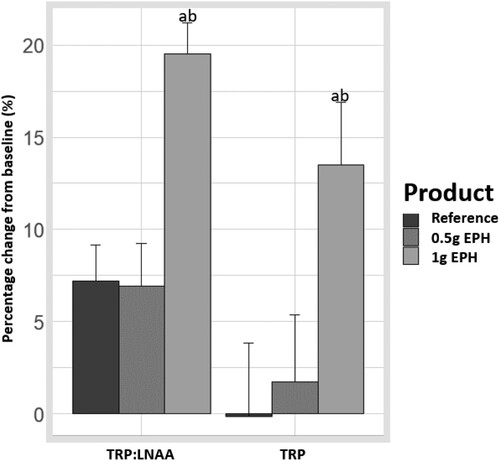
Table 4. Differences in blood biomarkers changes from baseline between groups.
Neither cortisol nor insulin were then significantly affected by any of the groups (p > .05).
3.3 Product liking and self-reported mood states
Differences in product liking and post-stressor mood states between groups were tested as shown in , with no significant differences observed (p > .05).
Table 5. Differences in product liking and post-stressor mood states between groups.
3.4 Performances of attention
Post-stressor differences in attention performances between groups were tested (). For RVIP, the reference displayed a trend for higher false alarm rate as compared to the 0.5 g EPH group (effect size = 0.18 point of % with p = .0713). For the hit rate of the 1-back face task, significant and trend level increases were respectively observed in the reference and the 0.5 g EPH group as compared to the 1 g EPH group (effect size = 10.00 points of % with p = .0044 and effect size = 6.67 points of % with p = .0698, respectively). No other statistical differences were observed between the groups for the performances (p > .05).
Table 6. Post-stressor differences in attention performances between groups.
3.5 Physiological parameters of stress
Differences in ANS parameters between groups were tested ( and ). Frequency components of HRV showed significant results, with a higher level of LF peak in the reference compared to the 1 g EPH group (effect size = 0.01 Hz with p = .0015) as well as a trend-level increase in the reference compared to the 0.5 g EPH group (effect size = 0.01 Hz with p = .0644). A significant lower level of HF peak was found in the reference compared to the 0.5 and 1 g EPH groups (effect size = −0.04 Hz with p = .0032 and effect size = −0.05 Hz with p = .0019, respectively). The LF:HF ratio was significantly higher in the reference compared to the 0.5 and 1 g EPH groups (effect size = 1.11 with p = .0003 and effect size = 0.14 with p < .0001, respectively). No other statistical differences were observed between the groups for the ANS parameters (p > .05).
Figure 2. Effects of egg protein hydrolysate (EPH) dosing on low frequency peak (Hz), high frequency peak (Hz) and, the ratio of low frequency to high frequency peaks of the heart rate variability spectrum. The letters ‘a’ and ‘b’ respectively represent the statistical differences between the 1 g EPH group and reference and, between the 0.5 g EPH group and reference (p < .05).
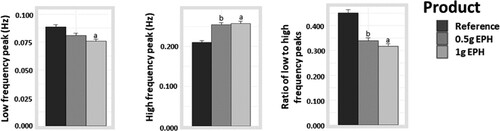
Table 7. Overall differences in autonomic parameters between groups.
3.6 Neurophysiological responses of emotional reactivity
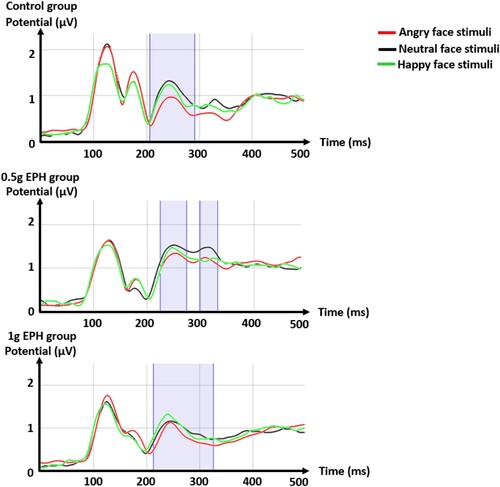
Differences in neurophysiological responses between groups were tested ( and ). Microstate segmentation identified five stable topographic maps common between the different groups, associated to the peaks P1, N170, P2, P3 and the late positive potential (LPP) of the ERP. In the 0.5 g EPH group, an additional and specific N170 map was observed in response to happy face stimuli, with a frontal distribution more marked than with angry and neutral face stimuli. Then, the 1 g EPH group showed a distinct LPP map in response to angry face stimuli with a more central distribution than with neutral and happy face stimuli (). In all groups, GFPs were significantly lower for angry than neutral face stimuli in P2 time range. These differences were observed from 207 to 291 ms for the reference (p < .1 with −3.59≤tratio≤−1.95), from 224 to 273 ms and from 298 to 332 ms for the 0.5 g EPH group (p < .1 with −2.44≤tratio≤ and −2.32≤tratio≤−1.65, respectively) and, from 142 to 170 ms and from 213 to 326 ms for the 1 g EPH group (p < .1 with −4.40≤tratio≤−1.96 and −4.36≤tratio≤−1.88, respectively), thus extending to P3 time range for EPH groups ().
Figure 3. Microstate segmentations, calculated from global field powers (GFPs, in microvolt), of event-related potentials (ERPs) to angry, happy, and neutral face stimuli for the reference, 0.5 g EPH and 1 g EPH groups, using the algorithm for hierarchical clustering. Each color in the graph represents a stable microstate associated with a scalp topographic pattern and an ERP peak (P1, N170, P2 or LPP). Time is given relative to stimulus onset.
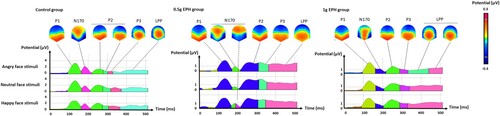
Figure 4. Global field powers (GFPs, in microvolt) of event-related potentials to angry, happy, and neutral face stimuli for the reference, 0.5 g EPH and 1 g EPH groups. Time is given relative to stimulus onset. Statistical differences between GFPs to angry and neutral face stimuli (p < .1) are highlighted in blue.
3.7 Post-hoc analysis
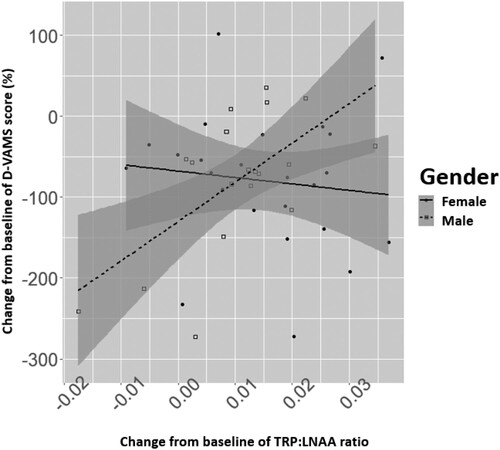
A post-hoc exploratory analysis was conducted (). The post-hoc exploratory data analysis suggested that age and BMI show a negative association with the TRP:LNAA ratio at baseline although these were not significant (effect size<−0.01 point for each 1-year increase in age with p = .60 and, effect size<−0.01 point for each kg/m2 increase in BMI with p = .90, respectively). On the contrary, gender showed a significant effect with the baseline value of TRP:LNAA ratio being lower in males than in females (effect size = −0.02 with p = .0054). We hypothesized that this effect at baseline may have impacted our ability to detect changes in mood that were related to changes in TRP:LNAA ratio. In order to evaluate this hypothesis, we tested a regression model of the change in D-VAMS rating from baseline to the end of the experiment as being dependent on the main and interaction effects of the gender and TRP:LNAA ratio change. The D-VAMS score at baseline was also considered in the model. The interaction between gender and TRP:LNAA ratio change from baseline was found to be statistically significant in this model (effect size = 6.31 point of % with p = .015) as compared to the D-VAMS score at baseline (effect size = −0.30 mm with p = .0761), TRP:LNAA ratio change from baseline (effect size = −0.44 point of % with p = .7910) and gender (effect size = −51.06 with p = .1685). This interaction appeared to be driven by a positive trend in males and a very weak negative trend in females. In particular, an increase of 1 point in TRP:LNAA ratio change from baseline resulted in an increase of 5.87 mm in D-VAMS score change from baseline in males, while for females, an increase of 1 point in TRP:LNAA ratio change from baseline led to a decrease of 0.44 mm in DVAMS score change from baseline. It should be noted that neither the TRP:LNAA ratio change from baseline nor D-VAMS score at baseline were shown to be different across gender (effect size = −1.72 point of % with p = .5550 and effect size = 33.72 mm with p = .1480, respectively).
Figure 5. Differential effect of the ratio of tryptophan to other large neutral amino acids (TRP:LNAA) change on Dynamic Visual Analogue Mood Scale (D-VAMS, in mm) score change by gender. Changes are calculated from baseline to 95 minutes post-product intervention.
4. Discussion
The objective of this exploratory study was to investigate the acute effect of low dose EPH as a source of TRP (0.5 and 1 g of EPH) in a food matrix on acute cognitive, mood and stress benefits in healthy adults. We observed an increase of TRP bioavailability in the blood, assessed via TRP:LNAA ratio, following the ingestion of a food matrix containing 1 g of EPH, which is aligned with previous findings [Citation10]. We also detected a EPH modulation of HRV frequency components and EEG parameters. Effects were absent on self-reported mood states, and negligible on attention performances.
This study brings insights for the research field of nutritional neuroscience, with results suggesting an efficacy of a TRP-rich EPH on acute mood and stress responses, at low doses never tested before [Citation13,Citation14]. This level of dose has positive implications for the accessibility of the ingredient, not only as a supplement, but also for incorporation in food matrices. This is particularly important given the negative sensory impact of the increasing dose of EPH on the chocolate snack. Chocolate flavanols have been shown to positively impact mood [Citation28] but flavor can modulate the psychological effects of chocolate [Citation29]. The taste impact of increasing EPH doses could interfere with the positive effect of chocolate sensory properties, and therefore diminish the effects attributed to the EPH interventions compared to the reference chocolate bar. To reduce possible interference with the sensory effect, future studies should consider the use of product formulations matched for taste. The food matrix may also have exerted an influence on the TRP:LNAA ratio via an insulin-mediated mechanism [Citation12]. Replacing some of the sugar in the cream with the egg protein hydrolysate could have impacted the TRP:LNAA bioavailability which would explain why the 0.5 g of EPH did not significantly raise the TRP:LNAA ratio from baseline to 95 minutes post-product intervention compared to the reference chocolate bar.
This work also contributed to the assessment of central and peripheral neural responses as objective markers to evaluate acute nutrition intervention effects on mood and stress. We demonstrated that the RMSSD time-based measure of HRV was less sensitive to EPH doses, compared to the frequency components, especially the HF peak. While the LF:HF ratio and the LF peak are presented here, the HF peak taken alone is often considered to be a sufficient measure of vagal tone [Citation30]. Although the 0.5 g EPH supplementation seemed to have an impact on the ANS, we did not observe any change from baseline in the blood TRP:LNAA ratio with this supplementation. Additional factors may have affected the ANS and this must be further investigated. The HPA axis response to stress would follow the ANS activation, with a slow temporal dynamic of minutes to hours [Citation31]. The cortisol pathway may not completely fit the study experiment timeline, which might explain why we did not observe any effect of EPH supplementation on cortisol level. Thanks to a temporal precision, EEG would allow to assess the effect of stress reactivity on neural responses to emotional stimuli, from their onset to latter processing stages [Citation21]. This assessment led to new evidence on the mechanisms of action of EPH as a nutritional solution for mood, reflected by a modulation of emotional stimuli latter processing possibly associated to a top-down neural processing [Citation32]. The approach used here comforted the suitability of emotional reactivity paradigms combined with neurophysiological measurement for the assessment of acute nutrition effects on acute stress.
While variations of frequential HRV and EEG suggested a modulation by EPH supplementations under condition of stress, no effects were observed on mood states. Post-hoc analyses shone further light on these findings by exploring the mechanism more directly, considering the mood effects of the actual change from baseline in TRP:LNAA ratio. This showed the same direction of effects as the dosing group but appeared to be a more sensitive measure for changes in mood rating. One reason for this may be the baseline variation in TRP:LNAA ratio although this was not significantly different between dosing groups. Still a significant difference in baseline TRP:LNAA ratio between the genders may be relevant. We unfortunately did not achieve gender balance between groups with, 53%, 40% and 67% females in the reference, 0.5 g EPH and 1 g EPH groups, respectively. Based on these observations, the post-hoc analysis showed that mood ratings were dependent on the interaction between gender and TRP:LNAA ratio change from baseline. This appeared to be driven by a positive trend in males and a very weak negative trend in females. The hypotheses of gender interaction effects on TRP bioavailability [Citation33] and, serotonin synthesis and usage [Citation34] have long been supported. So far, many studies have focused on females only which can be limiting in view of the above [Citation8,Citation13,Citation15].
Overall, this study adds to the research on dietary sources of TRP and demonstrated the impact of relatively low amounts of TRP from an EPH in a food matrix on cognitive, mood and stress measures, possibly via TRP bioavailability as quantified by the TRP:LNAA ratio. A confirmatory randomized controlled trial is needed to confirm the findings. Whether the above-mentioned effects of TRP are sustained in semi-acute or chronic setting also remains to be confirmed. Future research should explore the gender relationship with mood and stress relieving foods.
Author’s contributions
NS and SC initiated the study and produced the study product samples. AM, JH and NS developed research plan and protocol. AM and SZ conducted the proof-of-concept study and analyzed the behavioral and physiological data. JC led the biological sample analyses. AM, MA and SZ ran the statistical analyses. SZ led the manuscript writing. All authors discussed and interpreted the data, reviewed the draft critically for intellectual content, and read and approved the final manuscript.
Supplemental Material
Download Zip (98.5 KB)Acknowledgments
The authors wish to thank Pascal Steiner for the support of the study, Sylviane Oguey-Araymon, Clara Lerond, Karine Groulx, Frederik Delodder, Nathalie Piccardi, Yohan Grzywinski, Xavier Cornen and Mickaël Hartweg for their support in recruitment, coordination and sample management of the clinical trial.
Disclosure statement
This study received funding from the Société des Produits Nestlé SA. The funder had the following involvement with the study: study design, data collection, and analysis, decision to publish, and preparation of the manuscript. All authors were employed by Société des Produits Nestlé SA.
Additional information
Funding
Notes on contributors
Sélima Zahar
Sélima Zahar holds a Bioengineering degree. She is currently performing a PhD research project in the Mood & Performance group at Nestlé Institute of Health Sciences and the Swiss Federal Institute of Technology at Lausanne, Switzerland. She has an expertise in the fields of Neurophysiology and Neuroimaging with application to Nutrition.
Nora Schneider
Nora Schneider holds a PhD in Psychology. She is the head of the Brain Health Department at Nestlé Institute of Health Sciences, Lausanne, Switzerland. She has an expertise if the fields of Brain Health, Mental Health and Learning with application to Nutrition.
Aidan Makwana
Aidan Makwana holds a PhD in Neuroeconomics. He worked as an Associate Specialist in the Mood & Performance group at Nestlé Institute of Health Sciences, Lausanne, Switzerland. He has an expertise in Behavioral and Clinical Sciences with application to Nutrition.
Stephen Chapman
Stephen Chapman holds a B.A. in Chemistry and a M.S. in Food Science & Technology. He is a Senior Specialist at the Nestlé Product Technology Centre Confectionery York, United Kingdom. He has an expertise in the field of Product and Process Development in Food Industry.
John Corthesy
John Corthesy holds an Engineer degree in Micromechanics. He is the head of the Mass Spectrometry group at Nestlé Institute of Food Safety and Analytical Science, Lausanne, Switzerland. He has an expertise in Biological and Chemical Analyses with application in Nutrition.
Maïlis Amico
Maïlis Amico holds a PhD in Statistics. She worked as a Biostatistician in the Clinical Research Unit, Lausanne, Switzerland. She has an expertise in the fields of Data Science and Modelling in Biology.
Julie Hudry
Julie Hudry holds a PhD in Cognitive Neurosciences and completed a postdoctoral fellowship in Psychophysiology. She is the head of the Mood & Performance group at Nestlé Institute of Health Sciences, Lausanne, Switzerland. She has an expertise in the fields of Affective & Behavioral Neurosciences applied to Nutrition.
References
- Leathwood PD. Tryptophan availability and serotonin synthesis. Proc Nutr Soc. 1987;46(1):143–156.
- Asan E, Steinke M, Lesch KP. Serotonergic innervation of the amygdala: targets, receptors, and implications for stress and anxiety. Histochem Cell Biol. 2013;139(6):785–813.
- Schmitt J, Wingen M, Ramaekers J, Evers E, Riedel W. Serotonin and human cognitive performance. Curr Pharm Des. 2006;12(20):2473–2486.
- Tafet GE, Nemeroff CB. The links between stress and depression: psychoneuroendocrinological, genetic, and environmental interactions. J Neuropsychiatry Clin Neurosci. 2016;28(2):77–88.
- Lovallo WR, Buchanan TW. (2017). Stress hormones in psychophysiological research: Emotional, behavioral, and cognitive implications.
- Campbell NA, Reece JB, Urry LA, Cain ML, Wasserman SA, Minorsky PV, et al. Campbell biologie. Boston, MA: Pearson; 2016.
- Silber BY, Schmitt JAJ. Effects of tryptophan loading on human cognition, mood, and sleep. Neurosci Biobehav Rev. 2010;34(3):387–407.
- Sayegh R, Schiff I, Wurtman J, Spiers P, McDERMOTT J, Wurtman R. The effect of a carbohydrate-rich beverage on mood, appetite, and cognitive function in women with premenstrual syndrome. Obstet Gynecol. 1995;86(4):520–528.
- Markus C, Panhuysen G, Tuiten A, Koppeschaar H, Fekkes D, Peters M. Does carbohydrate-rich, protein-poor food prevent a deterioration of mood and cognitive performance of stress-prone subjects when subjected to a stressful task? Appetite. 1998;31(1):49–65.
- Markus CR, Olivier B, de Haan EH. Whey protein rich in α-lactalbumin increases the ratio of plasma tryptophan to the sum of the other large neutral amino acids and improves cognitive performance in stress-vulnerable subjects. Am J Clin Nutr. 2002;75(6):1051–1056.
- Firk C, Markus CR. Mood and cortisol responses following tryptophan-rich hydrolyzed protein and acute stress in healthy subjects with high and low cognitive reactivity to depression. Clin Nutr. 2009;28(3):266–271.
- Wurtman RJ, Wurtman JJ, Regan MM, McDermott JM, Tsay RH, Breu JJ. Effects of normal meals rich in carbohydrates or proteins on plasma tryptophan and tyrosine ratios. Am J Clin Nutr. 2003;77(1):128–132.
- Gibson EL, Vargas K, Hogan E, Holmes A, Rogers PJ, Wittwer J, et al. Effects of acute treatment with a tryptophan-rich protein hydrolysate on plasma amino acids, mood and emotional functioning in older women. Psychopharmacology (Berl). 2014;231(24):4595–4610.
- Kroes MC, van Wingen GA, Wittwer J, Mohajeri MH, Kloek J, Fernandez G. Food can lift mood by affecting mood-regulating neurocircuits via a serotonergic mechanism. Neuroimage. 2014;84:825–832.
- Mohajeri MH, Wittwer J, Vargas K, Hogan E, Holmes A, Rogers PJ, et al. Chronic treatment with a tryptophan-rich protein hydrolysate improves emotional processing, mental energy levels and reaction time in middle-aged women. Br J Nutr. 2015;113(2):350–365.
- Hulsken S, Märtin A, Mohajeri MH, Homberg JR. Food-derived serotonergic modulators: effects on mood and cognition. Nutr Res Rev. 2013;26(2):223–234.
- Jeunet C, Lotte F, Mühl C. (2014). Design and Validation of a Mental and Social Stress Induction Protocol.
- Qi M, Gao H, Liu G. The effect of mild acute psychological stress on attention processing: an ERP study. Exp Brain Res. 2018;236(7):2061–2071.
- Shields GS, Sazma MA, Yonelinas AP. The effects of acute stress on core executive functions: a meta-analysis and comparison with cortisol. Neurosci Biobehav Rev. 2016;68:651–668.
- Markus CR, Olivier B, Panhuysen GE, Van der Gugten J, Alles MS, Tuiten A, et al. The bovine protein α-lactalbumin increases the plasma ratio of tryptophan to the other large neutral amino acids, and in vulnerable subjects raises brain serotonin activity, reduces cortisol concentration, and improves mood under stress. Am J Clin Nutr. 2000;71(6):1536–1544.
- Adolphs R. Recognizing emotion from facial expressions: psychological and neurological mechanisms. Behav Cogn Neurosci Rev. 2002;1(1):21–62.
- Barrows PD, Thomas SA. Assessment of mood in aphasia following stroke: validation of the dynamic visual analogue mood scales (D-VAMS). Clin Rehabil. 2018;32(1):94–102.
- Marteau TM, Bekker H. The development of a six-item short-form of the state scale of the Spielberger state—Trait Anxiety Inventory (STAI). British Journal of Clinical Psychology. 1992;31(3):301–306.
- Wewers ME, Lowe NK. A critical review of visual analogue scales in the measurement of clinical phenomena. Res Nurs Health. 1990;13(4):227–236.
- Shaffer F, Ginsberg J. An overview of heart rate variability metrics and norms. Front Public Health. 2017;5:258.
- Benedek M, Kaernbach C. Decomposition of skin conductance data by means of nonnegative deconvolution. Psychophysiology. 2010;47(4):647–658.
- Brunet D, Murray MM, Michel CM. Spatiotemporal analysis of multichannel EEG: CARTOOL. Comput Intell Neurosci. 2011;(2011).
- Sokolov AN, Pavlova MA, Klosterhalfen S, Enck P. Chocolate and the brain: neurobiological impact of cocoa flavanols on cognition and behavior. Neurosci Biobehav Rev. 2013;37(10):2445–2453.
- Macht M, Mueller J. Immediate effects of chocolate on experimentally induced mood states. Appetite. 2007;49(3):667–674.
- Chalmers JA, Quintana DS, Abbott MJ, Kemp AH. Anxiety disorders are associated with reduced heart rate variability: A meta-analysis. Front Psychiatry. 2014;5:80.
- Herman JP, McKlveen JM, Ghosal S, Kopp B, Wulsin A, Makinson R, et al. Regulation of the hypothalamic-pituitary-adrenocortical stress response. Compr Physiol. 2016;6(2):603.
- Alomari RA, Fernandez M, Banks JB, Acosta J, Tartar JL. Acute stress dysregulates the LPP ERP response to emotional pictures and impairs sustained attention: time-sensitive effects. Brain Sci. 2015;5(2):201–219.
- Deac OM, Mills JL, Shane B, Midttun O, Ueland PM, Brosnan JT, et al. Tryptophan catabolism and vitamin B-6 status are affected by gender and lifestyle factors in healthy young adults. J Nutr. 2015;145(4):701–707.
- Nishizawa S, Benkelfat C, Young SN, Leyton M, Mzengeza S, de Montigny C, et al. Differences between males and females in rates of serotonin synthesis in human brain. Proc Natl Acad Sci U S A. 1997;94(10):5308–5313.