
 ?Mathematical formulae have been encoded as MathML and are displayed in this HTML version using MathJax in order to improve their display. Uncheck the box to turn MathJax off. This feature requires Javascript. Click on a formula to zoom.
ABSTRACT
Objectives
Cerebral ischemia is the most common cause of disability, the second most common cause of dementia, and the fourth most common cause of death in the developed world [Sveinsson OA, Kjartansson O, Valdimarsson EM. Heilablóðþurrð/heiladrep: Faraldsfræði, orsakir og einkenni [Cerebral ischemia/infarction - epidemiology, causes and symptoms]. Laeknabladid. 2014 May;100(5):271–9. Icelandic. doi:10.17992/lbl.2014.05.543]. Obesity has been associated with worse outcomes after ischemia in rats, triggering proinflammatory cytokine production related to the brain microvasculature. The way obesity triggers these effects remains mostly unknown. Therefore, the aim of this study was to elucidate the cellular mechanisms of damage triggered by obesity in the context of cerebral ischemia.
Methods
We used a rat model of obesity induced by a 20% high fructose diet (HFD) and evaluated peripheral alterations in plasma (lipid and cytokine profiles). Then, we performed cerebral ischemia surgery using two-vessel occlusion (2VO) and analyzed neurological/motor performance and glial activation. Next, we treated endothelial cell line cultures with glutamate in vitro to simulate an excitotoxic environment, and we added 20% plasma from obese rats. Subsequently, we isolated EVs released from endothelial cells and treated primary cultures of astrocytes with them.
Results
Rats fed a HFD had an increased BMI with dyslipidemia and high levels of proinflammatory cytokines. Glia from the obese rats exhibited altered morphology, suggesting hyperreactivity related to neurological and motor deficits. Plasma from obese rats induced activation of endothelial cells, increasing proinflammatory signals and releasing more EVs. Similarly, these EVs caused an increase in NF-κB and astrocyte cytotoxicity. Together, the results suggest that obesity activates proinflammatory signals in endothelial cells, resulting in the release of EVs that simultaneously contribute to astrocyte activation.
Significance statement:
Obesity by HFD increases proinflammatory circulating cytokine levels in plasma, inducing a proinflammatory state in endothelial cells with major production of extracellular vesicles (EVs). These endothelial EVs cause inflammation and cytotoxicity in astrocytes, providing insight into why obesity exacerbates cerebral ischemic damage and neurological consequences.
Introduction
Different environmental variables affect brain health, including food intake habits, physical activity, seasons, infections, social interaction, lifestyle, toxins, and stress, among others. Nutritional habits modulate the onset and pathogenesis of metabolic diseases, including obesity, type II diabetes, and metabolic syndrome, and age-related acute and chronic neurological disorders, such as cerebral ischemia and dementia [Citation1]. Currently, obesity is known to be strongly associated with metabolic disorders and some neurological disorders, such as attention deficits, poor executive function, impaired decision-making, decreased verbal learning, mild cognitive impairment, Alzheimer’s disease, and other forms of dementia [Citation2,Citation3].
Similarly, obesity is a risk factor for cerebral ischemia and is one of the most common comorbidities observed in patients with stroke (35.5% of first-ever stroke patients are classified as clinically obese) [Citation4,Citation5]. However, the mechanism by which obesity affects stroke is not fully understood. Some preclinical studies suggest that obesity affects stroke through pathological inflammation and remodeling of the cerebral vasculature or the entry of peripheral signals into the brain parenchyma, thereby exacerbating inflammatory processes [Citation5].
In obese rats, it has been shown that the severity of stroke is primarily characterized by an increase in infarct volume [Citation6,Citation7]. Several previous studies have shown that the obese phenotype triggers pathophysiology, aggravating the response to ischemic stroke. Obesity increases blood pressure, induces brain vascular remodeling, increases leukocyte and platelet adhesion in cerebral small vessels, increases the permeability of the brain–blood barrier (BBB) and elevates the proinflammatory response [Citation6–8].
Most animal models of obesity and stroke are induced by feeding a high-fat diet [Citation5]. However, other sources of calories exist, such as the consumption of large amounts of added sugar (fructose), which is a prominent source of low-nutrient calories in processed foods and caloric beverages that increases the risk of obesity, dyslipidemia, insulin resistance and heart diseases [Citation5]. High fructose consumption is associated with metabolic syndrome prevalence. Fructose enhances the synthesis of triglycerides (TGL) from glycerol and fatty acid (FA) formation. Subsequently, TGL is stored as fat until a depletion of deposited glucose triggers negative feedback. However, as glucose scarcity is less probable, the metabolized fructose is deemed in excess and is stored principally as fat [Citation9]. On the other hand, there are several models of cerebral ischemia that have been implemented in rodents. In the two-vessel occlusion (2VO) model, reversible forebrain ischemia results from bilateral occlusion of the common carotid artery (CCA). This ischemia and reperfusion model affects large areas of the forebrain using a relatively simple surgical procedure compared to other ischemia models and showing low mortality rates. This animal model is also suitable for molecular, biochemical, and physiological studies, as well as for evaluation of neuroprotective procedures and agents [Citation10].
On the other hand, considering the uptake of nutrients to the brain from the circulation, endothelial cells are relevant because these cells are part of the BBB physiology and pathology and are responsible for the trafficking of molecules between the periphery and the brain, vascular tone maintenance, regulation of blood flow, and modulation of the inflammatory response[Citation11]. For example, it has been previously described that plasma contains extracellular vesicles (EVs) carrying chemical signals [Citation12,Citation13] that exert endocrine signalling far away from their origin [Citation14]. Also, EVs in circulation have been involved in metabolic health and stress by obesity, transporting proinflammatory messages [Citation15].
We previously observed an increase in IL-1β in blood vessels of the obese rat hippocampus, which was related to glial hyperreactivity, neuronal loss, and worsened neurological performance in a model of obesity induced by a fructose diet (20%) in rats after cerebral ischemia[Citation16]. Therefore, we hypothesized that endothelial damage could be one of the primary contributors to neurological alterations in obese rats after cerebral ischemia. In these experiments, we analyzed the effect of peripheral signals and EVs from plasma of obese rats on endothelial and neuronal cell health and injury by glutamate in vitro.
Materials and methods
In vivo experiments
Animals
Male Wistar albino rats that were 4 months old and weighing 270–470 g were obtained from Charles River laboratories. Rats were bred and housed at the SIU (Sede de Investigación Universitaria), University of Antioquia, Medellin, Colombia, on a 12-hour dark/light cycle and received food and water ad libitum. Four to five animals were housed in each cage. All animal experiments were approved by the Ethics Committee for Animal Experimentation of the University of Antioquia, Medellín, Colombia and were performed following Colombian standards.
Diet
We divided the Wistar rats into two groups: control and high fructose diet (HFD) (n = 12). Both groups were fed standard food (Laboratory Autoclavable Rodent Diet 5010, LabDiet, St Louis, MO) and provided water ‘ad libitum’ for 11 weeks. The control group was fed pure water. Instead, the HFD group was fed with water ‘ad libitum’ containing a solution of 20% fructose (D-fructose pure, pharma grade, PanReac AppliChem, 142728) dissolved. We prepared and changed the fructose every 48 h as maximum, or before if needed. At the same time, we measured the water and food intake per cage, which was divided by the number of animals to estimate the consumption per animal. Food intake was used to estimate the daily energy intake (Kcal/day) using the following formula: energy intake from food (Kcal/day) = food consumption (g) × 3.17 KCal/g. In the same way, we estimated the energy intake from water as water consumption (ml) × 0.8 Kcal/ml. The increment of Kcal/day of HFD compare to control group was calculated subtracting the total calories of the normal diet to the total calories of the HFD diet.
Zoometry and fasting blood glucose
During the experimental period, both groups were monitored weekly. This monitoring included measuring body weight, waist circumference, and nasoanal length (n = 12). We used a measuring tape to arrange the waist circumference, placing the tape in the middle between the hip and the end of the ribs. The Lee index was also calculated as: 3√weight (g)/nasoanal length (cm).
Intraperitoneal glucose tolerance test (ipgtt)
During the 10th week of the diet, the animals were subjected to 6 h of fasting. Then, the animals were anesthetized with isoflurane before the injection (n = 12). Intraperitoneal glucose 50% was injected (2 g/kg). A blood sample from the tail of the rats was obtained by puncture, and the blood glucose levels were measured before the injection and 30, 60, 90 and 120 min after injection using a glucometer (Accu-chek Performa).
Insulin tolerance test (ITT)
Eight days after the IPGTT, the animals were subjected to 6 h of fasting, and an intraperitoneal insulin test was performed (0.5 U/kg) (n = 12). A blood sample from the tail of the rats was obtained by puncture, and the blood glucose levels were measured before and 15, 30, 60 and 90 min after insulin injection using a glucometer (Accu-chek Performa).
Cytokine profiles
At the end of week 11 on the respective diets, we collected blood samples by anesthetizing the animals and made an incision in the left leg to access the lateral saphenous vein. A catheter was then placed into the vein, and we collected blood in a 2 ml EDTA tube. The blood was centrifuged for 10 min at 1000 g at room temperature. We subsequently measured the levels of IL-1β, IL-6, TNFα, and IL-10 cytokines using a commercial bead-based immunoassay following the manufacturer’s protocol [Citation17].
Surgery
After 11 weeks of being on their respective diets, the groups were randomly divided into four groups: sham control (n = 5), sham HFD (n = 5), ischemia control (n = 7) and ischemia HFD (n = 7). The ischemic control and ischemic HFD groups underwent global cerebral ischemia by two-vessel occlusion (2VO). This was achieved by permanently occluding the right common carotid artery (CCA) using a 6.0-gauge nylon suture. The left CCA was occluded for 20 min using a vascular clip. Next, the vascular clip was removed to allow reperfusion. In contrast, the sham control and sham HFD groups underwent the same surgical process without occlusion. For the surgery, the rats were anesthetized using ketamine (90 mg/kg) and xylazine (5 mg/kg) (K/X) and received a 2–4% isoflurane and 96% oxygen mixture via an inhalation anesthesia machine. At the end of the experiments the euthanasia was by K/X before perfusion or by CO2 exposure.
Neurological testing
We evaluated neurological scores for all four groups 6, 24 and 48 h after cerebral ischemia surgery using an 18-point scale neurological test as described in Perez-Corredor et al. [Citation16]. In summary, it consists of six independent tests scored from 0 to 3 to determine neurological performance. The highest score in the neurological test is 18, indicating no neurological deficits, while the lowest is 0, indicating the most severe impairment. Neurological testing was performed in the same order in all animals throughout the evaluation period.
Blood tests
Forty-eight hours after cerebral ischemia, blood samples were collected by cardiac puncture in 5 ml tubes (gel + clot activator, yellow cap) (n = 4-7). Total cholesterol, HDL, LDL and vLDL cholesterol, triglycerides and insulin levels from the blood were detected by TEST LABORATORIO (NIT. 900319592-4) in a double-blind analysis.
Brain analysis
Animals were anesthetized using ketamine (90 mg/kg) and xylazine (5 mg/kg) intraperitoneal injection and perfused with saline solution 0.9% (p/v) and paraformaldehyde 4% (p/v). Brains were carefully removed and postfixed in 4% paraformaldehyde at 4°C for 48 h and then preserved in a sucrose gradient (7%, 25%, 30%) at 4°C. The brains were then placed in a cryopreservation solution at −20°C. Then, coronal sections were cut at 50 μm thickness using a vibratome (VT1000S™, Leica Microsystems, Nussloch, Germany). Staining was performed using previously described protocols for immunohistochemistry [Citation16]. The tissues were stained using the following primary antibodies for glial cells: anti-GFAP (monoclonal anti-glial fibrillary acidic protein, Sigma–Aldrich Cat# G3893, RRID:AB_477010, 1:500) and anti-Iba1 (rabbit polyclonal, Wako Cat# 019-19741, RRID:AB_839504, 1:500). The following coordinates from the bregma were selected for the histological analyses: 0.96, −2,92 and −4.44.
Morphometric cellular analysis
To determine the morphometric changes between glial cells of obese ischemic animals and control ischemic animals, we selected the amygdala and the motor cortex since these areas exhibited more changes (by observation). Then, we captured five representative cells of every area per sample (n = 3) using an optic microscope Nikon 100X oil-immersion objective. Next, images were processed and analyzed using FIJI ImageJ. First, we adjusted brightness and contrast and subtracted the background using a rolling ball radius of 20 pixels. The resulting images were converted to 8 bits and binarized by filtering out intensities below the remaining background mean value. Definitive segmentation of the processes was performed using the simple neurite tracer plugin manually drawing the regions of interest (ROIs) and the somas using the oval drawing tool. The processes and somas were analysed separately for the following factors using Fiji ImageJ software: area, perimeter, width, height, circularity, Feret properties, AR, round and solidity.
In vitro experiments
Endothelial cell line culture
An immortalized endothelial cell line called bEnd.3 from the brain microvasculature was used for endothelial cell in vitro experiments. Endothelial cell cultures were grown in DMEM supplemented with 10% FBS and a 1% penicillin–streptomycin mixture. After the cells were confluent, they were subcultured on 12 mm coverslips precoated with gelatin. After the confluent monolayer was formed, we removed the medium and washed the plates with 1x PBS. Then, we treated cells with 80% supplemented DMEM (FBS 10% and antibiotic 1%) and 20% plasma from i) rats fed normal water (plasma control) or ii) rats fed a HFD (plasma HFD). Plasma was centrifuged at 3000 rpm for 5 min before we treated the cells. After 24 h of treatment with plasma, we treated cells with 125 µM glutamate for 20 min. Then, we replaced the medium with DMEM, and 48 h later, we placed the supernatant into two tubes, one to perform the LDH test and the other to treat the astrocytes later and stored it at −80°C. The cells were fixed for subsequent immunofluorescence.
Extracellular vesicles from endothelial cells
Supernatants from endothelial cells were centrifuged at 3000 x g for 20 min at 21°C to discard the cell debris. Extracellular vesicles (EVs) were isolated from the supernatant by centrifugation at 16,900 × g for 1 h at 21°C. The EVs was resuspended in 1X PBS. EV number and size parameters were evaluated (forward scatter, FSC-A) using a flow cytometer calibrated with polystyrene spheres of known sizes (0.5, 1, and 2 μm). Filtered PBS was used as a reference to determine the threshold of the measurements for all samples. Commercial spheres of known concentration (Beckman Coulter, IM3630E) were used to determine the EV concentration in 1 mL of the samples. The EV number corresponded to the number of total events registered during the assay after correction for the dilution factor and the read time. Last, all samples were washed with 1X filtered PBS and immediately processed using a Beckman Coulter CytoFLEX flow cytometer (to measure the events with sizes of 100, 160, 200 and 300 nm). Data analysis was performed using FlowJo 7.6.1 software (Tree Star, Inc., Ashland, OR, United States).
After the read, EV pellets were immediately resuspended in DMEM to treat astrocytes.
Primary rat astrocyte culture
We obtained astrocytes by dissecting the brain cortex from newborn Wistar rats on postnatal days 1-2. Cells were trypsinized, dissociated and cultured in T75 flasks and maintained in DMEM supplemented with 10% FBS at 37°C and 5% CO2. The medium was changed every 2 days. At 8 days in vitro (DIV), the flask was placed in a shaker at 37°C at 350 rpm for 24 h, and the microglia and oligodendrocytes were removed by washing the cultures with 1X PBS at 6, 18, and 24 h.
At 12 DIV, the astrocytes reached confluence and were subcultured in 12-well plates (5 × 10⁴ cells per coverslip). Then, astrocytes were treated with 30% supernatant or vesicles from bEnd. III cells (previously exposed to plasma from obese rats) for 48 h. Finally, we collected the supernatant for the LDH test and fixed the cells.
Cell death analysis
We measured lactate dehydrogenase (LDH) released from endothelial and astrocyte cultures treated with plasma and endothelial cell supernatants, respectively, using a cytotoxicity detection kit (Roche). We determined LDH activity by measuring NADH absorption using a spectrophotometer. The percentage of cytotoxicity was calculated using the following equation:
where A represents the mean LDH activity in the media from three wells per duplicate, low control represents LDH released from untreated control cells, and high control represents the maximal LDH release from the cells that correspond to the cells that were treated with 1% Triton X-100 for 24 h.
Cellular immunofluorescence
We fixed cultures in 4% paraformaldehyde prepared in cytoskeleton buffer for 20 min. Autofluorescence was eliminated using 50 µm NH4Cl for 10 min. We permeabilized the cells and treated them with PBS + 0.2% Triton X-100 for 5 min and 2.5% FBS for 1 h, respectively. We incubated endothelial cells with mouse primary antibodies against ZO-1 (rabbit polyclonal, Thermo Fisher Scientific Cat# 40-2200, RRID:AB_2533456, 1:500), interleukin-1 beta (mouse monoclonal, Millipore Cat# MABF18, RRID:AB_10807965, 1:500), cPLA2 (Cell Signaling Technology Cat# 2831, RRID: AB_2164445) and phalloidin conjugated to Alexa 488 or 594 (1:1000, Molecular Probes). We incubated astrocytes with anti-GFAP (1:750, Sigma–Aldrich, 3-M4403) and anti-NFκB p65 (#8242, Cell Signaling Technology, RRID:AB_10859369 1:350) overnight at 4°C, followed by incubation with Alexa 488 or 594 secondary antibodies (1:1000 molecular probes). We stained nuclei with Hoechst 33,258 (1:5000 Cell Signaling Technology Cat# 4082, RRID: AB_10626776). We washed the cells four times with 1X PBS, cover-slipped them using FluorSave and observed them under an Olympus epifluorescence microscope.
Statistical analysis
Data were analyzed and plotted using GraphPad Prism (RRID: SCR_000306). Statistical analysis was performed using the Shapiro–Wilk normality test for all data. P > 0.05 was considered a normal distribution. Multiple t-tests were performed for the morphometric parameters, daily intake of water and food, IPGTT, ITT, and neurological testing using correction for multiple comparisons with the Sidak-Bonferroni method. T-tests were used for fasting glucose and insulin levels in plasma and lipid profile measurements. One-way ANOVA was used to analyze the supernatant and EVs from the endothelium in astrocyte experiments. Two-way ANOVA followed by Tukey’s post hoc test was performed for the other immunohistochemistry and immunofluorescence analyses. p < 0.05 was considered statistically significant. The criterion used was p = 0.05.
Results
A high fructose diet increases caloric intake and morphometric parameters in rats
Over 11 weeks of the respective diets, rats fed the HFD drank more water and ate less food than the controls ( A, B). Similarly, animals fed a HFD ad libitum consumed 7.38% more total daily calories than animals fed a control group (), of which 80% were from carbohydrates. Additionally, the HFD rats rapidly gained weight and abdominal circumference and exhibited increased Lee index compared to control rats ( C, D).
Figure 1. HFD induces a state of obesity in rats. Daily water intake (a), daily food intake (b), abdominal circumference (c) and Lee index (d) were measured to analyse the effect of HFD on morphometric parameters (n = 12). To detect glucose alterations, we measured the IPGTT (e) and ITT (f) (n = 12). The lipid profile (n = 4-7): Triglycerides (g), vLDL cholesterol (h) and the cytokines (n = 3-4): IL-1β, IL-6, TNFα and IL-10 (i-l), were measured to confirm obesity-related peripheral alterations induced by the HFD. *P < 0.05 **p < 0.01 and ***P < 0.001. Data are presented as the mean ± SEM n.
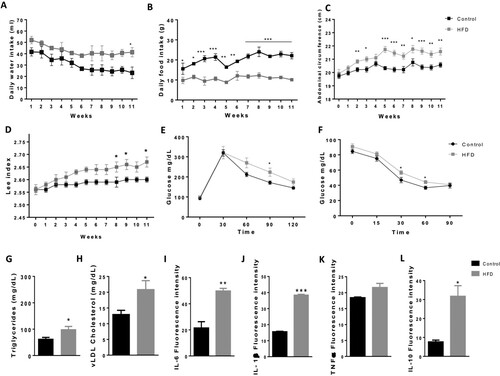
Table 1. Energy resources (Kcal/day) and ratio (%) of the daily Kcal average provided by macronutrients
Although there were no significant differences in the fasting blood glucose or insulin levels in HFD animals compared to animals in the control group (Supplementary Fig. 1 B, C), there was an altered glucose tolerance test curve. HFD animals displayed increased levels of glucose 90 min after glucose injection (*P < 0.05) (E). The insulin tolerance test revealed increased glucose levels 30 and 60 min after insulin injection (*P < 0.05) (F).
HFD induces dyslipidaemia and increases proinflammatory cytokines
HFD triggered peripheral alterations in the blood. HFD animals exhibited higher levels of triglycerides and vLDL cholesterol (*P < 0.05) ( G, H). However, there were no changes in total cholesterol, HDL or LDL cholesterol (Supplementary Fig. 1 D-F). Furthermore, HFD animals had increased proinflammatory cytokines IL-1β (***P < 0.001) and IL-6 (**P < 0.01), and they presented higher levels of IL-10 (*P < 0.05) than controls, while there were no significant changes in TNF-α levels ( I-L).
Obesity causes 42.84% of deaths and neurological and motor impairment in the first hours postischemia
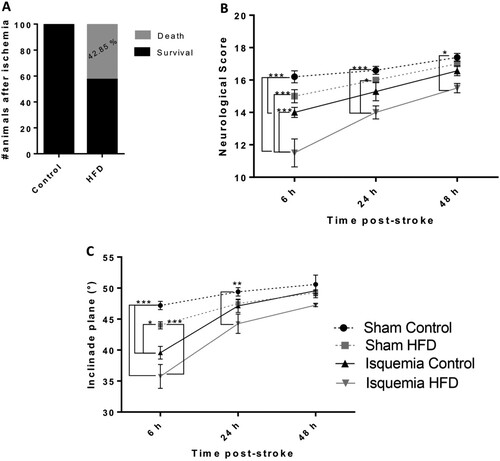
There was a remarkable increase in death in obese animals after cerebral ischemia surgery: 50% of obese animals died during the first 6 h (A). Furthermore, the survival of obese animals showed alterations in the neurological testing 6 h postischemia (ischemia HFD compared to all other groups) (***P < 0.001) (B). At 24 h, there were still alterations in the neurological score of ischemic obese animals compared to the sham control (***P < 0.001) and sham obese score (*P < 0.05). At 48 h, the ischemic obese animals presented neurological alterations compared to sham control animals (*P < 0.05) (B). In addition to the alterations in the neurological test, ischemic obese animals displayed impaired inclined plane test results at 6 h compared to sham controls (***P < 0.001), sham HFD (***P < 0.001) and ischemia control (*P < 0.05) groups. Twenty-four hours postischemia, there was a difference between sham control and ischemia obese animals (**P < 0.01). However, at 48 h there were no differences between the groups ( C).
Figure 2. Obesity increases the risk of death after cerebral ischemia and causes neurological and motor impairment during the first hours poststroke. Percentage of dead animals after cerebral ischemia (A). Neurological deficits were evaluated using the neurological score (B), and motor skills were evaluated using the inclined plane (C). *P < 0.05 **p < 0.01 and ***P < 0.001. Data are presented as the mean ± SEM (n = 4-7).
Cerebral ischemia and obesity alter the morphological characteristics of glial cells
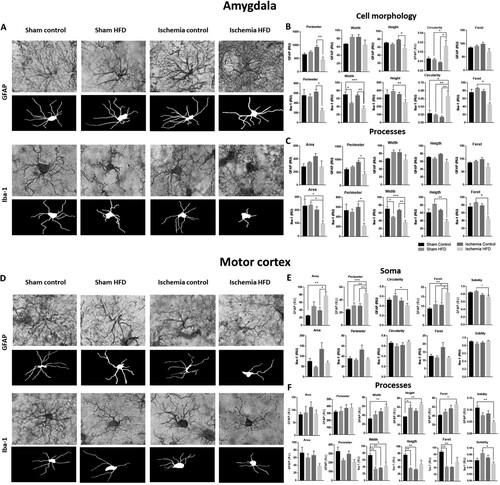
Cerebral ischemia and obesity affected the structure of glial cells in the amygdala (bregma −2.92 mm) (. A, C). There was a reduction in the size of the astrocytes (perimeter and height *P < 0.05) and increased circularity (*P < 0.05). In the microglia, morphological changes were accentuated; the perimeter and Feret were reduced (*P < 0.05), as were the width and height (**p < 0.01) and the circularity (**p < 0.01). Moreover, the processes of both types of glia were reduced in the perimeter (*P < 0.05) and were primarily affected in the microglial area (*P < 0.05), width (***P < 0.001), height (**p < 0.01) and Feret (*P < 0.05). In addition, in the motor cortex from obese ischemic rats, there was an inverse effect on the soma of astrocytes, increasing the area (*P < 0.05), perimeter (**P < 0.01) and Feret (*P < 0.05), and reducing the circularity (*P < 0.05) and solidity (*P < 0.05). The processes also presented with increased width and height (**P < 0.01) and more Feret (*P < 0.05) in astrocytes but with less solidity (**P < 0.01). Conversely, the microglia did not reduce all of these parameters in the processes, but the HFD or ischemia groups alone affect them, primarily with respect to the width (*P < 0.05), height, solidity (*P < 0.05) and, Feret. Together, these structural alterations in glial cells were increased in cerebral ischemic animals with comorbid obesity, indicating reactive astrogliosis and microgliosis.
Figure 3. Obesity induces glial morphological changes in the amygdala and motor cortex. We analyzed (A) the cell morphology (B) and processes (C) of astrocytes and microglia in the amygdala and (D) the soma morphology (E) and processes (F) of astrocytes and microglia in the motor cortex. *P < 0.05 **p < 0.01 and ***P < 0.001. Data are presented as the mean ± SEM (n = 5).
Plasma from obese rats causes endothelial damage in vitro
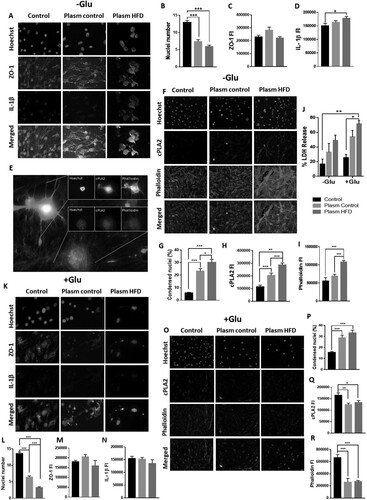
We tested the effect of plasma from obese rats (HFD) on endothelial cells. Cells treated with HFD plasma were more morphologically affected than those treated with plasma from control rats, and HFD endothelial cell culture showed an increase in IL-1β immunofluorescence (*P < 0.05) and a dramatic loss of cells quantified by nuclei number (***P < 0.001) (. A, B, D). There were no differences in ZO-1 fluorescence intensity (FI) obtained in cells treated with HFD plasma compared to control cells ( C). Although we observed changes in the distribution of ZO-1 fluorescence, aggregates were present in the somas with loss of expression in the cell membrane ( A). In addition, endothelial cells exhibited increased condensed nuclei (*P < 0.05), which was related to an increase in phalloidin (***P < 0.001) and cPLA2 FI (***P < 0.001) ( E-I). However, in cells with advanced cell death processes (fragmented nuclei and actin depolymerization), this was not observed ( E). This experiment was simultaneously run in an excitotoxic environment with glutamate ( K, O). This scenario affected endothelial cells treated with plasma to a large degree, increasing LDH release by more than 50% under HFD plasma conditions ( J), causing significant endothelial loss, supported by a reduction in the number of nuclei ( K, L, O) with condensed nuclei (***P < 0.001) ( K, O, P) and, consequently, a decrease in the FI of ZO-1 and IL-1β ( K, M, N), cPLA2 (*P < 0.05) and phalloidin (***P < 0.001) ( O, Q, R).
Figure 4. Plasma from obese rats induces damage in a mouse brain endothelial cell line. Endothelial cells were treated with plasma from obese rats (A). The number of nuclei (B) and the fluorescence intensity of ZO-1 (C) and IL-1β (D) were evaluated. *P < 0.05 **p < 0.01 and ***P < 0.001. Data are presented as the mean ± SEM (n = 3).
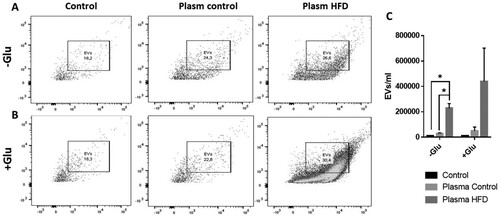
Obesity increases extracellular vesicle release from endothelial cells
We extracted EVs derived from endothelial cells exposed to the plasma of normal weight rats (bEnd.3 control) and obese rats (bEnd.3 HFD). The bEnd.3 HFD released significantly more extracellular vesicles than the bEnd.3 control ( A, C). This maintained the tendency to increase released EVs in an excitotoxic context induced by glutamate ( B, C).
Figure 5. Endothelial cells treated with plasma from obese rats release more extracellular vesicles. We measured endothelial cell-derived EVs (A) in cells exposed to plasma from obese rats with and without glutamate (B, C). *P < 0.05. Data are presented as the mean ± SEM (n = 3).
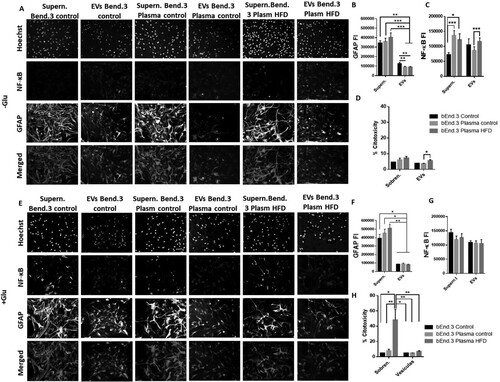
EVs released from endothelial cells treated with plasma from obese rats increase cytotoxicity and NF-kB in astrocytes
We treated primary astrocyte cultures with supernatant and EVs isolated from the supernatant of endothelial cells exposed to plasma from obese rats to understand the effect of endothelial damage (induced by obesity) on astrocytes (). Additionally, we used the supernatant and EVs from endothelial cells treated with and without glutamate. We observed that astrocytes treated with supernatant from endothelial cells exposed to plasma from control (bEnd.3 plasma control) and obese rats (bEnd.3 plasma HFD) did not exhibit differences in the FI of GFAP with respect to the control (bEnd.3 control) (A, B). On the other hand, treatment with EVs from endothelial cells exposed to plasma from both obese and control animals (bEnd.3 plasma control and HFD) decreased the GFAP FI of astrocytes compared to that of the EV control (bEnd.3 control). Expression of NF-kβ was increased in astrocytes treated with the supernatant of endothelial cells independent of the plasma treatment from obese (*P < 0.05) and nonobese rats (***P < 0.001), although there was no differential effect between them ( A, C). However, there was a difference in astrocyte NF-kβ FI after treatment with EVs from bEnd.3 plasma HFD and EVs from bEnd.3 plasma control ( A, C). In the same way, treatment with bEnd.3 plasma HFD caused an increase in cytotoxicity with respect to the bEnd.3 plasma control ( D). The excitotoxic context (with glutamate) exhibited a decrease in GFAP FI after treatment with EVs compared to treatment with supernatant in all groups ( E, F). There were no differences between groups in the NF-kβ FI ( G). Treatment with supernatant bEnd.3 plasma HFD + Glu caused a marked cytotoxic response (>40%) (H).
Figure 6. Endothelial EVs produced by obesity signals increase NF-κB in astrocytes. Cells were exposed to supernatant or EVs from endothelial cells after being treated with plasma from obese rats (A), and the fluorescence intensities of GFAP and NF-κB were measured in astrocytes treated with EVs or supernatant from endothelial cells exposed to obese rat plasma (B, C). The cytotoxicity percentage was calculated by LDH release (D). Furthermore, the same experiment was evaluated under excitotoxic conditions (E), and the fluorescence intensities of GFAP and NF-κB were measured (F, G). *P < 0.05, **P < 0.01 and ***P < 0.001. Data are presented as the mean ± SEM (n = 3).
Discussion
Our findings showed that HFD led to increased caloric intake, thereby leading to obesity characterized by dyslipidaemia, increased proinflammatory cytokine levels, increased poststroke neurological and motor deficiency and increased glial reactivity after cerebral ischemia in rats, which could be explained by endothelial activation due to the direct contact of these cells with signals in the plasma that causes increased release of EVs that also trigger proinflammatory cascades in astrocytes and increased cytotoxicity. Together, these results provide insight into why obesity based on a HFD per se produces systemic alterations, affects the brain parenchyma and exacerbates cerebral ischemic damage. These findings complement our previous observations in which obesity induced endothelial inflammation associated with tau aggregation in control and ischemic rats [Citation16].
Research has shown that higher BMI (by Lee index) may be neutral or have a protective association with mortality in stroke patients, a phenomenon known as the ‘obesity paradox’ [Citation18,Citation19]. However, in this research, we found that obesity exacerbated severe stroke outcomes increasing the risk of mortality. In this study, there was a 42.84% percent of death after ischemia, the rest of animals (57.16%) suffered neurologic deterioration and deficits in motor skills compared to the control groups. However, at 6 h post-anaesthesia all animals presented a reduction in the motor and neurological performance but keeping the intrinsic difference between control and ischemic groups. The worsen response during the first hour post-ischemia are supported by the effect of half of all human stroke patients with manifested complications within 24 h of the stroke episode. Features of neurological deterioration include brain swelling, seizures, and death [Citation20]. The major factor that facilitates neurological deterioration is a delay in initiating reperfusion therapy or failure of the therapy to adequately reestablish reperfusion in the affected areas and/or the occurrence of reocclusion [Citation21]. Deficits in motor function affect mobility and activities such as reaching, picking up objects, and holding onto objects [Citation22,Citation23]. Compelling evidence in both animal and human studies has established that conditions that affect metabolism, such as obesity and insulin resistance, increase the risk of stroke [Citation24,Citation25]. These conditions may also affect recovery from stroke and worsen the outcome [Citation26]. It would be interesting in further studies to evaluate the intrinsic brain plasticity recovery after a long-term effect of HFD, knowing that the ischemia per se produces alteration on neurophysiological parameters predisposing to cognitive impairment [Citation27].
Morphological and functional changes in microglia are important in the pathophysiology of the brain [Citation28]. Brain ischemia leads to excessive astrocyte and microglial activation [Citation29,Citation30], increasing vessel remodeling and stiffness in response to obese comorbidities [Citation7,Citation28]. This was confirmed in the present study, which detected morphological changes such as enlarged soma and reduced glial processes in the amygdala and motor cortex. Although, hippocampus is an important area affected by ischemia, this affection was not particularly affected in this cohort, maybe by the intrinsic variability of the vascular network [Citation31]. Interestingly, in the motor cortex, either HFD or ischemia alone induced ameboid microglia, potentiating their solidity when combined with obese comorbidity after the ischemia event. It is known that activated microglia in response to ischemic brain release a higher quantity of proinflammatory cytokines, which is associated with neuronal death [Citation32]. The degree of microglial activation reveals the severity and detrimental effect of ischemic injury [Citation33,Citation34].
Similarly, astrocytes also play an important role in the maintenance of the CNS microenvironment and are key regulators of neuronal activity and behavior[Citation35]. Astrocyte reactivity occurs in response to inflammatory conditions and undergoes a series of morphological and functional adaptations known as astrogliosis [Citation36,Citation37]. The prevention of proinflammatory astrocytes is achieved through inhibition of the nuclear factor-kappa B (NF-κB) signaling pathway, which is involved in the pathophysiological response. For instance, Brambilla et al. (2005) demonstrated that inhibition of NF-κB activity in GFAP+ cells promotes functional recovery after spinal cord injury in mice, resulting in reduced glial scarring and increased locomotor activity [Citation38], while Douglass et al. (2017) demonstrated that inhibition of astrocyte NF-κB signalling in mice by deleting IκB kinase β from GFAP-expressing cells improves glucose tolerance and reduces obesity by promoting energy expenditure [Citation39]. Additionally, Robb et al. (2020) demonstrated the role of NF-κB signaling in the regulation of basal metabolism in astrocytes[Citation40]. In this study, the fluorescence intensity of NF-kβ increased in cells treated with EVs from endothelial cells HFD, indicating that astrocytes are sensitive to different signaling molecules carried in plasma in an obese state, likely supporting the concept of astrocytes working as buffers and metabolic regulators to prevent abrupt changes in their contact with neurons [Citation41,Citation42].
Therefore, astrogliosis and microgliosis in the motor cortex support the obtained results for the neurological score, and inclined plane performance worsened in response to the HFD. Additionally, these pathological hallmarks suggest emotional detriment, although this was not evaluated in this study, but this is in concordance with our previous findings in which HFD and ischemia altered emotional skills in rats [Citation26]. Similarly, obesity increases peripheral inflammation and disrupts the blood–brain barrier [Citation43]. Evidence from rodent studies suggests that obesity exacerbates inflammatory disruption of cerebral microvessels, worsening stroke outcome. This is experimentally observed as an increase in BBB permeability, increased incidence of hemorrhagic transformation and worsened cerebral edema. This increase in BBB permeability in obese mice is observed within 4 h of reperfusion, where it appears to be mediated by an increase in transcytotic endothelial vesicles [Citation44].
Under healthy conditions, the endothelium coordinates the formation of blood vessels and maintains vascular homeostasis and structure. However, in pathological conditions, such as atherosclerosis, metabolic changes impair endothelial cells in the brain vasculature [Citation45]. Endothelial dysfunction is generated by an imbalance in the production or bioavailability of endothelium-derived NO, generating a decreased vasodilator response and prothrombotic and endothelial proinflammation [Citation46]. During the inflammatory process induced by different risk factors, such as hypertension, oxidized LDL (oxLDL) and diabetes, there is an increase in the production of interleukin-1 (IL-1), interleukin-6 (IL-6), TNF-α and C-reactive protein (CRP), which induces the endothelial proinflammatory phenotype characterized by an increase in E-selectin, vascular cell adhesion molecule-1 (VCAM-1) and intercellular adhesion molecule 1, supporting the disruption [Citation47,Citation48]. These previous observations help explain our results, where plasma from HFD rats presenting with dyslipidemia produces endothelial disruption in vitro, accompanied by an increase in IL-1β and cPLA2 levels.
Extracellular vesicles are small membrane vesicles that carry important messengers, such as proteins, lipids, and mRNAs, and they are released by most cell types in response to different stimuli. The role of EV-mediated intercellular communication is necessary to maintain cellular homeostasis and physiological functions, whereas alterations in these processes could be an indicator of pathological states [Citation49]. One of the most important physiological EV functions is immune regulation; currently, some therapeutic approaches have been evaluated using these vesicles [Citation50]. Because obesity is characterized by a proinflammatory state and brain damage has been related to an increase in some proinflammatory cytokines, such as IL-1β, we tried to explain the pathology beginning with the endothelium as the first cells that are in contact with the periphery. Then, we hypothesized that endothelial activation produces a release of proinflammatory signals carried on EVs that affect neural cells beginning with astrocytes.
In our results, endothelial cell-derived EVs from cells exposed to plasma from obese rats released more extracellular vesicles than those exposed to plasma control rats, indicating that obesity causes systemic stimuli carried in EVs, producing endothelial dysfunction because endothelial cells are the first cells in contact between the circulation and the brain parenchyma. Several findings indicate that levels of circulating EVs are dynamic and modulated by changes in body weight, so obese patients exhibit higher (∼10-fold) levels of plasma EVs than normal healthy weight patients [Citation51–53]. However, it is not clear whether the increase in plasma EVs in obese patients is due to an increase in exosomes, microvesicles, or both. The increased plasma levels of EVs from obese patients are also seen in patients with excessive weight, a phenomenon that correlates with BMI, waist circumference, and fat tissue mass [Citation52]. Thus, an increased EV number in obesity is related to the metabolic state of platelets, endothelium, and leukocytes [Citation54].
Although we did not examine the cargo of endothelial EVs, we think it likely contains proinflammatory messengers that increase proinflammatory signals, such as NF-κB, in astrocytes. It has been shown that dendritic cells and macrophages secrete IL-1β, which is a cytokine that does not have the leader sequence needed for secretion by the classical pathway [Citation55]. In addition, IL-1β is the same cytokine that we observed to be increased in the plasma of obese animals and is associated with the brain microvasculature in our previous study [Citation16,Citation55]. However, deeper research on EV cargo and its effect on other neural cells is needed.
The capacity of EVs to regulate immune responses opens an opportunity to design pharmacological and biological treatments in neurological and neurodegenerative diseases. In addition, understanding complex diseases such as cerebral ischemia from a metabolic point of view is important to develop more specific treatments, such as leveraging the regulation of the immune response using EVs.
Conclusions
A high fructose diet produces obesity, which leads to an increase in poststroke neurological and motor deficiencies and increases glial reactivity after cerebral ischemia, primarily exacerbating microgliosis in the motor cortex. Obesity increased proinflammatory circulating cytokine levels in plasma, inducing a proinflammatory state in endothelial cells with major production of EVs. These endothelial EVs cause inflammation and cytotoxicity in astrocytes. Together, these results provide insight into why obesity exacerbates cerebral ischemic damage. Future studies should be developed for going deeper on the long-term effect of obesity worsening neurological dysfunction after stroke and its role as risk factor to develop problems on intrinsic plasticity such as cognitive impairment and dementia. Meantime, the scientific evidences are more robust, all the population should us to prevent obesity and associated disorders, improving the healthy habits and a very good compensation between fed, physical, intellectual and emotional activities.
Supplemental Material
Download JPEG Image (122.6 KB)
Acknowledgments
We thank the veterinarian MD Tania Marquez for her technical support at the vivarium and sample collection. We thank Juan Manuel Villar Vesga for his advice on obtaining and analyzing EV data. Additionally, we thank Norman Balcazar for his scientific advice with respect to the obesity model and metabolic interpretations.
Disclosure statement
No potential conflict of interest was reported by the author(s).
Additional information
Funding
Notes on contributors
P. A. Perez-Corredor
P. A. Perez-Corredor, a Biologist from Universidad Tecnológica y Pedagógica de Colombia, Tunja, Boyacá. She has completed Master in Biomedical science, Neuroscience from Corporación de Ciencias Básicas Biomédicas, University of Antioquia in Medellín, Colombia. Currently, she is working as a research assistant at the Massachusetts Eye and Ear Institute in Boston, USA.
P. Oluwatomilayo-Ojo
P. Oluwatomilayo-Ojo has completed B.Sc. in Anatomy; Master of Science, Anatomy; Ph.D. in Biochemistry and Neuroscience in University of Ilorin, Nigeria, Africa.
J. A. Gutierrez-Vargas
J. A. Gutierrez-Vargas has completed B.Sc. in University of Tolima, M.Sc. and Ph.D. in Biomedical Science, topic in Neuroscience from Corporación de Ciencias Básicas Biomédicas, University of Antioquia in Medellín, Colombia. She is an Associated professor at the Corporación Universitaria Remington.
G. P. Cardona-Gómez
G. P. Cardona-Gómez is a senior researcher, and full professor at the Faculty of Medicine, University of Antioquia. She has completed B.Sc. from University of Quindio, Armenia, Colombia; Ph.D. in Biological Science area Neurobiology from Cajal Institute, CSIC., Universidad Autónoma de Madrid. She is the Coordinator of Cellular and Molecular Neurobiology Area, at the Group of Neuroscience. University of Antioquia.
References
- Farooqui AA. High Calorie Diet and the Human Brain: Metabolic Consequences of Long-Term Consumption.; 2015. doi:10.1007/978-3-319-15254-7
- Anstey KJ, Cherbuin N, Budge M, Young J. Body mass index in midlife and late-life as a risk factor for dementia: a metaanalysis of prospective studies. Obes Rev. 2011 May;12(5):e426–37. doi:10.1111/j.1467-789X.2010.00825.x
- Pedditzi E, Peters R, Beckett N. The risk of overweight/obesity in mid-life and late life for the development of dementia: a systematic review and meta-analysis of longitudinal studies. Age Ageing. 2016 Jan;45(1):14-21. doi: 10.1093/ageing/afv151. Erratum in: Age Ageing. 2016 Sep;45(5):740.
- Heuschmann PU, Kircher J, Nowe T, Dittrich R, Reiner Z, Cifkova R, et al. Control of main risk factors after ischaemic stroke across Europe: data from the stroke-specific module of the EUROASPIRE III survey. 2015 Oct;22(10):1354–62. doi:10.1177/2047487314546825
- Haley MJ, Lawrence CB. Obesity and stroke: Can we translate from rodents to patients? J Cereb Blood Flow Metab. 2016 Dec;36(12):2007–21. doi: 10.1177/0271678X16670411
- Osmond JM, Mintz JD, Dalton B, Stepp DW. Obesity increases blood pressure, cerebral vascular remodeling, and severity of stroke in the Zucker rat. 2009 Feb; 53(2):381–6. doi:10.1161/HYPERTENSIONAHA.108.124149
- Deutsch C, Portik-Dobos V, Smith AD, Ergul A, Dorrance AM. Diet-induced obesity causes cerebral vessel remodeling and increases the damage caused by ischemic stroke. Microvasc Res. 2009;78(1):100–106. doi:10.1016/j.mvr.2009.04.004
- Terao S, Yilmaz G, Stokes KY, Ishikawa M, Kawase T, Neil Granger D. Inflammatory and injury responses to ischemic stroke in obese mice Stroke. 2008;39:943–50. doi:10.1161/STROKEAHA.107.494542
- Chan AML, Ng AMH, Mohd Yunus MH, et al. Recent developments in rodent models of high-fructose diet-induced metabolic syndrome: a systematic review. Nutrients. 2021;13(8):1–21. doi:10.3390/nu13082497
- Ogundele OM, Ajonijebu DC, Adeniyi PA, Alade OI, Balogun WG, Cobham AE, et al. Cerebrovascular changes in the rat brain in two models of ischemia. Pathophysiology. 2014 Sep;21(3):199–209. doi:10.1016/j.pathophys.2014.08.002
- Engelhardt B, Sorokin L. The blood-brain and the blood-cerebrospinal fluid barriers: function and dysfunction. Semin Immunopathol. 2009;31(4):497–511. doi:10.1007/s00281-009-0177-0
- Arraud N, Linares R, Tan S, Gounou C, Pasquet JM, Mornet S, et al. Extracellular vesicles from blood plasma: determination of their morphology, size, phenotype and concentration. J Thromb Haemost. 2014 May;12(5):614–27. doi:10.1111/jth.12554
- Ramirez SH, Andrews AM, Paul D, Pachter JS. Extracellular vesicles: mediators and biomarkers of pathology along CNS barriers. Fluids Barriers CNS. 2018 Jul 1;15(1):19. doi:10.1186/s12987-018-0104-7
- van Niel G, D'Angelo G, Raposo G. Shedding light on the cell biology of extracellular vesicles. Nat Rev Mol Cell Biol. 2018 Apr;19(4):213–28. doi:10.1038/nrm.2017.125
- Bond ST, Calkin AC, Drew BG. Adipose-derived extracellular vesicles: systemic messengers and metabolic regulators in health and disease. Front Physiol. 2022 Feb 23;13:837001. doi:10.3389/fphys.2022.837001
- Pérez-Corredor PA, Gutiérrez-Vargas JA, Ciro-Ramírez L, Balcazar N, Cardona-Gómez GP. High fructose diet-induced obesity worsens post-ischemic brain injury in the hippocampus of female rats. Nutr Neurosci. 2022 Jan;25(1):122–36. doi:10.1080/1028415X.2020.1724453
- Lehmann JS, Zhao A, Sun B, Jiang W, Ji S. Multiplex cytokine profiling of stimulated mouse splenocytes using a cytometric bead-based immunoassay platform. J Vis Exp. 2017 Nov 9;(129):56440. doi:10.3791/56440
- Vemmos K, Ntaios G, Spengos K, et al. Association between obesity and mortality after acute first-ever stroke: The obesity-stroke paradox. Stroke. 2011;42(1):30–36. doi:10.1161/STROKEAHA.110.593434
- Skolarus LE, Sanchez BN, Levine DA, Baek J, Kerber KA, Morgenstern LB, et al. Association of body mass index and mortality after acute ischemic stroke. Circ Cardiovasc Qual Outcomes. 2014 Jan;7(1):64–9. doi:10.1161/CIRCOUTCOMES.113.000129
- Weimar C, Mieck T, Buchthal J, Ehrenfeld CE, Schmid E, Diener HC. German stroke study collaboration. Neurologic worsening during the acute phase of ischemic stroke. Arch Neurol. 2005 Mar;62(3):393–7. doi:10.1001/archneur.62.3.393
- Young JA, Tolentino M. Stroke evaluation and treatment. Top Stroke Rehabil. 2009 Nov–Dec;16(6):389–410. doi:10.1310/tsr1606-389
- Bleyenheuft Y, Gordon AM. Precision grip in congenital and acquired hemiparesis: similarities in impairments and implications for neurorehabilitatio. Front Hum Neurosci. 2014 Jun 30;8:459. doi:10.3389/fnhum.2014.00459
- Hatem SM, Saussez G, Della Faille M, Prist V, Zhang X, Dispa D, et al. Rehabilitation of motor function after stroke: a multiple systematic review focused on techniques to stimulate upper extremity recovery. Front Hum Neurosci. 2016 Sep 13;10:442. doi:10.3389/fnhum.2016.00442
- Slyper AH, Rosenberg H, Kabra A, Weiss MJ, Blech B, Gensler S, et al. Early atherogenesis and visceral fat in obese adolescents. Int J Obes (Lond). 2014 Jul;38(7):954–8. doi:10.1038/ijo.2014.11
- Vazzana N, Ranalli P, Cuccurullo C, Davì G. Diabetes mellitus and thrombosis. Thromb Res. 2012 Mar;129(3):371–7. doi:10.1016/j.thromres.2011.11.052
- Patience Ojo O, Perez-Corredor PA, Gutierrez-Vargas JA, Busayo Akinola O, Cardona-Gómez GP. Lasting metabolic effect of a high-fructose diet on global cerebral ischemia. Nutr Neurosci. 2022 Jun;25(6):1159–72. doi:10.1080/1028415X.2020.1841482
- Gutiérrez-Vargas JA, Múnera A, Cardona-Gómez GP. CDK5 knockdown prevents hippocampal degeneration and cognitive dysfunction produced by cerebral ischemia. J Cereb Blood Flow Metab. 2015;35(12):1937–49. doi:10.1038/jcbfm.2015.150
- Salter MW, Stevens B. Microglia emerge as central players in brain disease. Nat Med. 2017 Sep 8;23(9):1018–27. doi:10.1038/nm.4397
- Park JH, Cho JH, Ahn JH, Choi SY, Lee TK, Lee JC, et al. Neuronal loss and gliosis in the rat striatum subjected to 15 and 30 minutes of middle cerebral artery occlusion. Metab Brain Dis. 2018 Jun;33(3):775–84. doi:10.1007/s11011-018-0192-8
- Lee TK, Kim H, Song M, Lee JC, Park JH, Ahn JH, et al. Time-course pattern of neuronal loss and gliosis in gerbil hippocampi following mild, severe, or lethal transient global cerebral ischemia. Neural Regen Res. 2019 Aug;14(8):1394–1403. doi:10.4103/1673-5374.253524
- Grivas I, Michaloudi H, Batzios C, et al. Vascular network of the rat hippocampus is not homogeneous along the septotemporal axis. Brain Res. 2003;971(2):245–9. doi:10.1016/S0006-8993(03)02475-2
- Han HS, Qiao Y, Karabiyikoglu M, Giffard RG, Yenari MA. Influence of mild hypothermia on inducible nitric oxide synthase expression and reactive nitrogen production in experimental stroke and inflammation. J Neurosci. 2002 May 15;22(10):3921–8. doi:10.1523/jneurosci.22-10-03921.2002
- Kato H, Kogure K, Liu XH, Araki T, Itoyama Y. Progressive expression of immunomolecules on activated microglia and invading leukocytes following focal cerebral ischemia in the rat. Brain Res. 1996 Sep 23;734(1-2):203–12. doi:10.1016/0006-8993(96)00636-1
- Yan BC, Park JH, Ahn JH, Kim IH, Lee JC, Yoo KY, et al. Effects of high-fat diet on neuronal damage, gliosis, inflammatory process and oxidative stress in the hippocampus induced by transient cerebral ischemia. Neurochem Res. 2014 Dec;39(12):2465–78. doi:10.1007/s11064-014-1450-8
- Liddelow SA, Guttenplan KA, Clarke LE, Bennett FC, Bohlen CJ, Schirmer L, et al. Neurotoxic reactive astrocytes are induced by activated microglia. Nature. 2017 Jan 26;541(7638):481–7. doi:10.1038/nature21029
- Sofroniew MV, Vinters HV. Astrocytes: biology and pathology. Acta Neuropathol. 2010 Jan;119(1):7–35. doi:10.1007/s00401-009-0619-8
- Zamanian JL, Xu L, Foo LC, Nouri N, Zhou L, Giffard RG, et al. Genomic analysis of reactive astrogliosis. J Neurosci. 2012 May 2;32(18):6391–410. doi:10.1523/JNEUROSCI.6221-11.2012
- Brambilla R, Bracchi-Ricard V, Hu WH, Frydel B, Bramwell A, Karmally S, et al. Inhibition of astroglial nuclear factor kappaB reduces inflammation and improves functional recovery after spinal cord injury. J Exp Med. 2005 Jul 4;202(1):145–56. doi:10.1084/jem.20041918
- Douglass JD, Dorfman MD, Fasnacht R, Shaffer LD, Thaler JP. Astrocyte IKKβ/NF-κB signaling is required for diet-induced obesity and hypothalamic inflammation. Mol Metab. 2017 Jan 28;6(4):366–73. doi:10.1016/j.molmet.2017.01.010
- Robb JL, Hammad NA, Weightman Potter PG, Chilton JK, Beall C, Ellacott KLJ. The metabolic response to inflammation in astrocytes is regulated by nuclear factor-kappa B signaling. Glia. 2020 Nov;68(11):2246–63.
- Li K, Li J, Zheng J, Qin S. Reactive astrocytes in neurodegenerative diseases. Aging Dis. 2019 Jun 1;10(3):664–75. doi:10.14336/AD.2018.0720
- Takano T, Oberheim NA, Cotrina ML, Nedergaard M. Astrocytes and ischemic injury. Stroke. 2009 Mar;40(3 Suppl):S8–12. doi:10.1161/STROKEAHA.108.533166
- Gao L, Jiang T, Guo J, Liu Y, Cui G, Gu L, et al. Inhibition of autophagy contributes to ischemic postconditioning-induced neuroprotection against focal cerebral ischemia in rats. PLoS One. 2012;7(9):e46092. doi:10.1371/journal.pone.0046092
- Haley MJ, Lawrence CB. The blood-brain barrier after stroke: structural studies and the role of transcytotic vesicles. J Cereb Blood Flow Metab. 2017 Feb;37(2):456–70. doi:10.1177/0271678X16629976
- Pircher A, Treps L, Bodrug N, Carmeliet P. Endothelial cell metabolism: A novel player in atherosclerosis? Basic principles and therapeutic opportunities. Atherosclerosis. 2016 Oct;253:247–57. doi:10.1016/j.atherosclerosis.2016.08.011
- Medina-Leyte DJ, Zepeda-García O, Domínguez-Pérez M, González-Garrido A, Villarreal-Molina T, Jacobo-Albavera L. Endothelial dysfunction, inflammation and coronary artery disease: potential biomarkers and promising therapeutical approaches. Int J Mol Sci. 2021 Apr 8;22(8):3850. doi:10.3390/ijms22083850
- Nafisa A, Gray SG, Cao Y, Wang T, Xu S, Wattoo FH, et al. Endothelial function and dysfunction: Impact of metformin. Pharmacol Ther. 2018 Dec;192:150–62. doi:10.1016/j.pharmthera.2018.07.007
- Silva IVG, de Figueiredo RC, Rios DRA. Effect of different classes of antihypertensive drugs on endothelial function and inflammation. Int J Mol Sci. 2019 Jul 14;20(14):3458. doi:10.3390/ijms20143458
- Garcia-Martinez I, Alen R, Rada P, Valverde AM. Insights into extracellular vesicles as biomarker of NAFLD pathogenesis. Front Med (Lausanne). 2020 Aug 11;7395. doi:10.3389/fmed.2020.00395
- Robbins PD, Morelli AE. Regulation of immune responses by extracellular vesicles. Nat Rev Immunol. 2014 Mar;14(3):195–208. doi:10.1038/nri3622
- Eguchi A, Lazic M, Armando AM, Phillips SA, Katebian R, Maraka S, et al. Circulating adipocyte-derived extracellular vesicles are novel markers of metabolic stress. J Mol Med (Berl). 2016 Nov;94(11):1241–53. doi:10.1007/s00109-016-1446-8
- Murakami T, Horigome H, Tanaka K, Nakata Y, Ohkawara K, Katayama Y, et al. Impact of weight reduction on production of platelet-derived microparticles and fibrinolytic parameters in obesity. Thromb Res. 2007;119(1):45–53. doi:10.1016/j.thromres.2005.12.013
- Stepanian A, Bourguignat L, Hennou S, Coupaye M, Hajage D, Salomon L, et al. Microparticle increase in severe obesity: not related to metabolic syndrome and unchanged after massive weight loss. Obesity (Silver Spring). 2013 Nov;21(11):2236–43. doi:10.1002/oby.20365
- Pardo F, Villalobos-Labra R, Sobrevia B, Toledo F, Sobrevia L. Extracellular vesicles in obesity and diabetes mellitus. Mol Aspects Med. 2018 Apr;60:81–91. doi:10.1016/j.mam.2017.11.010
- Qu Y, Franchi L, Nunez G, Dubyak GR. Nonclassical IL-1 beta secretion stimulated by P2X7 receptors is dependent on inflammasome activation and correlated with exosome release in murine macrophages. J Immunol. 2007 Aug 1;179(3):1913–25. doi:10.4049/jimmunol.179.3.1913