
 ?Mathematical formulae have been encoded as MathML and are displayed in this HTML version using MathJax in order to improve their display. Uncheck the box to turn MathJax off. This feature requires Javascript. Click on a formula to zoom.
ABSTRACT
To add to the engineer’s toolkit for the twenty-first century challenges, we demonstrate a novel systems model for understanding urban impacts. The model captures interdependencies between different interconnected systems (or sectors, e.g. recreational services or public healthcare) in cities, from the tangible (e.g. resources such as roads) to the more intangible (e.g. outcomes such as the sustainable economy). The model is hazard-agnostic in that it can be modified to capture the impacts of different shocks on tangible parts of the system and how these cascade through to more abstract and high-level city tasks and outcomes. This paper demonstrates three hypothetical scenarios (a flood, drought, and pandemic) and their impacts on a generic UK city. Using the network analysis, impacts can be tracked and interpreted to help prioritise requirements for resilience-building. We propose this new tool be taken up and tested by others working to address global challenges such as the Sustainable Development Goals and grappling with the interconnectedness of urban systems.
1. Introduction
Cities are the driver of regional, national and global economies and are tightly coupled systems on which the majority of the world’s population relies. Currently, around 55% of the world’s population lives in urban areas, and this is expected to increase to nearly 70% by 2050 (Gatzweiler et al. Citation2020). The high concentration of people, businesses and accommodation and the associated activities make them particularly vulnerable to systemic impacts arising from exposure to hazards, such as floods, droughts or a global pandemic. The interconnections between different urban functions (e.g. education, economy, healthcare, etc.) makes tracing direct impacts arising from such hazards, and subsequent indirect (or cascading) impacts complex across the system. This becomes even more challenging when these impacts may, over time, lead to more intangible effects on city outcomes, for example, socio-economic equity or a sustainable economy.
Climate change and urbanisation are intensifying environmental threats (e.g. Collet, Beevers, and Prudhomme Citation2017; Collet et al. Citation2018; Guerreiro et al. Citation2018). Climate change will intensify the hydrological extremes experienced across the globe with more frequent and intense floods and droughts in the future (Arnell et al. Citation2019 Lu, Carbone, and Grego Citation2019; Visser-Quinn et al. Citation2019). Alongside these increasing threats are other global hazards such as pandemics. Urbanisation concentrates people and assets in one place, making cities high-stakes areas for such hazards. Depending on a host of factors, including the state of infrastructure and the underlying susceptibility and vulnerability of the population, different impacts may arise. Indeed, some impacts may lead to others within the connected system based on this exposure. For example, if an electricity sub-station is knocked out during a flood, cascading impacts on a greater population will occur due to loss of power. During Hurricane Sandy in 2013, homes were without power for up to two weeks, and subsequent saltwater damage to critical control equipment (Zimmerman et al. Citation2019). Similarly, unintended impacts of interventions implemented to deal with exposure to one hazard may, over the long term, lead to susceptibility to other hazards. Managing largescale infrastructure for flooding (e.g. dams through managed drawdown) may increase vulnerability to future droughts. This was seen in California in 1997 when the Folsom reservoir was slow to refill the following flood drawdown, exacerbating the subsequent drought, and in Kerala (India) in 2018 (Ward et al. Citation2020). Systemic impacts arise from the interplay between hazards, the exposure and vulnerability of people, livelihoods and assets, and emergent connections within systems. Untangling such impacts across systems is essential if we are to increase future resilience (McClymont et al. Citation2020).
Existing approaches often limit the scope to a specific organisational interpretation of individual risks (silo thinking), whereas a network perspective can deliver holistic risk management (Berthod et al. Citation2017; Punzo et al. Citation2020). This is because systemic impacts cross-disciplinary and sectoral boundaries, causing unintended or cascading effects. Many ‘partial’ views of the system are needed (Burns and Vicente Citation2000; Brandt et al. Citation2013; Hall, Lazarus, and Swannack Citation2014; Bedinger et al. Citation2020) to gain a systemic view. Approaches to understanding interdependent networks can reveal critical interconnections and point towards interventions to build resilience (Clark-Ginsberg, Abolhassani, and Eahmati Citation2018). Systems approaches are also needed to capture key interdependencies across different scales explicitly. Such approaches are needed to map the complexities of cities from tangible resources and processes to intangible tasks and outcomes.
‘Traditional’ engineering alone is not enough to meet the future global challenges – a new engineer with a more diverse, interdisciplinary toolkit is needed. We present a proposed addition to the toolkit: a systems method that can be used to explore the impact of different challenges – such as climate change, hydrological extremes and infectious diseases – on resilient outcomes for cities. Such a tool is needed so new perspectives on tracking outcomes in the context of hazards can be explored. With these new approaches and insights, better decisions should emerge. Consequently, this paper aims to demonstrate how a new interdisciplinary urban systems tool could be used to explore the impacts of floods, droughts, and pandemic response in a generic city. The following sections show how hazards can be implemented in the tool, how changes can be tracked across the system, and how results can be interpreted.
The proposed tool is the Urban System Abstraction Hierarchy (USAH) (Bedinger et al. Citation2020; McClymont et al. Citation2022; Beevers et al. Citationin review) which has been developed by the authors over the last four years. This paper demonstrates the models' capability, and the subsequent analysis for the simulated hazards is presented via three questions:
Systemic impacts of different hazards: How do the different hazards impact different parts of the system?
The city system response: Which system components are most influential in maintaining system functioning during the three hazard scenarios?
Intangible exposure: Can cascading impacts be identified across the system?
The next section outlines the model and how the different hazard types can be inputted into the USAH using hypothetical scenarios. The results are presented and discussed concerning the three questions (Section 3), followed by conclusions and next steps (Section 4).
2. Methods
The development and testing of the USAH model are outlined below and comprehensively described in McClymont et al. (Citation2022). For this paper, the USAH model (as developed) is used to explore systemic and cascading hazards associated with different hazards. outlines the approach taken to create the template baseline model, how this has been modified for the hazard models, and how the results can be interpreted across scenarios by comparing to the baseline template. explains the hazard modification stage in more detail. Each part of the process is explained below.
Figure 1. Flow chart of the overall methodology (asee ).
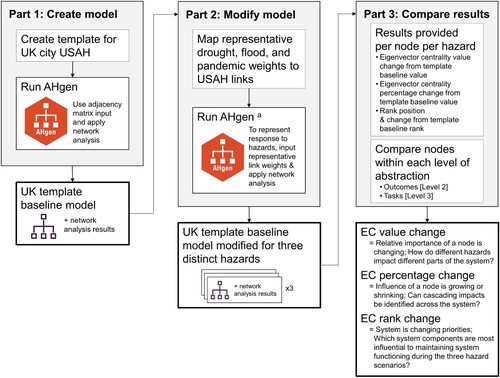
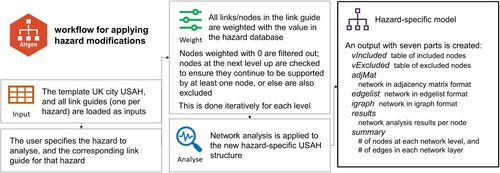
Figure 2. Workflow to apply specific hazards.
2.1. Part 1: create the urban system abstraction hierarchy (USAH) model
The USAH model encompasses the social, technical, and natural interdependencies within the urban environment into a single systems model (Bedinger et al. Citation2020; McClymont et al. Citation2022). The model is the first step in a socio-technical systems framework developed by Rasmussen (Citation1986) using the concept of abstraction in human factors (Newman R Citation1999). It is a hierarchical graph that connects physical objects at the bottom of the hierarchy to Functional Purposes at the top. Starting from the bottom: Physical objects (Level 5), Object-related processes (Level 4), Generalised functions (Level 3), Values and priority measures (Level 2) and Functional purposes (Level 1). Each level is connected through its functionality. Moving upward levels, the nodes are connected by asking ‘why the node exists’; moving downward levels, the nodes are connected by asking ‘how a node is afforded’. The USAH has been developed and validated with input from subject matter experts (McClymont et al. Citation2022) and embeds the 12 outcomes from the 100 Resilient Cities framework at Level 2 (Arup Citation2015) [e.g. a Sustainable economy or Effective provision of critical services]. The resulting USAH template (for a generic UK city) is a hierarchical network with 5 levels and can be modified for any hazard.
For a full description and a demonstration with examples of how links are constructed, see Bedinger et al. (Citation2020); for more detail on the development and overall validation of the USAH, see McClymont et al. (Citation2022).
2.1.1. USAH template
This paper uses the generic city USAH template, consisting of 5 levels, 483 nodes and 4483 links (see Bedinger et al. Citation2021 for the full dataset and code behind this paper). All links in the template are weighted as one, which represents full functionality. details the number of nodes in each level of the hierarchy, and details the number of links that connect each level. These nodes and links can be modified for any shock, and the number will change for different hazard scenarios. This methodology is outlined in and detailed in Section 2.2.
Table 1. The number of nodes at each level of the USAH.
Table 2. The number of links in each layer of the USAH.
2.2. Part 2: modifying for a hazard
To introduce a hazard into the USAH, a ‘link guide’ is created to outline which nodes and links have been impacted by the hazard, and thus must be modified in the model. All city Resources (Physical objects) that Provide employment in the baseline have been assigned to a UK Standard Industry Classification (SIC) category (Companies House Citation2018). For example, Eateries were assigned to the SIC category Accommodation and Food Service Activities. This helps with node categorisation when different hazards are inputted into the USAH. Depending on the hazard type, a node-based or link-based approach can be used.
A node-based approach focuses on identifying the exposed city Resources (Level 5 – Physical objects) and treating all links to Processes (Level 4 – Object-related processes) as affected. This approach suits spatially explicit hazards across urban areas, such as floods. The entry point for impacts on the system is the physical resource itself.If 6/10 Eateries have been flooded (i.e. are within the flood extent), all links to associated Processes would be weighted 0.4 (their ability to Act as an access point for food is affected as much as their ability to Act as community meeting space) to reflect a reduction in their functionality.
A link-based approach focuses on city Resources (Level 5 – Physical objects) and Processes (Level 4 – Object-related processes) and is determined on a case-by-case basis. The entry point for impacts on the system is the system design. If the Resource Eateries could only open for take-away service, Processes that are afforded by Eateries but relate to the building might remain fully functional (e.g. Act as access point for food), but other Processes could have a reduced weight or be removed completely (e.g. Act as a community meeting space). A change in link weight reflects a change in the capacity of a Resource node to afford a particular Process. This approach may suit a more ubiquitous hazard, such as a pandemic.
In this paper, three hypothetical scenarios are applied to demonstrate that the USAH is a comprehensive systems approach to impacts modelling and versatile for multiple hazards. The methodology for creating a link guide that represents each hazard type is outlined below, and illustrates the number of nodes and links impacted for each hazard scenario. and detail the overarching approach.
Table 3. The number of nodes and links impacted for each scenario.
2.3.1. Floods
To enter a flood hazard into the USAH, a proportional approach to node weighting is required (the linked guide can be found in Bedinger et al. Citation2021). Flood exposure would be introduced by counting the number of physical object types within a city and the number in the flood extent. The proportion of each Physical object remaining functional would correspond to the node weight. All edges from the flooded node would then be weighted equally (as the whole node has been exposed).
In this hypothetical scenario, the Environment Agency’s National Assessment of Flood Risk report (Environment Agency Citation2009) was used as a guide. A representative scenario in the report was reviewed to identify which Physical object nodes could be exposed to flooding. The SIC categories associated with these Physical objects were reviewed. For any SIC categories that contain ten or fewer Physical objects, and that did not include any of those Physical objects in the report, the authors selected one representative Physical object. For SIC categories that contain more than 10 Physical objects and that did not include any of those Physical objects in the report, the authors selected two representative Physical objects. To represent greenspace and residential areas, Parks and Residential properties were marked as affected.
Every link from the selected nodes was then weighted as 0.5 to represent 50% less capacity in the system than the baseline. In total, this corresponded to 37 exposed nodes with 635 degraded links. As all nodes remained functional to some extent, no nodes were removed completely from the USAH in this scenario.
2.3.2. Droughts
To enter a drought hazard into the USAH, a link-based or node-based approach to weighting can be taken, depending on the extent of the drought experienced. In this scenario, the impact of drought is experienced as water scarcity resulting in reduced functionality of different sectors. The level of detail available in the input data for the USAH can inform the approach taken. Outputs from other models (e.g. a detailed water balance model of a particular location) could be used to reflect exactly where (specific USAH links) and to what extent (adjusted link weights) drought is affecting the wider urban system. In a more grounded scenario, different link weights might apply to the link between Wastewater treatment works to Treat wastewater vs. the link between Power stations and Generate electricity vs. the link between Common green areas and Support nutrient cycles. These links may be affected to different extents at different drought durations, depending on the specific location and severity of the event modelled.
To demonstrate broadly in this simplified hypothetical scenario, a node-based approach was taken at the Object-related processes level. The drought impacts were assumed to be distributed equally across such links (the link guide can be found in Bedinger et al. Citation2021). In other words, Object-related processes were reviewed to assess which would be affected by water scarcity in any way. Then, all links downward to Physical objects were weighted equally as 0.5 to reflect 50% less functionality than in the baseline. 33 Object-related processes were affected, degrading 674 links.
2.3.3. Pandemics
To enter a pandemic hazard into the USAH, a link-based approach to weighting is required (the linked guide can be found in Bedinger et al. Citation2021). Pandemic exposure would focus on the sectors impacted by various policy restrictions (such as lockdown restrictions, restrictions on social gatherings, workplace closures, furlough schemes, etc.). Rather than modelling person-to-person disease transmission, the USAH tracks system-wide impacts on services. A detailed explanation of the methodology is explained in Beevers et al. (Citation2021); however, a simplified approach for a generic city is completed here.
In this hypothetical scenario, nodes that would be impacted by restrictions on gatherings, workplace closures, workplace restrictions, and school closures were selected. Links in this scenario are either functional (weight = 1) or not (weight = 0) based on whether a node was considered a key workplace, online, or closed. The exception to this was Schools that had to remain open for children of key workers and vulnerable children, so the links were set to a weight of 0.5. All links from Physical objects that afford the processes: (1) Act as a community meeting space, (2) Advise on community activities and (3) Facilitate cultural events were removed. This degraded 1257 edges. Seven Object-related processes that could no longer be fulfilled by the Physical objects so were removed from the USAH (Act as community meeting space, Advise on community activities, Construct buildings, Facilitate cultural events, Provide younger childcare, Screen media and Survey buildings).
2.3. Part 3: compare results
The USAH is an undirected, hierarchical graph representing a complex topology of nodes and links. Network metrics can be used to identify and navigate its highly interdependent parts, both in the baseline, and in scenarios representing other conditions e.g. a flood, drought or pandemic. Different network metrics exist and can be used (Morrison et al. Citation2022) to determine how the system responds to hazards.
Here the network metric [weighted] eigenvector centrality (EC) has been used to determine the response of the system to a shock. EC describes each node’s relative influence based upon the influence of its neighbours and explore the importance of a node within the USAH. For a graph with
vertices and
edges and
weights, the adjacency matrix
defines the weighting between nodes. The eigenvector centrality of a node
is then defined as
(1)
(1)
This can be rewritten in matrix form as the eigenvector equation:
(2)
(2) where
is the eigenvector of
. Then, by the Perron-Frobenius theorem, the eigenvector corresponding to the maximal eigenvalue,
, contains only positive values. This ensures that
is the normalised dominant eigenvector of
with every eigenvector centrality bounded by 1 for each node in the graph. EC provides a stable, continuous centrality measure, which is critical to ensure that system noise has little effect on the centrality result. This explores small permutations within link weightings (equivalent to variations in an adjacency matrix), which do not result in discontinuities, as seen in betweenness centrality.
For each scenario (or network), different conditions are reflected through link weightings and return results for each node. When exploring a single scenario, comparisons are made only between nodes within a level (e.g. Level 3 Generalised functions to other Generalised functions) rather than across the whole graph (e.g. Level 5 Physical objects to Level 3 Generalised functions) due to the imposed hierarchical nature of the USAH network, where certain levels are at a mathematical disadvantage for central connectivity. Where nodes experience within-level rank changes over time, this indicates underlying conditions have reprioritised parts of the system. Where a node’s EC has increased in absolute value, the node has become more important than in the baseline, and the percentage change in EC (positive or negative) shows the strength of that change compared to other nodes, i.e. whether a node has ‘grown’ or ‘shrunk’ in influence.
2.5. The three questions
The results are interpreted via three questions and corresponding result types:
Systemic impacts of different hazards: How do the different hazards impact different parts of the system? This is explored through the absolute change in EC value for each node in the three hazard scenarios. This result type indicates how much a node has experienced a change in influence from the baseline.
The city system response: Which system components are most influential in maintaining system functioning during the three hazard scenarios? This is explored through changes in rank (in order of EC value) within each USAH level. This exposes the elements of the system which become more (or less) influential during the hazard.
Intangible exposure: Can cascading impacts be identified across the system? This is explored through percentage change in EC value for nodes in city Tasks (Level 3) and Outcomes (Level 2). This result type indicates the extent to which a specific node has grown or shrunk in influence.
3. Results and discussion
3.1. Systemic impacts of different hazards (absolute value change in EC)
To explore the systemic impact of different hazards, the result type used is an absolute change in EC for each node in the three hazard scenarios. This result type indicates how much a node has experienced a change in influence since the baseline. It shows the distribution of change in influence within each level across the different scenarios. Floods, droughts and the pandemic response have varying spatial characteristics reflected in the amount of change to system functionality. Floods have a relatively smaller spatial distribution compared with droughts and pandemics. In this paper, the analysis has considered a recurrence interval of a similar frequency across the three hazards as far as possible (Environment Agency Citation2009; AON Benfield Citation2013). Using hazards of similar recurrence intervals, allows for a similar scale of hazard to be compared as far as possible.
As the method for applying a flood hazard to the USAH takes a proportional approach – i.e. no Physical objects have been completely removed – there is physical redundancy in the number of resource types located within the city. Floods are also a spatially-explicit hazard where impacts on specific Physical objects will likely vary on a case-by-case basis. Droughts have a larger spatial distribution than floods but the hypothetical scenarios outlined above affect roughly the same proportion of links between Physical objects and Object-related processes. The pandemic response may have a similarly large spatial distribution to droughts; however, in this case, a larger proportion of the system functionality has been adjusted due to the disruptive elements of the hazard response. Various unrelated sectors have been impacted by all three hazards. However, in the case of a flood, there are some clear, known and logical cascading impacts from individual resources to related processes. Importantly, the strength of the USAH approach is in its ability to capture the complexities of the system approach associated with both types of impact.
indicates the absolute changes to EC for each of the three hazards (where blue represents the pandemic scenario, red the drought, and green the flood). The negative absolute changes (points on the left of the zero line on the figure) indicate the intangible city Purposes, Outcomes, and Tasks that become less influential in the system during the hazard, while those on the right (positive change) indicate those which become more important during the shock. Using the absolute change in EC value, we can see the big picture impacts, which arise as the urban system experiences a shock. The varying spatial extents of the three hazards are reflected in the distribution of change for each hazard.
Figure 3. Absolute change in EC by hazard type across the intangible levels (Purposes – Level 1, Outcomes – Level 2 and Tasks – Level 3) of the USAH (blue represents the pandemic scenario, the red represents the drought scenario and the green represents the flood scenario). Negative changes (i.e. to the left of the graph) indicate Tasks and Outcomes the system is deprioritising, while a positive change (to the right of the graph) indicates Tasks and Outcomes that become more important.
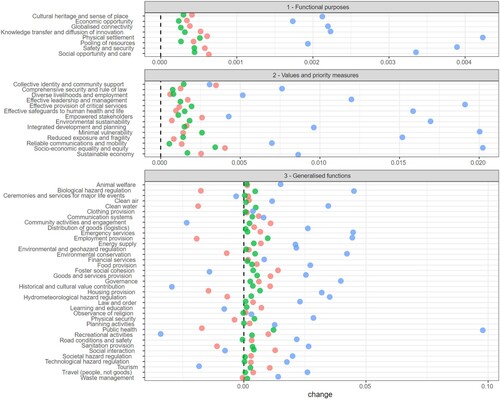
We can explore the impact of these shocks relative to each other across tangible and intangible levels of the city system. During the shock, the city Task Community activities and engagement becomes less influential during the pandemic scenario as a direct result of the ‘stay at home mandate’, however, due to indirect impacts during both a flood and a drought, we can see that this task becomes more important. Moving up to the city Outcomes level, we can see that all of these become more important during a shock, indicating the pressure on achieving these Outcomes during a shock. What is interesting in the context of the three hazards is the variability of impact across the city system as a whole, and this indicates that resilience planning needs to have a broad remit when planning potential measures, which should reach across all relevant sectors and considering various potential system shocks. The difference in the direction of the change can also give insights into the period over which interventions should be considered. Tasks and outcomes that have shrunk in influence should be considered in the immediate aftermath of the shock, with direct interventions to support recovery. Conversely, those that have grown in influence should be considered in longer-term resilience strategies for future planning. This analysis suggests that these are the system parts that are emphasised during a hazard shock.
3.2. The city system response (rank change in EC)
To identify the prioritisation of system components during the three hazard scenarios, the result type used is the rank change in EC value within each level. This exposes the elements of the system which become more (or less) influential during the hazard.
3.2.1. Relative change in the influence of city Tasks
In the generic template baseline, Public health and Employment provision have the greatest influence of all the city Tasks by order of magnitude. These Tasks remain the most influential to overall city functioning across all hazard scenarios, as seen in (a). The pandemic scenario has the most Tasks that are reprioritised in influence on the overall system (34), followed by droughts (24) and floods (11) ( a). lists the Tasks that have increased or decreased the most in terms of their relative influence on overall system functioning during the degraded system state for each hazard type compared to the baseline.
Figure 4. (a) Rank changes for Level 3 (city Tasks) for each hazard. (b). Rank changes for Level 2 (city Outcomes) for each hazard.
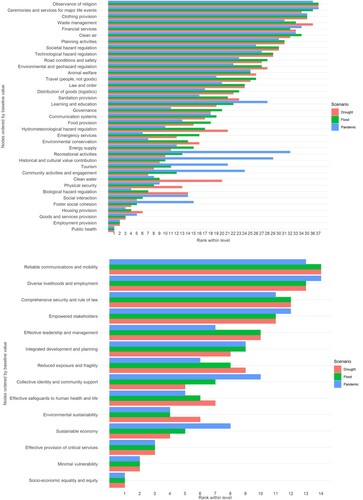
Table 4. City Tasks that have increased or decreased (most changed) relative influence (measured by EC) for each hazard scenario compared to the baseline.
The USAH can track changes in network prioritisation through rank changes in EC. It demonstrates what has been most changed from baseline conditions and indicates the nodes which have fallen in rank may require ‘reprioritisation’ during intervention discussions if a return to baseline conditions is desired. The USAH can be used to trace back through the hierarchy to understand how these are achieved and thus consider how recovery may usefully be designed.
These results ( and a) explore the changing system in more detail due to a hazard. What is interesting is that the USAH picks up the differences in system response due to different hazard types. During a drought, Clean water, Biological hazard regulation and Physical security have a lower priority than ‘normal’, as the reduction in available water means that the system has less ability to fulfil these Tasks. In contrast, during a pandemic, Recreational activities, Historical and cultural value contribution, and Community activities and engagement have been significantly impacted by the ‘stay at home’ mandate. Moving forward, resilience strategies developed to prepare for these hazards need to look to strengthen such Tasks. To look at what resilience strategies may be useful, the USAH can be used to trace back downwards through the network to explore which city Resources and Processes are delivering these Tasks and explore what alternatives to ‘normal operation’ are possible.
3.2.2. Relative change in the influence of city Outcomes
In the generic template baseline, Socio-economic equality and equity have the greatest influence of all the city Outcomes by order of magnitude and remain the most influential Outcome to overall city functioning across all hazard scenarios (b).
The pandemic scenario has the most Outcomes that are reprioritised in influence on the overall system (10), followed by droughts (5) and floods (2). lists the Outcomes which have increased or decreased the most in terms of their relative influence on overall system functioning during the degraded system state for each hazard type compared to the baseline.
Table 5. City Outcomes that have increased or decreased in relative influence (measured by EC) for each hazard scenario compared to the baseline.
These results ( and b) expose how the system behaves differently due to each hazard, demonstrating that different parts increase and decrease in overall influence during an event. The Outcomes that increase in influence during an event can be considered more important during the event and thus critical for future resilience planning. As with the city Tasks each hazard demonstrates different impacts. During a pandemic, Effective leadership and management becomes more influential, while during a drought, Collective identity and community support is highlighted, and for floods, this is Environmental sustainability. These Outcomes can be traced back through the system to the tangible levels to design suitable resilience strategies that can strengthen the delivery of these Outcomes in the longer term.
3.3. Intangible exposure (percentage change in EC)
To explore intangible exposure across the system, the result type used is the percentage change in EC for nodes in city Tasks (Level 3) and Outcomes (Level 2). This result type indicates how a specific node has grown or shrunk in influence. The results can show how tangible exposure of the city Resources and Processes cascades to expose intangible Tasks and Outcomes.
These results capture nuance within the system, highlighting those Tasks or Outcomes which have increased or decreased ( and ) most due to their starting system influence (as measured by EC), and as above, this should be linked to the period over which interventions should be considered. The Tasks which have shrunk in influence () must be considered in the immediate aftermath of the shock, with direct interventions to support recovery. Conversely, those that have grown in influence should be considered in longer-term resilience strategies for future planning. This analysis suggests that these are the system parts emphasised during a hazard shock. As with each test before this one, all three hazards show a different response, highlighting different system parts. This demonstrates the importance of considering a broad range of hazards with a systems approach within any resilience planning, to recognise the sometimes neglected interdependencies across a system.
Table 6. City Tasks that have grown or shrunk in terms of influence (measured by EC) for each hazard scenario compared to the baseline.
Table 7. City Outcomes that have grown in terms of influence (measured by EC) for each hazard scenario compared to the baseline.
4. A way forward
This paper has demonstrated a new type of model which allows the exploration of interconnected impacts across the urban system. The model is an imposed hierarchical network, which allows tangible objects within a system (e.g. city Resources) to be connected to the more intangible city Outcomes that they afford (for example, a Sustainable economy). The model combines and connects different sectoral functions across the city system (e.g. health, transport and education).
This demonstrated that network metrics could be used to understand how the system reacts to different hazards in a handful of hypothetical scenarios. The paper demonstrates that the model is ‘hazard agnostic’ and different large-scale shocks can be examined comparably, to understand how the system responds and how the system reprioritises different functions. The functions highlighted by the USAH can be shortlisted and considered to strengthen specific supporting components of city resilience by tracing down from the city Outcome or Task which has become degraded or overloaded to the tangible processes and resources which deliver them. This kind of exploration supports going beyond economic stimulus to ensure a holistic recovery towards desired city Outcomes, recognising the importance of, and interdependence between, society, governance and leadership, health, infrastructure and the environment. This suggests the USAH is a tool that can capture a diverse set of future challenges, and develop holistic solutions, for comprehensive future resilience plans. To support this, two open-source software packages – OSMtidy (Visser-Quinn and Bedinger Citation2021b) and AHgen (Visser-Quinn and Bedinger Citation2021a) – have already been developed to apply the generic and hypothetical analysis here, to more specific cities and hazards.
The development of the mathematical approach can also take us much further. Currently, the approach uses only one network metric to explore the changing influence of nodes within the system. A wealth of network metrics exist (Rodrigues Citation2019), which can be used to explore different system properties. Other metrics, such as betweenness centrality (White and Borgatti Citation1994), can provide additional insights and more in-depth analysis. This work is possible; however, it requires mathematical care and must recognise the importance of employing a numerically stable metric (Segarra and Ribeiro Citation2016) when analysing a weighted, hierarchical graph such as the USAH. Stable betweenness centrality (as just one example) can identify changes at the tangible levels to further explore resilience concepts such as redundancy and diversity (see Elmqvist et al. Citation2003; Beevers et al. Citation2021). This could help understand how a system absorbs a shock and how adaptation could be supported in the future (McClymont et al., Citationin review). Big data related to critical infrastructure, cutting-edge network analysis, and capabilities approach analysis from the social sciences could push this envelope beyond what civil engineers may currently think is feasible or even possible for this type of systems analysis. This is fertile ground with many opportunities for engineers, and the interdisciplinary teams required to tackle civil engineering systems issues, to develop this research further and address imminent global challenges.
Disclosure statement
No potential conflict of interest was reported by the author(s).
Additional information
Funding
References
- AON Benfield. 2013. Pandemic Perspective. Accessed October 31, 2021. http://thoughtleadership.aon.com/Documents/201311_pandemic_perspective.pdf last.
- Arnell, N. W., J. Lowe, D. Bernie, R. Nicholls, S. Brown, A. Challinor, and T. Osborn. 2019. “The Global and Regional Impacts of Climate Change Under Representative Concentration Pathway Forcings and Shared Socioeconomic Pathway Socioeconomic Scenarios.” Environmental Research Letters 14: 084046. doi:10.1088/1748-9326/ab35a6.
- Arup. City Resilience Framework. 2015. Accessed November 6, 2021. https://www.rockefellerfoundation.org/report/city-resilience-framework/ last.
- Bedinger, M., L. Beevers, G. Walker, A. Visser-Quinn, and K. McClymont. 2020. “Urban Systems: Mapping Interdependencies and Outcomes to Support Systems Thinking.” Earth's Future, 8 (3). doi:10.1029/2019EF001389.
- Bedinger, M., K. McClymont, A. Visser-Quinn, L. Beevers, G. Aitken, C. Songchon, and D. Morrison. 2021. “USAH-outputs v2.0, Edinburgh.” Scotland, doi:10.5281/zenodo.5702814.
- Beevers, L., M. Bedinger, K. McClymont, D. Morrison, G. Aitken, and A. Visser-Quinn. in review. “Systemic COVID-19 Impacts in Cities: A Hierarchical Network Model for Urban Response and Recovery NPJ Urban Sustainability.”
- Beevers, L., M. Bedinger, K. McClymont, and A. Visser-Quinn. 2021. “Resilience in Complex Catchment Systems.” Water 13: 541. doi:10.3390/w13040541.
- Berthod, O., M. Grothe-Hammer, G. Müller-Seitz, J. Raab, and J. Sydow. 2017. “From High-Reliability Organizations to High-Reliability Networks: The Dynamics of Network Governance in the Face of Emergency.” Journal of Public Administration Research and Theory 27 (2): 352–371. doi:10.1093/jopart/muw050.
- Brandt, P., A. Ernst, F. Gralla, C. Luederitz, D. J. Lang, J. Newig, et al. 2013. “A Review of Transdisciplinary Research in Sustainability Science.” Ecological Economics 92: 1–15. doi:10.1016/j.ecolecon.2013.04.008.
- Burns, C. M., and K. J. Vicente. 2000. “A Participant-Observer Study of Ergonomics in Engineering Design: How Constraints Drive Design Process.” Applied Ergonomics 31: 73–82. doi:10.1016/S0003-6870(99)00017-4.
- Clark-Ginsberg, A., L. Abolhassani, and A. Eahmati. 2018. “Comparing Networked and Linear Risk Assessments: From Theory to Evidence.” International Journal of Disaster Risk Reduction 30 (Part B): 216–224. doi:10.1016/j.ijdrr.2018.04.031.
- Collet, L., L. Beevers, and C. Prudhomme. 2017. “Assessing the Impact of Climate Change and Extreme Value Uncertainty to Extreme Flows Across Great Britain.” Water 9 (2): 103. doi:10.3390/w9020103.
- Collet, L., G. Formetta, S. Harrigan, C. Prudhomme, and L. Beevers. 2018. “Future hot-Spots for Hydro-Hazards in Great Britain: A Probabilistic Assessment.” Hydrology and Earth System Sciences 22 (10): 5387–5401.
- Companies House. Standard Industrial Classification (SIC) Code List. 2018. https://www.gov.uk/government/publications/standard-industrial-classification-of-economic-activities-sic.
- Elmqvist, T., C. Folke, M. Nyström, G. Peterson, J. Bengtsson, et al. 2003. “Response Diversity, Ecosystem Change, and Resilience.” Frontiers in Ecology and the Environment 1 (9): 488–494. doi:10.1890/1540-9295(2003)001[0488:RDECAR]2.0.CO;2.
- Environment Agency. 2009. Flooding in England: a National Assessment of Flood Risk. Accessed November 6, 2021. Available online: https://assets.publishing.service.gov.uk/government/uploads/system/uploads/attachment_data/file/292928/geho0609bqds-e-e.pdf.
- Gatzweiler, F., B. Fu, C. Rozenblat, H.-J. J. Su, I. Luginaah, and J. Corburn. 2020. “COVID-19 Reveals the Systemic Nature of Urban Health Globally.” Cities & Health, doi:10.1080/23748834.2020.1763761.
- Guerreiro, S. G., R. J. Dawson, C. Kilsby, E. Lewis, and A. Ford. 2018. “Future Heat-Waves, Droughts and Floods in 571 European Cities.” Environmental Research Letters 13: 034009. doi:10.1088/1748-9326/aaaad3.
- Hall, D. M., E. D. Lazarus, and T. M. Swannack. 2014. “Strategies for Communicating Systems Models.” Environmental Modelling & Software 55: 70–76. doi:10.1016/j.envsoft.2014.01.007.
- Lu, J., G. J. Carbone, and J. M. Grego. 2019. “Uncertainty and Hotspots in 21st Century Projections of Agricultural Drought from CMIP5 Models.” Scientific Reports 9: 4922. doi:10.1038/s41598-019-41196-z.
- McClymont, K., M. Bedinger, L. Beevers, A. Visser-Quinn, and G. H. Walker. 2022. “Understanding Urban Resilience with the Urban Systems Abstraction Hierarchy (USAH).” Sustainable Cities and Society, 80: 103729. doi:10.1016/j.scs.2022.103729.
- McClymont, K., M. Bedinger, L. Beevers, A. Visser-Quinn, and G. Walker. In review. “From Theory to Practice: Applying Resilience to Urban Flooding with the Urban Systems Abstraction Hierarchy (USAH).” Sustainable Cities and Society.
- McClymont, K., D. Morrison, L. Beevers, and E. Carmen. 2020. “Flood Resilience: A Systematic Review.” Journal of Environmental Planning and Management 63 (7): 1151–1176. doi:10.1080/09640568.2019.1641474.
- Morrison, D., M. Bedinger, L. Beevers, and K. Mcclymont. 2022 Accepted. “Exploring the Raison d’etre Behind Metric Selection in Network Analysis: A Systematic Review.” Applied Network Science.
- Newman, R. A. 1999. “Abstraction in Human Factors.” International Journal of Cognitive Ergonomics 3 (3): 223–233. doi:10.1207/s15327566ijce0303_4.
- Punzo, G., A. Tewari, E. Butans, M. Vasile, A. Purvis, M. Mayfield, and L. Varga. 2020. “Engineering Resilient Complex Systems: The Necessary Shift Toward Complexity Science.” IEEE Systems Journal 14 (3): 3865–3874. doi:10.1109/JSYST.2019.2958829.
- Rasmussen, J. 1986. Information Processing and Human-Machine-Interaction - An Approach to Cognitive Engineering. Amsterdam: North Holland.
- Rodrigues, F. A. 2019. “Network Centrality: An Introduction.” In A Mathematical Modeling Approach from Nonlinear Dynamics to Complex Systems. Nonlinear Systems and Complexity, vol 22, edited by E. Macau. Cham: Springer. https://doi.org/10.1007/978-3-319-78512-7_10.
- Segarra, S., and A. Ribeiro. 2016. “Stability and Continuity of Centrality Measures in Weighted Graphs.” IEEE Transactions on Signal Processing 64 (3): 543–555. doi:10.1109/TSP.2015.2486740.
- Visser-Quinn, A., and M. Bedinger. 2021a. AHgen V0.0.1, Edinburgh, Scotland. https://doi.org/10.5281/zenodo.3975548.
- Visser-Quinn, A., and M. Bedinger. 2021b. OSMtidy V0.0.5, Edinburgh, Scotland. https://doi.org/10.5281/zenodo.4549249.
- Visser-Quinn, A., L. Beevers, L. Collet, G. Formetta, K. Smith, N. Wanders, S. Thober, M. Pan, and R. Kumar. 2019. “Spatio-temporal Analysis of Compound Hydro-Hazard Extremes Across the UK.” Advances in Water Resources, 130: 77–90. doi:10.1016/j.advwatres.2019.05.019.
- Ward, P. J., M. C. de Ruiter, J. Mård, K. Schröter, A. Van Loon, T. Veldkamp, N. von Uexkull, et al. 2020. “The Need to Integrate Flood and Drought Disaster Risk Reduction Strategies.” Water Security 11: 100070. doi:10.1016/j.wasec.2020.100070.
- White, D. R., and S. P. Borgatti. 1994. “Betweenness Centrality Measures for Directed Graphs.” Social Networks 16 (4): 335–346. doi:10.1016/0378-8733(94)90015-9.
- Zimmerman, R., S. Foster, J. E. González, K. Jacob, H. Kunreuther, E. P. Petkova, and E. Tollerson. 2019. “New York City Panel on Climate Change 2019 Report Chapter 7: Resilience Strategies for Critical Infrastructures and Their Interdependencies.” Annals of the New York Academy of Sciences 1439 (1): 174–229. doi:10.1111/nyas.14010.