
 ?Mathematical formulae have been encoded as MathML and are displayed in this HTML version using MathJax in order to improve their display. Uncheck the box to turn MathJax off. This feature requires Javascript. Click on a formula to zoom.
ABSTRACT
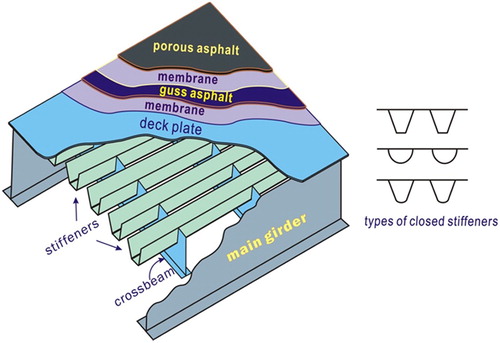
The orthotropic steel deck bridges (OSDBs) in the Netherlands consists mostly of multilayer system: top porous asphalt layer, guss asphalt layer, steel deck and two membrane layers. The five-point bending (5PB) beam test is the standard device in France for characterization of fatigue response of asphalt concrete surfacings used on orthotropic steel deck bridges. In this paper, an analytical solution for the 5PB beam test setup is presented first. In order to better understand the influence of geometrical, mechanical and structural parameters on the performance of the typical multilayer surfacing system of OSDBs, the 5PB test specimens with five structural layers have been investigated. The parametric study is performed at the numerical platform CAPA-3D that was developed at the Section of Structural Mechanics of TU Delft. The influences of the thickness of the asphalt layers and the mechanical properties of both top and bottom membrane layers are studied. The sensitivities of those influence factors are evaluated by the examination of the maximum tensile stress at the top surface of the porous asphalt layers and the strain distributions through the entire thickness of the specimen at two cross-sections.
1. Introduction
Orthotropic steel deck bridges (OSDBs) are widely used in most of the major long-span bridges around the world. The lightweight and flexibility make OSDBs bridges a prior cost-effective solution for cases where a high degree of pre-fabrication or rapid erection is required (Gurney Citation1992), in seismic zones, for movable bridges, long-span bridges and for rehabilitation to reduce bridge weight (Mangus and Sun Citation1999).
In the Netherlands, an asphaltic surfacing structure for orthotropic steel bridge decks mostly consists of multi-structural layers. The upper layer consists of porous asphalt (PA) because of reasons related to noise reduction. For the lower layer, a choice between mastic asphalt (MA), or guss asphalt (GA), can be made. Mostly, various membrane layers are involved, functioning as a bonding layer, isolation layer as well as an adhesion layer, .
Figure 1. Schematic the basic layout of an OSDB with multi-layer asphalt surfacing in the Netherlands.
The asphalt surfacing structure for OSDBs is complicated and yet not properly solved the technical problem. The high flexibility and large local deformations, wind and earthquake forces, temperatures and other natural factors make the problem even more complicated. Due to the special characteristics of OSDBs, fatigue cracking, rutting, delaminating and other damage types are commonly reported and these severely destroy the performance of steel bridges (Liu et al. Citation2008, Liu et al. Citation2010, Medani et al. Citation2010). Obviously, it is difficult to solve the problem of asphalt surfacing structures for OSDBs with a simple or traditional method. Research on the mechanical and structural design of the surfacing systems of OSDBs is urgent.
In the last three decades, several problems were reported in relation to asphaltic surfacing materials on OSDBs such as rutting, cracking, loss of bond between the surfacing material and the steel plate. A better understanding of the response of the multilayer surfacings, as well as FE modelling of their behaviour, is required in order to improve the current design method so as to prolong the service life of the surfacings on OSDBs.
The five-point bending (5PB) beam test was developed in France by the Laboratoire Central des Ponts et Chaussées (LCPC) in the 1970s (Houel et al. Citation2009). It was meant and it is still utilised by the industry as a laboratory scale test to enable investigation of the overall fatigue resistance of surfacing systems on OSDBs. The 5PB beam test is listed as a French standard and has been used in several studies (Hameau et al. Citation1981, Houel et al. Citation2009, Pouget et al. Citation2010).
The 5PB beam test is quite helpful for the design of the surfacing systems on OSDBs. Due to the flexibility of the steel structure, the asphalt surfacing materials are subjected to quite high levels of strain under traffic loads as compared to asphalt pavements on normal roads. It was shown that the results obtained from the 5PB beam tests and in situ observations on real steel decks are quite consistent (Houel and Arnaud Citation2008, Freitas Citation2012).
In this paper, an analytical solution for a single layer 5PB test setup is presented. The model allows the expedient evaluation of the influence of various geometric and material parameters on the response of a 5PB beam. The predictions of the analyses were validated by means of laboratory tests on the 5PB beam specimens. In order to better understand the influence of the various geometrical, mechanical and structural parameters on the performance of a multilayer 5PB beam test, non-linear finite element analyses have been performed with CAPA-3D (Scarpas Citation2004). The goal of this study is to develop efficient numerical and analytical techniques for optimisation of the multilayer system composed of asphaltic mixes, top and bottom membranes as well as the interfaces with proper mechanical properties. The influences of two asphaltic surfacing materials, two membranes and four interface layers are quantified systematically. The non-linear material models and the material properties are derived and utilised to characterise the mechanical behaviour of the asphaltic surfacing materials. In the end to come up with guidance for engineers who are involved with deck-pavement designs.
2. Composite action of the 5PB beam test and surfacing structure on OSDBs
When a dual wheel load is applied onto a steel deck surfacing, a typical deformation results as shown in . Transversal tensile deformations are observed at upper locations in the middle of the dual wheel load as well as the lower parts of the surfacing layers under the wheel load.
Figure 2. Schematic show of a dual wheel load on OSDB and 5PB beam test.
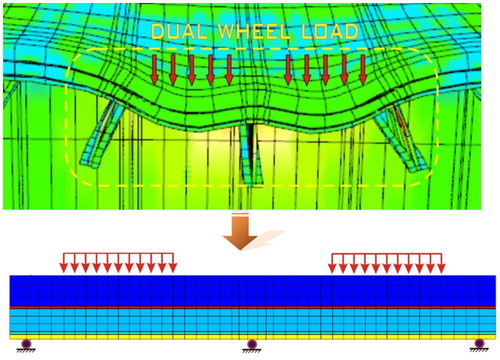
The 5PB beam test is a laboratory scale test that allows the investigation of the fatigue resistance of surfacing layers on OSDBs. The geometry of the test is meant to replicate the action of the deck stiffeners, . During a 5PB beam tests, high stress concentrations occur in the vicinity of the middle support of the test specimen and in the middle of the spans on either side. Hameau et al. (Citation1981) have confirmed that the most severe load case for the surfacing layers of OSDB is when they are subjected to negative moments.
Composite beam bending has been studied by several researchers in the past. Most of the solutions are based on the assumption that the steel and the asphalt (concrete) layers have the same radius of curvature and plane cross-sections (Metcalf Citation1967, Reches and Johnson Citation1976). Rao and Ghosh (Citation1979) developed a theory of a multi-layer elastic beam followed by Cullimore et al. (Citation1983) using Airy stress functions. None of these considered the thickness of the bonding layers (membrane layers). In other words, the membrane layer together with its upper and bottom adhesion interfaces was regarded to be a bonding layer with no thickness, .
Figure 3. Simplification of a membrane layer.
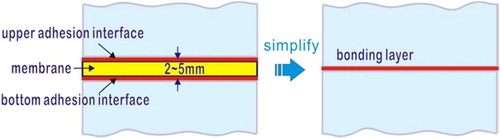
There are several drawbacks with this simplification:
The in-plane stiffness of the membrane materials is neglected;
The visco-elastic effects of the membrane are not taken into account;
The bonding properties of the upper and bottom adhesion interface may be different.
As shown in , a typical surfacing system of OSDB in the Netherlands consists of five material layers. The two membrane layers have to be taken into consideration. In order to demonstrate the sensitivity of the bonding effects on the response of the composite beam, analytical solutions for the beam with two extreme layer bonding conditions are presented in the following subsections.
2.1. Perfectly bonded composite beam section
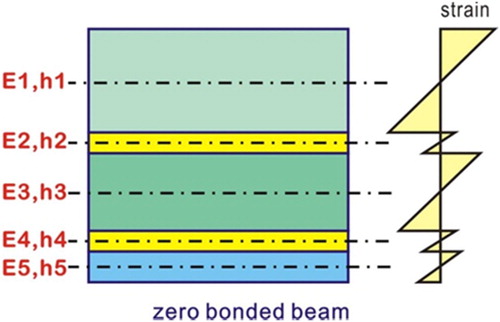
In the case of a perfectly bonded beam, by assuming that all materials are elastic with moduli E1–E5 and thicknesses h1–h5, respectively, the strain distribution corresponding to hypotheses of beam pure bending action is shown in .
Figure 4. Strain distribution in the case of a perfectly bonded beam.
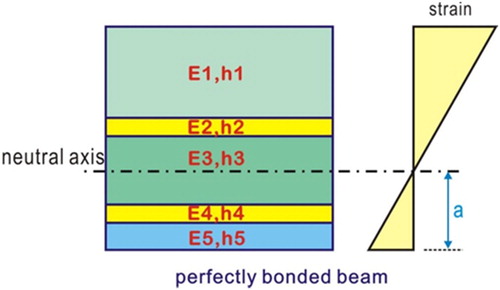
According to the classical laminated beam theory, the distance from the neutral axis to the bottom of the beam is calculated as:
By substituting h1=40 mm, h2=3.5 mm, h3=30 mm, h4=3.5 mm, h5=10 mm, E1=3000 MPa, E2=100 MPa, E3=5000 MPa, E4=100 MPa, E5=210,000 MPa into the expression above, the distance from the neutral axis to the bottom of the beam a = 10.866 mm is obtained. The equivalent stiffness of this perfectly bonded beam can be calculated via:in which the width of the beam = 1 mm.
The maximum strain on the top of the specimen is:
2.2 Non-bounded composite beam section
For the case of a non-bonded composite beam, the strain distribution is shown in . The slope of the strain distributions in those material layers is equal. The strain distribution shown in is also based on the beam pure bending hypotheses.
Figure 5. Strain distribution in the case of a non- bonded beam.
The bending moment applied on one material layer i isin which Mtotal is the total bending moment applied on the composite beam, Mi is the bending moment attributed onto the ith material layer. By assuming the same material properties as in the previous case, the equivalent stiffness of the beam is (width of the beam b = 1 mm)
which is only 3.65% of the perfectly bonded case.
The maximum strain on the top of the specimen is:which is 6.29 times of the maximum strain of the perfectly bonded case.
2.3. Analytical solution of a single layer of the 5PB beam test
In order to understand the bending moment distribution of the 5PB beam structure, in this section, an analytical solution for a single layer 5PB test is presented. The mechanical model used for carrying out the analytical study is shown in .
Figure 6. Schematic of a single layer 5PB beam test.
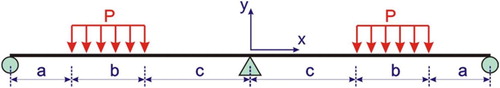
shows the single layer beam model, where x and y are the coordinate axes. The beam is symmetric with each span length equals to a + b+c. The two distributed loads have length b. The edge of the loading area has distance a to the end of the beam and distance c to the middle support. This is a statically indeterminate structure. As explained in Appendix B, by using the force method, the moment distribution function along the beam can be expressed by:(1)
(1) in which:
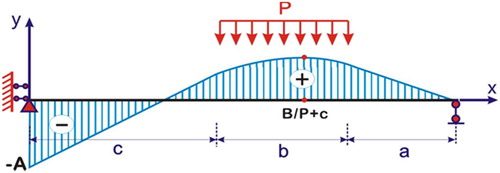
Because of symmetry, the analytical bending moment distribution is plotted only on half of the two-span beam in . It can be observed that the maximum negative bending moment is located at the centre support (x = 0) and the maximum positive bending moment is located at . The longitudinal strain (strain x) distribution can be computed on the basis of Eq.(1) by using the section moment of inertia of the beam.
Figure 7. Bending moment distribution along the half of the beam span.
In order to verify the analytical solution in EquationEq. (1(1)
(1) ), a metal plate with a = 45 mm, b = 130 mm and c = 95 mm and a distributed load P = 0.707 MPa was tested by using the 5PB test setup. Two strain gauges were used. One was placed in the middle of the beam span and another one was at the top surface of the beam above the middle support. The material elasticity properties of the beam were elastic modulus E = 210 GPa and Poisson’s ratio
=0.2.
In addition, an FE simulation of the single layer 5PB beam was performed by means of CAPA-3D, .
Figure 8. FEM of a single layer steel deck under 5PB beam test conditions.
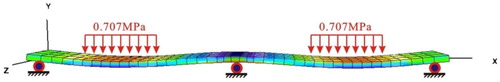
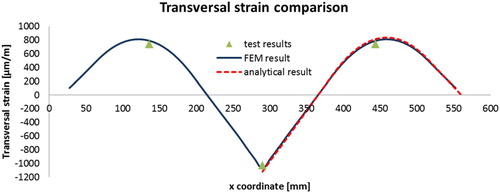
It can be observed that excellent agreement among the analytical, the experimental and the numerical solutions for the strains distribution along the x-axis of the beam can be obtained, .
Figure 9. Verification of analytical solution of a single layer 5PB beam test.
2.4. Non-linear finite element analyses of a multi-layer of the 5PB beam test
In this section, three-dimensional finite element simulations were performed by means of the CAPA-3D FE system. The goal of the analyses was the identification of the influences of the geometry and the material parameters of the surfacing materials on the response of a 5PB beam test.
2.4.1. Finite element mesh of the 5PB beam test
The finite element mesh of 5PB beam specimen consists of 20-noded brick (solid) elements that were utilised for modelling the porous asphalt (PA) layer, the Guss asphalt (GA) layer, the upper membrane (UM) layer, the bottom membrane (BM) layers and the steel deck plate, . For the simulation of the adhesion between the membrane layers to the adjacent materials, the adhesive contact interface elements developed in (Liu et al. Citation2010, Li Citation2015) was utilised.
Figure 10. Schematic of geometry and loading conditions of 5PB specimen.
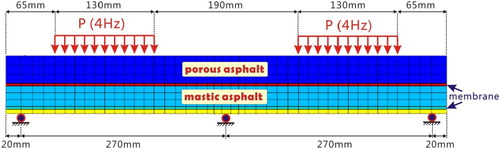
The geometry of the mesh is shown in . The specimen was 580 mm in length and 100 mm in width. The side supports were located at a distance of 270 mm from the central support. A total of 1677 elements were utilised for the simulations. In order to study the sensitivity of the layer thickness effect on the mechanical response of the specimen, the thicknesses of PA, GA, TM, BM and the steel deck were varied in the numerical examples.
The pressure load applied on each shoe is 0.707 MPa. This load pressure corresponds to 9.2 kN on each shoe (0.707 MPa×130 mm×100 mm), which means a total of 18.4 kN applied on the sample. If the same pressure load of 0.707 MPa is applied on a wheel print type B (double tyre 220 mm by 320 mm), it corresponds with 100 kN wheel load which is a typical truck load utilised in the Netherlands.
2.4.2. Material models and parameters
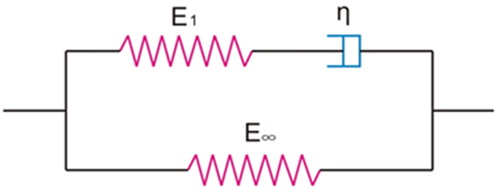
In order to simulate the surfacing layer response properly, a viscoelastic Zener model is utilised for the finite element studies. The reason for choosing the viscoelastic Zener model for this finite element is because its constitutive relation is simple and the model parameter can be easily determined by the conventional experimental tests, i.e. creep test or relaxation test. shows the mechanical analog of this viscoelastic Zener model. The model consists of two parallel components. One is purely elastic with modulus E∞ and the other is viscoelastic consisting of spring with modulus E1 and a damper with viscosity coefficient η in series. In the 5PB beam simulations, five membrane products namely A1, A2, B, C1 and C2 were chosen for the investigations. The Zener model parameters for the five membrane products are listed in . Based on the experimental work done by Muraya (Citation2007) and Medani (Citation2006), a set of Zener model parameters for porous asphalt and Guss asphalt at and
are indicated in . The elasticity parameters of the steel plate are E = 210 GPa and
.
Table 1. Properties of the five membrane products at +10°C and −5°C.
Table 2. Zener model parameters for porous asphalt and Guss asphalt (10°C and −5°C).
From , it can be seen that the model consists of two parallel components. One is a pure elastic component with modulus E∞ and the other is a viscoelastic component, which consists of a spring with modulus E1 and a damper with viscosity coefficient η in series.
Figure 11. Schematic diagram of the Zener model.
The total stress applied via the Zener model can be decomposed as:
(2)
(2) in which
is the stress in the viscoelastic component and
is the stress in the elastic component.
Since the two components are in parallel, the same strain is assigned:(3)
(3) By consider the damper and spring in series, the strain in the viscoelastic component is additive, hence the following relations can be obtained
(4)
(4)
(5)
(5) Also, it holds
(6)
(6)
(7)
(7) Substituting Eq.(6) and (7) into EquationEq. (5
(5)
(5) ) gives:
(8)
(8)
Replacing in terms of
and
by using EquationEq. (4
(4)
(4) ) results in:
(9)
(9) or
(10)
(10)
The solution for the strain in the damper can be obtained as.(11)
(11) At time t = 0, εdamper = 0, results to C = 0, hence
(12)
(12)
(13)
(13) Therefore
(14)
(14)
It was indicated in Liu et al. (Citation2010) as well as in Li (Citation2015) that the adhesive and contact behaviour of the membrane to the surrounding substrate can be modelled by the adhesive contact interface element. A strain energy release rate G and a characteristic opening length are the two main controlling parameters to describe the adhesive zone constitutive model. According to the MAT test results (Liu et al. Citation2013, Tzimiris Citation2017), for all the membranes involved in this research project, the strain energy release rate G values are in the range of 1–5 N/mm, and the characteristic opening length
values are in the range of 1–4 mm. In the following parametric investigation examples, if not explicitly stated otherwise, the parameters for modelling the adhesive behaviour are chosen as: G = 3.0 N/mm,
=2.0 mm, which represents the moderate bonding condition for most situations.
2.4.3. Laboratory verification of the 5PB beam FE model
The 5PB beam FE simulations were verified by means of laboratory 5PB beam tests. For full results of experimental and numerical characterisation of the 5PB beam tests, several papers were available by authors (Liu et al. Citation2013, Li Citation2015, Liu et al. Citation2016, Tzimiris Citation2017). The 5PB specimen is consisting of a 10 mm-thick steel plate, a 2–4 mm-thick bottom membrane, a 30 mm Guss asphalt (GA) layer, a 4.7–4.8 mm thick top membrane and 40 mm thick porous asphalt (PA) layer, see .
Figure 12. Test specimen geometry and composition.
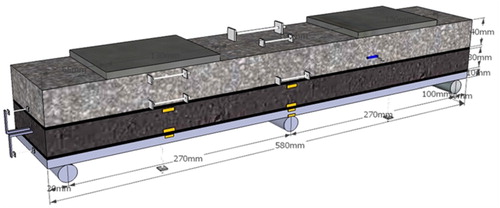
Nine strain gauges have been glued on each specimen. Two different displacement sensors of the LVDT are positioned on the upper face of the porous asphalt layers above the centre support, see . Shear displacements between PA and GA and between GA and steel are measured by two LVDTs.
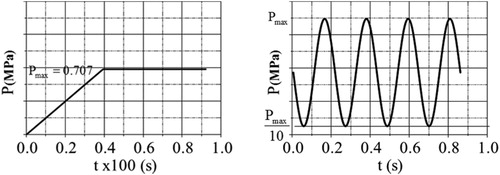
Both static and fatigue loading tests were performed under two temperatures levels (−5°C and +10°C), , until a maximum total load of 18.1 kN was reached corresponding to load pressure of 0.707 MPa on each shoe. The ramp time to maximum load is 40 s. For the fatigue tests, a sinusoidal compression load P ranging between and
at a frequency of 4 Hz was applied.
Figure 13. Static and dynamic loading schemes.
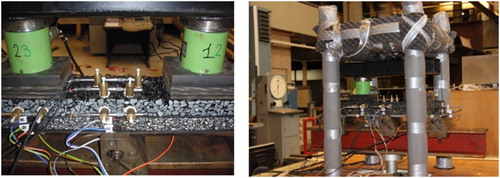
The strains recorded by the strain gauges during the static test can be compared with the strain predictions from the FE simulations but also can give an indication about the integral response of the beam layers. An overall view of the test set up is shown in .
Figure 14. Five-point bending test set up.
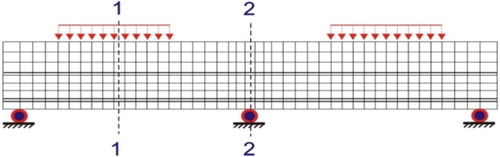
indicates the two cross sections where the strains have been recorded and compared to the FE solutions.
Figure 15. Two strain output sections of 5PB test mesh.
The FE simulations of the 5PBT specimen that is manufactured by membrane product B is presented here to verify the FE model. The interface bonding properties for membrane B are listed in . and show the comparisons of transversal strains recorded during the static tests along with the thickness of the tested beam. It can be observed that the numerical predictions show good agreement with the experimental results. It can be seen that all tested beams produce higher strain values at 10°C rather than at −5°C. The influence of the temperature on the strain of the steel deck plate is not significant. The maximum tensile strain at section 2–2 is generated at the top face of PA and the maximum compressive strain at section 1–1 is generated also on the top face of PA but it is closer to the loading plate.
Figure 16. Transversal strains at section 1–1 (membrane B, 10 oC and −5 oC)
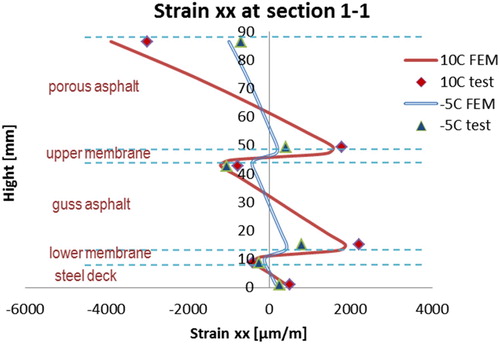
Figure 17. Transversal strains at section 2–2 (membrane B, 10 oC and −5 oC).
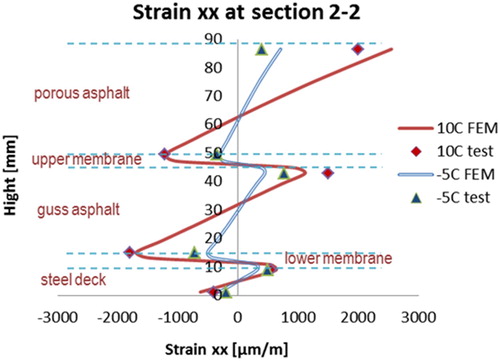
It can be concluded that the material models that were verified by the MAT test in (Liu et al. Citation2013) and (Tzimiris Citation2017) are capable to characterise the integral response of the multilayer surfacing system in the 5PB beam test. The numerical results indicate that, once the appropriate material parameters are available, the FE model shows a good comparison with the observed behaviour of the tests.
3. Numerical parametric study of the 5PB beam test
In this section, FE analyses were performed to better understand the composite behaviour of the multilayer surfacing system in the 5PB beam test. Five cases were investigated to identify the influences of the following factors:
the thickness of the porous asphalt layer;
the thickness of the Guss asphalt layer;
the thickness of the steel deck plate;
stiffness of the upper and bottom membrane layers;
bonding conditions between the membrane and its adjacent material layers.
The transversal strain distribution at two cross-sections of the structure, , were output. All parametric analyses were performed at 10°C. All material properties can be found in the previous section.
3.1. Effect of the thicknesses of porous asphalt
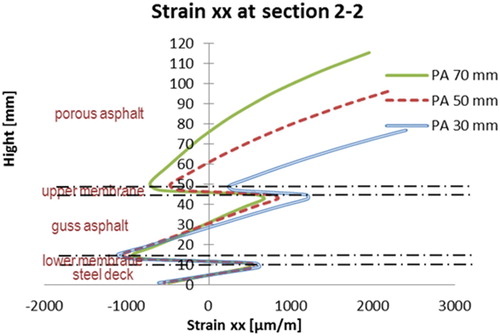
The following simulations were performed by varying the thickness of the PA layer from 30 to 70 mm. The transversal strain (strain xx) at sections 1–1 and 2–2 are shown in and .
Figure 18. Strains at section 1–1 (PA thickness varies).
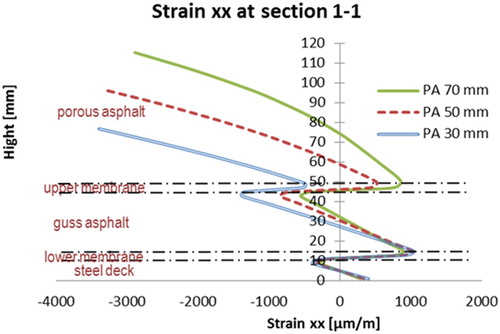
Figure 19. Strains at section 2–2 (PA thickness varies).
The following observations can be made with respect to the results shown in the above figures.
The distribution of the
strains follows more or less the same pattern in the 5PB beam for the three different thicknesses of PA. By varying the thickness of the PA layer, the strain distributions both in PA and GA are effected. The strains on the steel deck plate appear not to be affected significantly.
The maximum tensile strains in the two structural layers (PA & GA) are reduced by an increase in the thickness of PA.
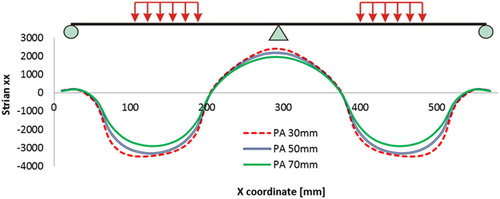
The distributions of strains on top of the PA layer are plotted in . It can be seen that, as the thickness of the PA layer increases both, the tensile strains on top of the middle support and the compression strains under the load are reduced. The strains next to the loading area are not affected.
Figure 20. Strains distribution along the top of PA layer.
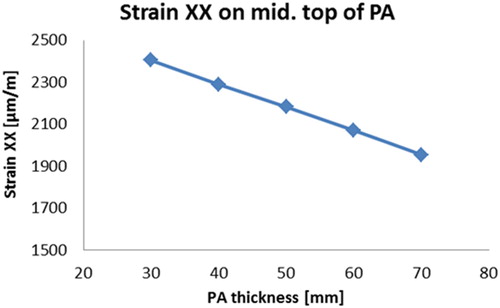
shows the maximum tensile strains above the middle support at the top of PA versus the PA thickness. The maximum tensile strains are responsible for longitudinal surface crack development and hence they are an important indicator to predict the surfacing layer performance on the steel deck.
Figure 21. Maximum strains on top of PA.
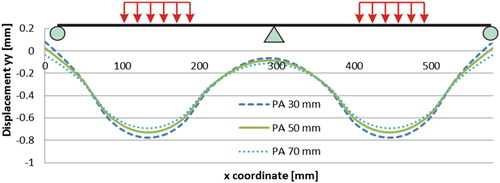
shows the corresponding beam deflection curves. It can be observed that the 20 mm thicker PA layer reduces the maximum deflection of the 5PB specimen by 6%.
Figure 22. Vertical deformation on top of PA (PA thickness varies).
3.2. Effect of the thicknesses of Guss asphalt
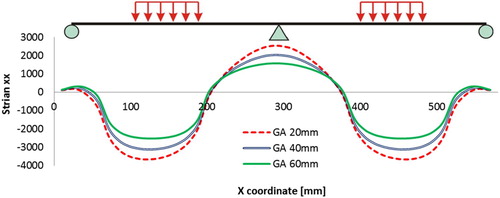
Simulations were performed by varying the thickness of the GA layer from 20 to 60 mm. The transversal strain (strain xx) at sections 1–1 and 2–2 are shown in and .
Figure 23. Strains at section 1–1 (GA thickness varies).
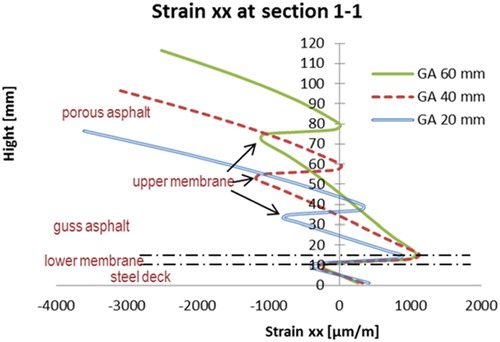
Figure 24. Strains at section 2–2 (GA thickness varies).
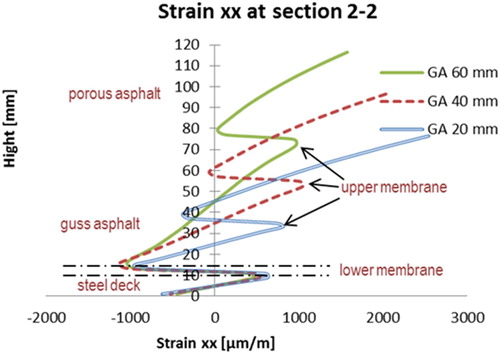
The following observations can be made with respect to the results shown in the above figures.
The distribution of the longitudinal strain
Both maximum tensile and compressive strains values in the GA layer are more or less the same. While the maximum tensile strain in the PA layer is reduced significantly by increasing the GA thickness.
The distributions of strains on top of the PA layer are plotted in by varying the thickness of the GA layer. It is obvious that a thicker GA layer may reduce both tensile and compression strains in the PA layers, and this effect is more obvious than that of the PA layer. This is mainly because the GA layer is stronger than the PA layer.
Figure 25. Transversal strain on top of the PA layer (GA thickness varies).
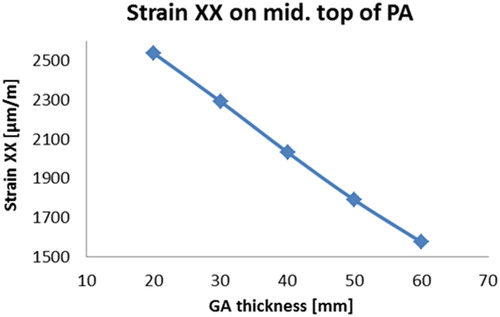
shows the maximum tensile strain above the middle support on the top of PA versus the GA thickness. The maximum tensile strains are responsible for longitudinal surface crack development and hence they are an important indicator to predict the surfacing layer performance on the steel deck.
Figure 26. Maximum tensile transversal strain on top of PA (GA thickness varies).
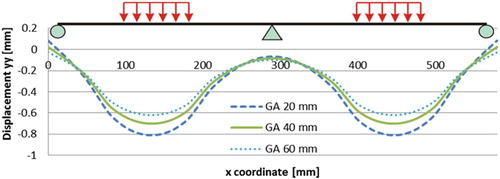
shows the deflection curves on top of the porous asphalt layer when the GA thicknesses are 20, 40 and 60 mm respectively. The effect of the GA thickness is more obvious than that of the PA thickness, which could be explained by higher stiffness of the GA layer than that of PA. A 20 mm thicker the GA layer would reduce the maximum deflection of the 5PB beam specimen by 14%.
Figure 27. Vertical deformations on top of PA (GA thickness varies).
3.3. Effect of the thickness of the steel deck
In the following, simulations were performed by varying the thickness of the steel deck layer from 10 to 18 mm. The transverse strain (strain xx) at sections 1–1 and 2–2 are shown in and .
Figure 28. Strains at section 1–1 (Steel deck thickness varies).
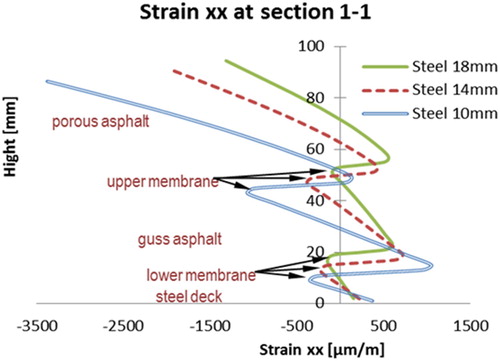
Figure 29. Strains at section 2–2 (Steel deck thickness varies).
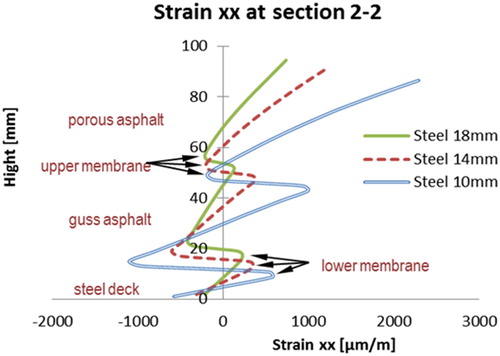
The following observations can be made with respect to the results shown in the above figures.
Both the tensile and compression strains in the PA layer could be significantly reduced by increasing the steel deck thickness.
A thicker steel deck could also reduce the strains in the GA layer significantly.
The shear strains in both membrane layers are reduced by thicker steel deck plates.
The distributions of strains on top of the PA layer are plotted in . It can be observed that a thicker steel deck plate can significantly reduce both tensile and compression strains in the PA layers, and the effect of thickening the steel deck plate is more obvious than the effect of thickening a PA or GA layer.
Figure 30. strains on top of PA layer (steel deck thickness varies).
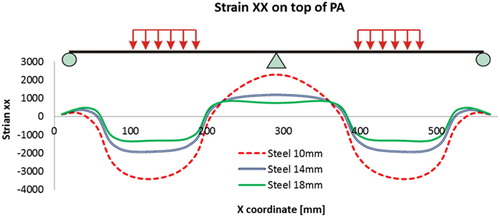
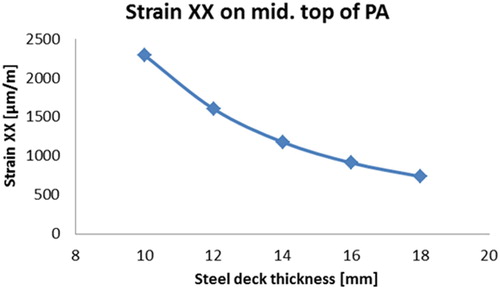
shows the maximum tensile strains above the middle support at the top of PA versus the steel deck thickness. It is observed that a 2 mm thicker steel deck layer can reduce the maximum tensile strain on top of the PA layer by 25%. The reducing tendency of the maximum tensile stain on top of the PA layer with respect to the thickness of the steel deck is close to an exponential relationship rather than a linear one.
Figure 31. Maximum tensile strain on top of PA (steel deck thickness varies).
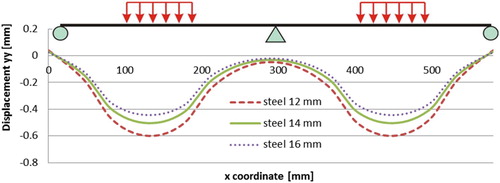
shows the corresponding beam deflection curves. A 2 mm thicker steel deck layer would reduce the maximum deflection of the 5PB beam specimen by 30%. Apparently, in order to prolong the service life of the surfacing system on OSDB, the development of innovation methods of increasing the stiffness of the steel deck becomes very important and necessary.
Figure 32. Vertical deformation on top of PA (Steel deck thickness varies).
3.4. Effect of the stiffness of the upper membrane layer
In this subsection, the sensitivity of the surfacing system response to the stiffness of the upper layer membrane is investigated. The membrane material properties listed in are considered to be a standard set. By varying Young’s modulus of the upper layer membrane in , the effects of the stiffness of the upper membrane layer in the 5PB beam test are investigated. The influence of the upper layer membrane stiffness to the transversal strain distributions at two sections are presented in and . The distributions of longitudinal strain on top of the porous asphalt layer with different upper membranes stiffness are plotted in . The effects of the upper membrane layer stiffness on the maximum tensile strain on the top of the PA layer are plotted in .
Figure 33. Strains at section 1–1 with the different upper membrane stiffness.
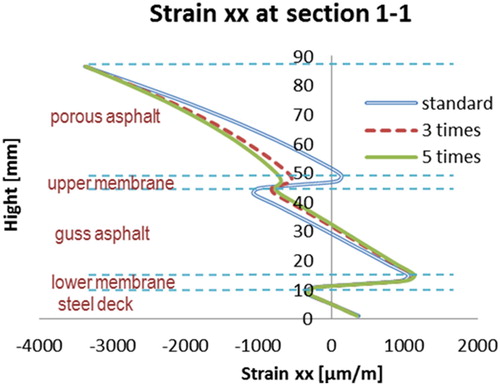
Figure 34. Strains at section 2–2 with the different upper membrane stiffness.
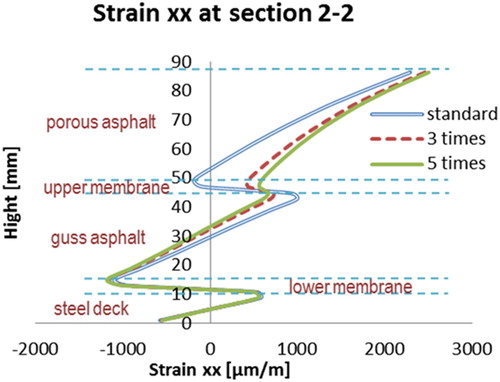
Figure 35. Strains on top of PA layer with the different upper membrane stiffness.
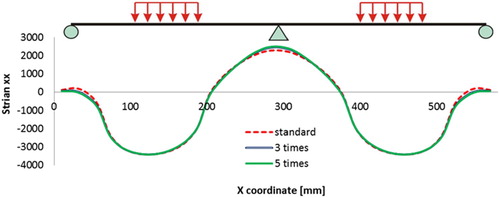
Figure 36. The maximum tensile strain on the top of PA versus the upper membrane stiffness.
The following observations can be drawn from –:
A stiffer upper membrane layer improves the composite beam action of the surfacing structure. The stiffness of the membrane layer can influence the strain distributions through the depth of the surfacing layers, especially in the PA layer adjacent to the membrane.
Although a stiffer membrane layer could improve the composite behaviour of the surfacing system, it does not reduce the maximum tensile and compression strains of the PA layer significantly.
No obvious influence on the maximum tensile strain on the steel deck plate by the upper membrane layer stiffness.
The plots in show the surface deflection of the top PA layer with the different upper membrane stiffness. It can be observed that the effects of the upper membrane stiffness on the surface deflection of the 5PB beam are not significant when the membrane stiffness is increased to a certain limit.
Figure 37. Deflection curves on top of a surfacing layer with different upper membrane stiffness.
3.5. Effect of the stiffness of the bottom membrane layer
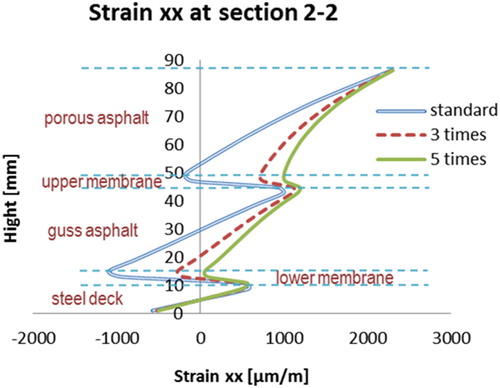
Similarly, the influence of the different stiffness of the bottom membrane layer on the behaviour of surfacing structure is studied. The transversal strain distributions in the 5PB beam at the two studied sections are presented in and . The distribution of transversal strain on the top of the PA layer is plotted in . The maximum tensile strains on the top of the surfacing structure are plotted in .
Figure 38. Strains at section 1–1 with the different bottom membrane stiffness.
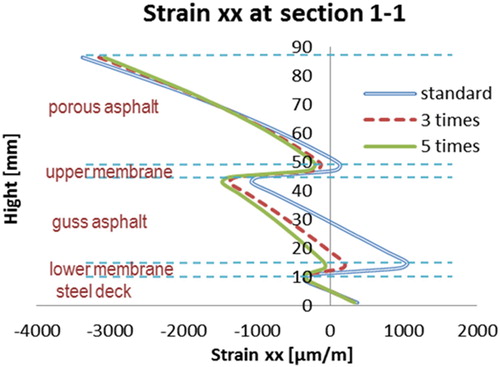
Figure 39. Strains at section 2–2 with the different bottom membrane stiffness.
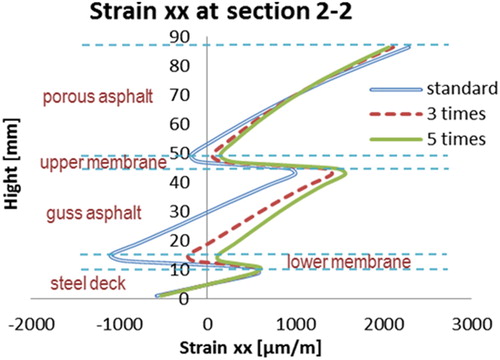
Figure 40. Strains on top of PA layer with the different upper membrane stiffness.
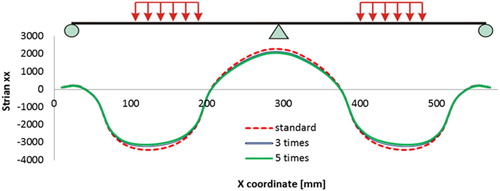
Figure 41. The maximum tensile strain on top of PA versus the bottom membrane stiffness.
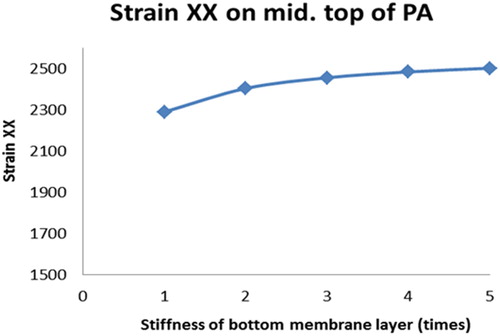
The following observations can be drawn from –:
A stiffer bottom membrane layer improves the composite beam action of the surfacing structure. The stiffness of the bottom membrane layer can influence the strain distributions through the depth of the surfacing layers, especially in the GA layer adjacent to the membrane.
Although a stiffer membrane layer could improve the composite behaviour of the surfacing system, it does not reduce the maximum tensile or compression strains of the PA layer significantly. The strain distribution of the GA layer is influenced significantly by the bottom membrane stiffness.
No obvious influence on the maximum tensile strain on the steel deck plate by the bottom membrane layer stiffness.
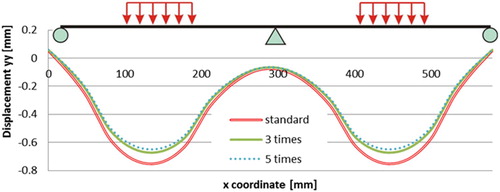
The plots in show the surface deflection of the top PA layer with the different bottom membrane stiffness. By comparing it with the plots in , it can be observed that the influence of the bottom membrane stiffness to the surface deflection of the 5PB beam is slightly greater than that of the upper membrane layer. However, by comparing to the other surface layers, the contributions of the membrane layer stiffness to reduce the surface deflection of the 5PB beam are still limited.
Figure 42. Deflection curves on top of the surfacing layer with the different upper membrane stiffness.
3.6. Effect of the stiffness of the upper and the bottom membrane layers
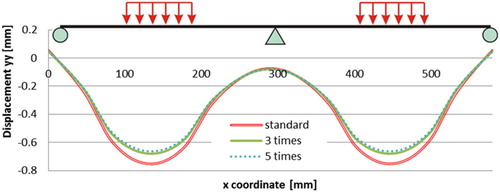
Relaxation tests have been used to determine the Zener model parameters to simulate the viscoelastic response of the membrane layer. The model parameters are listed in . The parameters at are regarded as the standard set of parameters for both the top and bottom membranes. For comparison purposes, simulations are done by differing the membrane parameters 0.5, 3 and 5 times as large as the standard set.
The stiffness of the two membrane layers plays quite an important role in combining different surfacing material layers together as a whole. Assume that the stiffness of the membranes is comparable with that of the PA or GA layers, and those layers are properly bonded together, the multilayer surfacing structure could be regarded as a composite beam. While when the layers of the membrane are quite soft or the bond condition is too week, all those material layers would behave separately. This phenomenon is demonstrated by the strain distributions at sections 1-1 and 2-2, and .
Figure 43. strains at section 1–1 (both membrane stiffness varies).
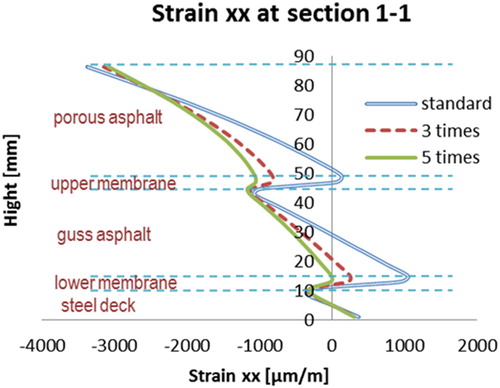
Figure 44. strains at section 2–2 (both membrane stiffness varies).
On the basis of the results shown in the figures above, the following remarks can be made.
Stiffer membranes allow better composite behaviour of the surfacing structure. The higher stiffness of the membranes (closer to the stiffness of PA or GA), the closer the mechanical behaviour is to the linear elastic theory.
There are less effects on the tensile strain on the top of the PA layer when the stiffness of membranes is increased.
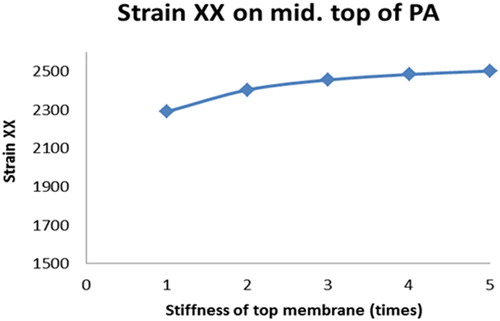
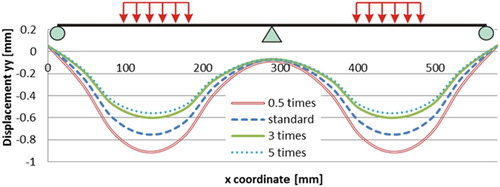
and illustrate that stiffer membrane layers could not reduce the maximum tensile strain on top of the PA layer. shows the deflection curves on top of the PA layer. The sensibility of the membrane stiffness on the whole surfacing structure is quite significant at low stiffness values and becomes less sensitive when the stiffness comes to a considerable high level.
Figure 45. strains on top of PA layer (both membrane stiffness differs).
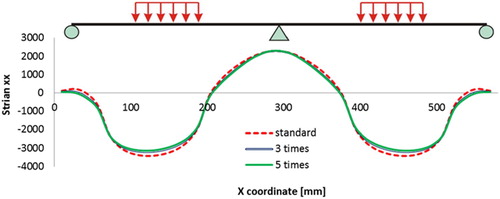
Figure 46. Maximum tensile strain on top of PA (both membrane stiffness varies).
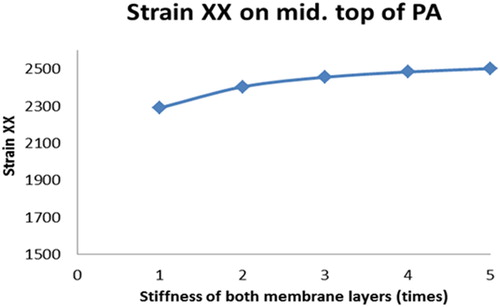
Figure 47. Vertical deformation on top of PA (both membrane stiffness varies).
3.7. Effect of the bonding strength of interface layers
In this section, numerical simulations were performed by varying the strain energy release rate G values of the bonding contact interface elements between the membrane layers and the surrounding asphalt concrete surfacings (). The strain energy release rate G values utilised for the numerical simulations are in the range of 0.1–10 N/mm. The parameter =2 mm is assumed. The magnitude of the G value stands for the bonding strength of the bonding contact interface. A higher G value represents a good bonding condition between the membrane layers and the surrounding asphalt concretes.
The distributions of the transversal strains (strain xx) at sections 1-1 and 2-2 are shown in and .
Figure 48. Strains at section 1–1 (G = 0.1, 1.0 and 10 N/mm).
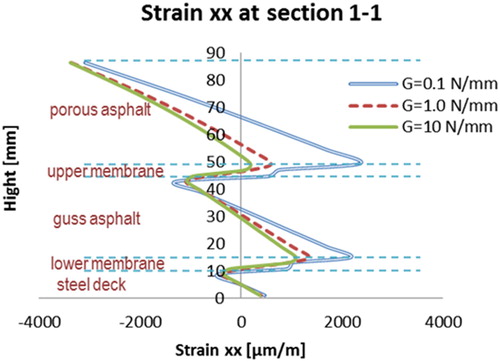
Figure 49. Strains at section 2–2 (G = 0.1, 1.0 and 10 N/mm).
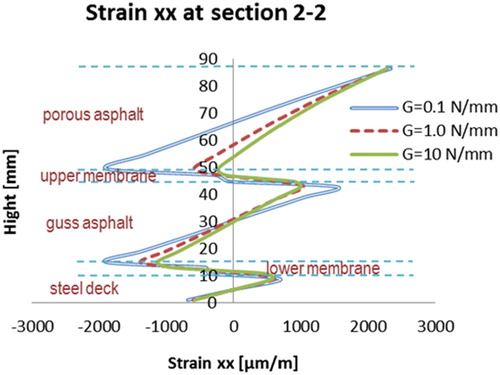
The following observations can be made:
The bonding strength of the membrane interfaces can influence the strain distributions through the depth of the surfacing layers.
The higher bonding strength of the membrane interfaces can improve the integrity of the 5PB beam.
The shear deformation in the asphalt surfacing layers close to the membranes can be reduced significantly by using the well-bonded membranes. The bonding conditions of the membrane interfaces do not influence very much the maximum tensile and compression strains at the surface of the PA layer.
No obvious influence on the strain distribution on the steel deck plate.
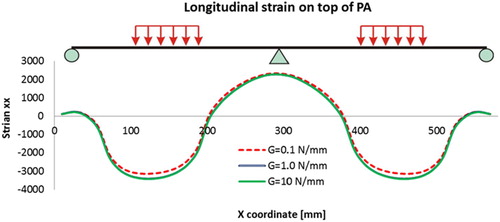
The distributions of strains on top of the PA layer are plotted in . As it is concluded above, the tensile strains on top of the middle support and the compression strains next to the loads are not significantly affected. The compression strains under the loading area are slightly increased by the stronger bonded membrane interface layers.
Figure 50. strains distribution on the top of the PA layer (G = 0.1, 1.0 and 10 N/mm).
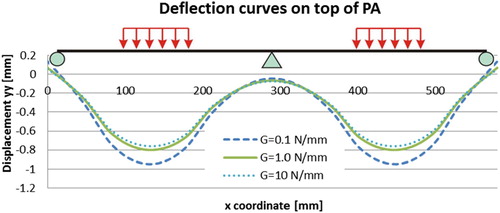
shows the 5PB beam deflection curves. It can be observed that well-bonded membrane interfaces may effectively reduce the deflection of the beam.
Figure 51. Vertical deformation on top of PA (G = 0.1, 1.0 and 10 N/mm).
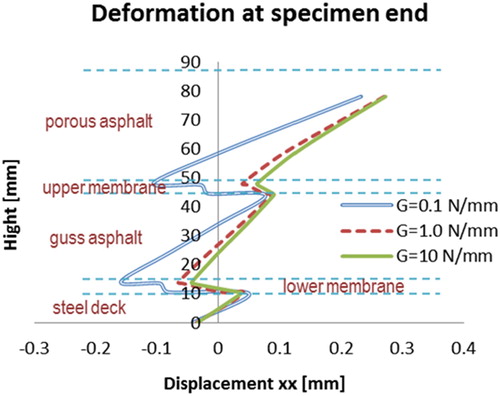
In the 5PB laboratory tests, the large shear deformations at both ends of 5PB beam specimens were observed. This phenomenon can be also investigated by the FE simulations, . Via the FE simulations, the deformed shape of the specimen end was plotted with the different bonding properties of the membrane interface layers, . It can be observed that better bonding properties between membranes and their surrounding asphalt concrete layers will reduce significantly the shear deformations between the different surfacing layers of the beam.
Figure 52. Shear deformations of 5PB beam specimen.
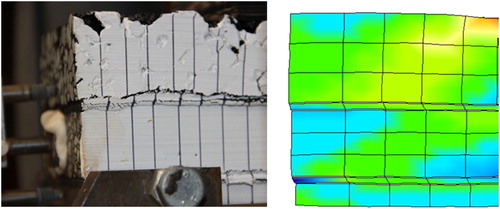
Figure 53. Shear deformations of 5PB beam specimens (G = 0.1, 1.0 and 10 N/mm).
4. Structural effects of debondings at interface layers
4.1. General
This section aims at studying the effects of debonding that occurs in 5PB beam specimens due to adhesion failures of membranes to their surrounding materials.
According to the numerical simulations of the 5PB beam in the previous sections. It was concluded that the higher bonding strength of the membrane interfaces results in the good composite behaviour of the beam, thus considerable reduction of the deformation of the surfacing layers are achieved.
However, due to constructional deficiencies or accumulating damages resulting from traffic loads on OSDBs as well as other environmental factors such as temperature changes, rainwater penetrations, etc., membrane interfaces may debond from the adjacent surfacing structure layers at a relatively small area and gradually develop further in a large area. The loss of bond between different surfacing structural layers will increase the surfacing material response degradation hence to reduce the service life of the OSDB. Therefore, the most important requirement for the application of membrane materials on OSDBs is that the membrane adhesive layer shall be able to provide sufficient bond to the surrounding materials. During the service time of OSDBs, several questions engineers often face:
How serious is a found debonding area and a debonding location with respect to effects on the behaviour of the whole surfacing structure?
How large is a debonding area that needs immediate repair, in other words, whether or not the adhesion failure could be ignored for the time being?
Up to now, very few experimental and numerical studies are available to answer the above questions. In the following sections, by introducing artificial non-bonded membrane interface elements in the 5PB FE simulations, the relationship between the variation of the tensile strain in the asphalt surfacing layers and the debonding length at the membrane interface is built. The critical debonding length can be determined on the basis of the significant increase of the tensile strain in the adjacent surfacing layers to the debonded membrane interface. The methodology developed here can provide a consistent and satisfactory solution that can be utilised for a road authority to make an OSDB bridge maintenance strategy.
4.2. FE model
According to the 5PB laboratory tests, fatigue damage in the membrane interface occur mostly at the areas above the middle support of the beam and at the areas under the loading feet. Therefore, in the 5PB beam finite element mesh, the two possible locations of the non-bonded membrane interfaces are introduced accordingly, see . There were six combinations of non-bonded membrane interface simulations performed. They are listed in .
Figure 54. Six sets of simulations of 5PB tests with the pre-debonded interfaces.
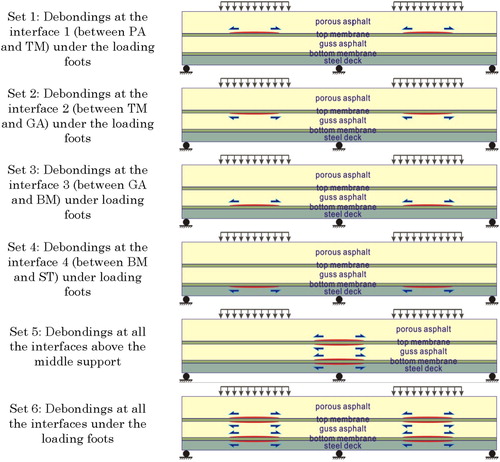
Table 3. Indication of the simulation sets of 5PB tests with interface failures.
4.3. Results and discussions
– present the distributions of transversal strain at the cross sections 1-1 and 2-2 of the 5PB beam in which the membrane interfaces with different lengths have been artificial pre-debonded from the adjacent materials as illustrated in .
Figure 55. Transversal strains in cross-section 1–1 (Set 1).
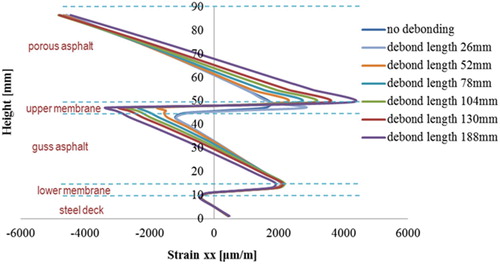
Figure 56. Transversal strains in cross-section 1–1 (Set 2).
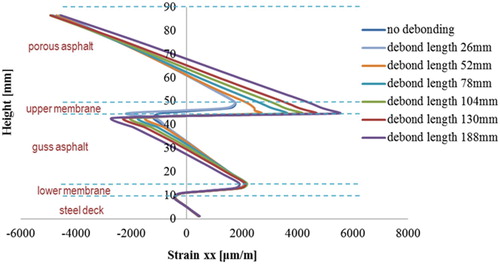
Figure 57. Transversal strains in cross-section 1–1 (Set 3).
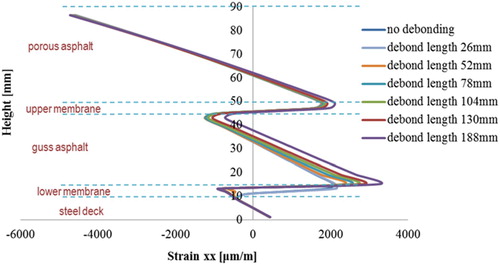
Figure 58. Transversal strains in cross-section 1–1 (Set 4).
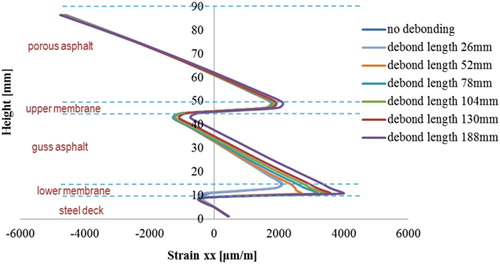
Figure 59. Transversal strains in cross-section 2–2 (Set 5).

Figure 60. Transversal strains in cross-section 1–1 (Set 6).
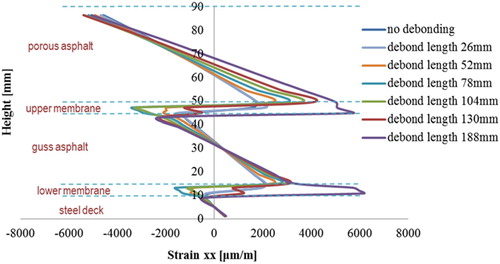
It can be observed that the development of the debonded membrane interface influences significantly the deformation in the surfacing materials, especially at those locations that are close to the debonded interface elements. The maximum tensile strains occur always at the locations where the artificial debonded interfaces are introduced. The larger the debonding length of the membrane interface, the higher tensile strains are developed in the surfacing materials. Moreover, due to the influences of the debonded membrane interfaces, surfacing materials that are under tensile deformation may change to compression and vice versa. For instance, at section 1-1, porous asphalt material between a height of 60 and 70 mm shifts from a compressive to a tensile part at cases of ‘no debonding’ and ‘debonding length of 188 mm’.
By increasing the membrane interface debonding length, shows the development of the tensile strain in the asphalt surfacing layers at the locations near to the debonded membrane interfaces.
Figure 61. The maximum tensile strains of simulation cases with various cracking lengths in interface layers.
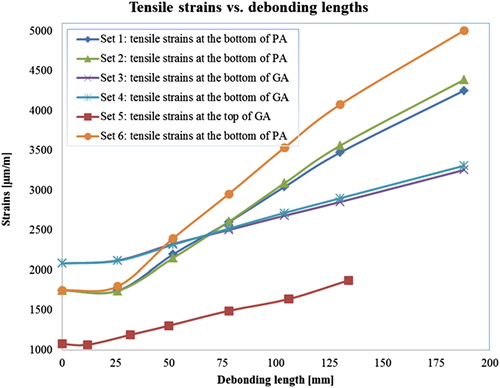
It can be seen that the length of the debonded membrane interfaces can influence significantly tensile strain development in the PA layer, see Sets 1, 2 and 6 in . The larger the number of debonded membrane interface elements in the 5PB beam, the more tensile strains are developed in the PA layer, see Set 6 in .
Another important observation is that all the curves show a clear turning point at a debonding length of approximately 25–30 mm. This implies that a debonding length of 25–30 mm is an important geometric parameter for the membrane to structurally affect the surfacing system response. For a membrane layer debonded less than 25 mm, it may not harm a surfacing structure in the short term, however, its long term effect stays vague and needs further investigation. The critical debonding length of 25 mm could be also utilised in evaluating the fatigue life of the membrane bonded on the specific surfacing material.
Since the 5PB beam test is limited in its test scale and boundary conditions, becomes more important to investigate the structural effects of the membrane defects in its interfaces in the surfacing system of OSDBs. Therefore, similar simulations of OSDBs under a different traffic load condition with the different membrane interface debonding lengths will be simulated in the future publication. The sensitivity of the critical debonding length of 25 mm on the response of OSDBs will be again proved.
5. Conclusions
The main findings from the results presented in this paper are summarised as follows.
A thicker steel plate can significantly reduce the deflection of the structure and hence the maximum tensile strain of the surfacing system;
A thicker PA layer can reduce the maximum tensile strain and deflection of the structure. A thicker GA layer can also reduce the maximum tensile strain and deflection of the structure, and more effectively than a PA layer does;
Stiffer membranes used in the multilayer surfacing system will result in a lower structure deflection and influence the transversal strain distribution in PA and GA layers. However, it has less influence on the maximum tensile strain on the top of the PA layer;
A stiffer membrane results in higher stress inside the membrane material itself, which may cause its failure. Special attention should be paid to the strength of membrane materials;
Better bonding properties of membrane interfaces can influence the strain distributions through the depth of the surfacing layers. Better bonding conditions of the membrane interfaces improve the integrity of the 5PB beam and reduce the damage in the surfacing layers;
Acknowledgments
This work is part of the research programme of InfraQuest. InfraQuest is a collaboration between Rijkswaterstaat, TNO and the Delft University of Technology.
Disclosure statement
No potential conflict of interest was reported by the authors.
Additional information
Funding
References
- Cullimore, M.S.G., Flett, I.D., and Smith, J.W, 1983. Flexure of steel bridge deck plate with asphalt surfacing. IABSE Periodical. Bristol: University of Bristol. 1, 58–83.
- Freitas, T.D. (2012). Steel plate reinforcement of orthotropic bridge decks. PhD dissertation. Delft University of Technology, Delft.
- Gurney, T, 1992. Fatigue of steel bridge decks. HMSO Publication Centre: London, (8).
- Hameau, G., Puch, C., and Ajour, A.M., 1981. Revetements de Chaussees sur Platelages Metalliques-2-Comportement a la Fatigue en Flexion Sous Moment Negati. Bulletin de Liaison des Laboratoires des Ponts et Chaussées, 111, 29–38.
- Houel, A., and Arnaud, L., 2008. A five point bending test for asphalt cracking on steel plates. Pavement Cracking: Mechanisms, Modeling, Detection, Testing and Case Histories, 261.
- Houel, A., N’Guyen, T.L., and Arnaud, L, 2009. Monitoring and designing of wearing courses for orthotropic steel decks throughout the five-point bending test. Advanced Testing and Characterisation of Bituminous Materials, 1 and 2, 433–442.
- Li, J, 2015. Optimum design of multilayer asphalt surfacing systems for orthotropic steel deck bridges. Ph.D. thesis. Delft University of Technology, the Netherlands.
- Liu, X., et al., 2008. Experimental and numerical characterization of a membrane material for orthotropic steel deck bridges: part 2. Finite Elements in Analysis and Design, 44, 580–594. doi: https://doi.org/10.1016/j.finel.2008.01.012
- Liu, X., et al., 2010. Characterisation of surfacing materials for orthotropic steel deck bridges – part 2: numerical work. International Journal of Pavement Engineering, 11 (3), 255–265. doi: https://doi.org/10.1080/10298430902859346
- Liu, X., et al., 2013. Test method to assess bonding characteristics of membrane layers in wearing course on orthotropic steel bridge decks. Transportation Research Record: Journal of the Transportation Research Board, 2360, 77–83. doi: https://doi.org/10.3141/2360-10
- Liu, X., et al., 2016. Analysis and assessment of fatigue response of multilayer asphalt surfacing system on orthotropic steel deck bridge with the five-point bending beam tests. Journal of Testing and Evaluation, 44, 3.
- Mangus, A.R. and Sun, S., 1999. Chapter 14: Orthotropic bridge decks. In: W. Chen and L. Duan, eds. Bridge engineering handbook. Boca Raton: CRC Press.
- Medani, T.O. (2006). Design principles of surfacings on orthotropic steel bridge decks. PhD thesis, Delft University of Technology.
- Medani, T.O., et al., 2010. Characterisation of surfacing materials for orthotropic steel deck bridges. part 1: experimental work. International Journal of Pavement Engineering, 11 (3), 237–253. doi: https://doi.org/10.1080/10298430902943033
- Metcalf, C.T., 1967. Flexural tests of paving materials for orthotropic steel plate bridges. Highway Research Record, 155, 61–81.
- Muraya, P.M. (2007) Permanent deformation of asphalt mixes. PhD thesis, Delft University of Technology.
- Pouget, S., et al., 2010. Numerical simulation of the five-point bending test designed to study bituminous wearing courses on orthotropic steel bridge. Materials and Structures, 43 (3), 319–330. doi: https://doi.org/10.1617/s11527-009-9491-1
- Rao, K.M., and Ghosh, B.G., 1979. Exact analysis of unsymmetric laminated beam. Journal of the Structural Division, ASCE, 105 (11), 2313–2325. doi: https://doi.org/10.1061/JSDEAG.0005279
- Reches, Z., and Johnson, A.M., 1976. A theory of concentric, kink and sinusoidal folding and of monoclinal flexuring of compressible, elastic multilayers. Tectonophysics, 35, 295–334. doi: https://doi.org/10.1016/0040-1951(76)90074-3
- Scarpas, A., 2004. A mechanics based computational platform for pavement engineering. Delft: Delft University of Technology.
- Tzimiris, G., 2017. Experimental investigation of membrane materials used in multilayer surfacing systems for orthotropic steel deck bridges. Ph.D. thesis. Delft University of Technology, the Netherlands.