
 ?Mathematical formulae have been encoded as MathML and are displayed in this HTML version using MathJax in order to improve their display. Uncheck the box to turn MathJax off. This feature requires Javascript. Click on a formula to zoom.
ABSTRACT
Moisture in unbound layers and temperature in asphalt layers affect the structural response of pavements, such as the tensile strain at the bottom of asphalt concrete layers. Previous studies have proposed relationships for estimating tensile strain at the bottom of an asphalt layer from Falling Weight Deflectometer (FWD) surface deflection measurements. These relationships have been developed based on theoretical calculations of strains and surface deflections. The main objective of this study was to evaluate these relationships using measured FWD deflections and tensile strains at the bottom of asphalt concrete layers. Three instrumented test structures were considered in the study. FWD and strain measurements were conducted at varying groundwater levels in the subgrade and temperatures in the asphalt concrete layers. The results revealed that the relationships have poor agreement with measured strains. A new relationship is proposed that incorporates the volumetric water content in the subgrade and the temperature in the asphalt layers in addition to the surface FWD deflections.
1. Introduction
Condition assessment of pavement plays a major role in maintenance and rehabilitation strategies for many state highway agencies (Khattak et al. Citation2012). The Falling Weight Deflectometer (FWD) is a deflection-testing device commonly used for condition assessment of pavements. Since the FWD is easy to use and simulates traffic loading quite well, it is used by many agencies to evaluate the structural capacity of a pavement (Huang Citation1993, Doré and Zubeck Citation2009). The deflections obtained from FWD measurements may be used to estimate stresses and strains induced in a structure by wheel load (ECDGT Citation1997, Park and Kim Citation2003). FWD tests are frequently performed to calculate strains at the bottom surface of the asphalt layer in order to determine the fatigue life of the pavement with respect to bottom-up cracking (Park and Kim Citation2003).
The major factors that influence deflections derived from FWD testing are pavement conditions, loading, pavement structure and environmental conditions (Huang Citation1993, ECDGT Citation1998). For flexible pavements, deflections obtained in areas with cracking and rutting deterioration are normally higher than those in areas free of distress (Huang Citation1993). The most frequent load used with FWD is 50 kN, which corresponds to a standard axle load of 100 kN (ECDGT Citation1997). Incorrect layer thicknesses in the analysis of deflection measurements therefore result in incorrect moduli and strain at the bottom of asphalt concrete (AC) layers (Jansson Citation1994, Ullidtz Citation1998). The temperature of the AC layers and the water content of the base and subgrade are two of the most important environmental factors that influence flexible pavement performance (Zuo et al. Citation2007, Qiao et al. Citation2013).
The stiffness and fatigue characteristics of bituminous layers are sensitive to moisture intrusion and temperature changes. The combined effect of traffic loading and moisture, as in the case of traffic loading on wet pavement, leads to a reduction in dynamic modulus (Dhakal and Ashtiani Citation2016, Sulejmani et al. Citation2019). A change in the AC temperature directly affects the stiffness of the bound layers, which changes the stress state throughout the pavement. This change in stress state can, in turn, affect the performance of the underlying unbound layers, since they normally exhibit stress dependence (Zuo et al. Citation2007). Asphalt softens at higher temperatures and thus is more prone to higher horizontal strains at the bottom of the asphalt layers (Huang Citation1993, Lukanen et al. Citation2000, Marshall et al. Citation2001, Losa et al. Citation2008, El-Maaty Citation2017). In practice, when pavement performance is periodically controlled or when comparisons between pavement structures are made, the Swedish Transport Administration (Citation2012b) recommends performing FWD measurements during autumn, when temperatures are around 10°C and the unbound layers and subgrade are usually free from water.
Likewise, moisture content changes in the base and subgrade soils affect the stiffness of those pavement system components (Zuo et al. Citation2007, Erlingsson Citation2010). Excess moisture content reduces the resilient modulus of the unbound layers, causing increased strains in the AC layers through poorer support to the asphalt bound layers (Roberts et al. Citation1996; Said et al. Citation2011, Salour and Erlingsson Citation2014). This strain is an important factor in cold regions, where pavements commonly become saturated during the spring thaw, and the stiffness modulus in the granular layers decreases (Huang Citation1993, Salour and Erlingsson Citation2012, Citation2013). Tests performed by Salour and Erlingsson (Citation2014) revealed that the estimated strain at the bottom of the AC layer increased by 34% when the groundwater table (GWT) level was raised from 2.5 to 1.0 m below the road surface. Similarly, Saevarsdottir and Erlingsson (Citation2013) showed that measured tensile strain at the bottom of the bituminous base significantly increased when the GWT rose from a considerable depth to 30 cm below the subgrade surface. Differences in the underground water table are usually not controlled when FWD measurements are performed, which causes variation in the results.
Tensile strain at the bottom of the bituminous layer is usually defined as critical for evaluating fatigue cracking. The tensile strain of an asphalt pavement is traditionally estimated using the back-calculated modulus from FWD measurements. Relationships for estimating tensile strains directly from FWD surface deflections have also been previously developed (Jansson Citation1994, Xu et al. Citation2002). These relationships assume that the effects of environmental conditions are reflected in the deflections from the FWD measurements. Temperature and moisture content parameters are, therefore, not directly included in these relationships. Moreover, these relationships have been developed based on theoretical calculations of surface deflections and horizontal strain at the bottom of the asphalt layer using multilayer elastic theory (Jansson Citation1994, Xu et al. Citation2002).
This study aimed to develop new relationships for predicting tensile strain with regard to variations in temperature and groundwater levels in pavement structure using deflections from FWD measurements. The FWD measurements were performed on three different full-scale indoor test structures. The structures were instrumented to measure the strain at the bottom of the bituminous layer, the temperature in the AC layer and the volumetric water content in the subgrade.
2. Pavement structures and laboratory tests
2.1. Test structures and instrumentation
Three indoor pavement structures were built at VTI (The Swedish National Road and Transport Research Institute) to study the effects of moisture and temperature on the structural responses of the pavement structure to loading. The temperature, volumetric moisture content of the pavement and horizontal strain at the bottom of the AC layers were monitored using instrumentation (Arvidsson Citation2014).
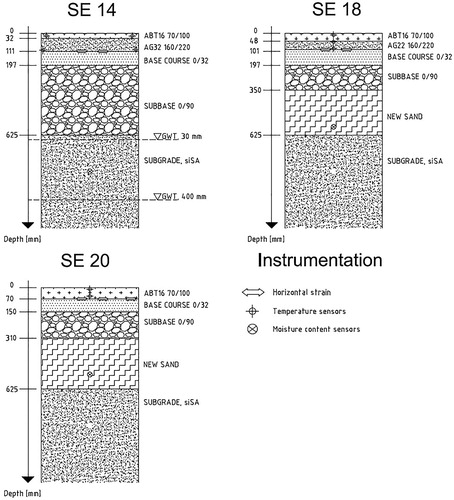
Three flexible pavement structures frequently used in Sweden were studied. The structures are denoted as SE 14, SE 18 and SE 20 and are shown in . The wearing course for all pavement structures was made of dense asphalt mixture, denoted ABT16 70/100. SE 14 was the thickest structure, with a total of 625 mm of pavement structure, including 111 mm of AC layers. The structure consisted of a 79 mm AC base course, denoted AG32 160/220. SE 18 was the ‘medium’ structure, having 101 mm thick asphalt layers. It consisted of 53 mm of road base mix, denoted AG22 160/200. Pavement SE 20 was the thinnest structure, having a wearing course of ABT16 70/100. The bituminous structures consisted of only 70 mm of wearing course ABT 16 70/100 and 240 mm of unbound layers (see ). The asphalt mixtures were produced with granite aggregate.
Figure 1. Cross-sections of pavement structures SE 14, SE 18 and SE 20 and the vertical location of the instrumentation.
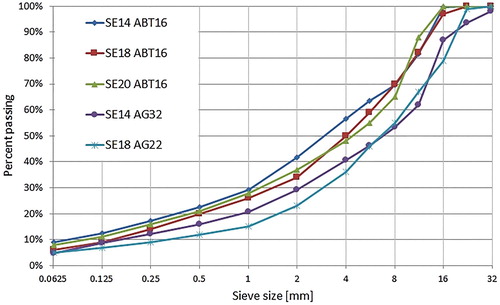
describes the materials used for the bound layers. shows the types of unbound materials, the second deformation modulus (Ev2) and the ratio of first and second deformation moduli (Ev2/Ev1) from the plate loading test conducted on the unbound layers. shows the grain size distributions of the five asphalt mixes.
Figure 2. Gradation curves for asphalt mix types ABT 16, AG 22 and AG 32 (Arvidsson Citation2014).
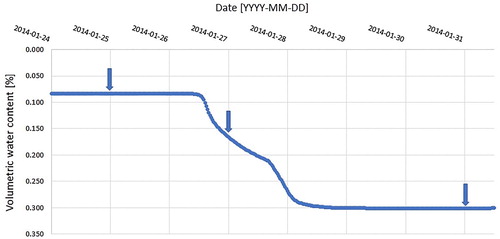
Table 1. Material, binder type, binder content and air void content for all bound layers (Arvidsson Citation2014).
Table 2. Types of unbound materials and results of plate loading test subgrade (Ev2 and Ev2/Ev1) (Arvidsson Citation2014).
The tests were conducted in an indoor full-scale pavement test facility where pavements can be constructed with an ordinary road construction machine. The size of the test pits was 3 m in depth, 5 m in width and 15 m in length. The test pits were filled with silty sand to a thickness of 2.5 m to act as a subgrade for the test structures. The facility had a heating/cooling system, and temperatures could thus be held constant.
A schematic overview of the instruments used in this study is shown in . The instrumentation consisted of the following (Wiman Citation2006, Arvidsson Citation2014):
Moisture content sensors to measure the volumetric water content at 22.5 cm below the subgrade surface (water content reflectometers);
Asphalt strain gauges (ASGs) to measure the horizontal strain at the bottom of the asphalt bound layers in the longitudinal and transverse directions (H-shaped gauges from Dynatest); and
Temperature sensors in the AC layer (temperature gauges).
2.2. Test programme
The structural response of the pavement was evaluated by conducting FWD tests. In SE 14, the level of the GWT was chosen to simulate three conditions as follows: (1) natural moisture – simulates a standard situation where the GWT is at a considerable depth, with no lateral moisture transfer and very limited evaporation; (2) moderate moisture – simulates well-functioning trenches where the GWT level is below the trench bottom, which was based on Swedish regulations stating that it should be at least 30 cm below the subgrade surface; and (3) heavy moisture – simulates the severe case when water is running in the trenches and the GWT lies just below the subgrade surface, according to . SE 18 and SE 20 were tested only at different temperatures. The chosen temperatures were within the range of normal temperatures used in the Swedish Mechanistic Empirical (ME) Program for pavement design representing spring, autumn and summer in Sweden (Swedish Transport Administration Citation2011).
Table 3. Temperature and groundwater levels used in the study.
The FWD measurements were performed using a 50 kN load level, corresponding to a standard axle load of 100 kN. Seven geophones were used to measure vertical deflection. The geophones were located at 0, 200, 300, 450, 600, 900 and 1,200 mm from the centre of the load plate. summarises the different environmental conditions for the measurements performed. The measurements were performed when the target temperature and GWT was stabilised according to the temperature and moisture sensors in the pavement. shows the volumetric water content.
Figure 3. Volumetric water content measurements for SE 14 showing test dates (arrows).
3. Results
3.1. FWD and horizontal strain measurements
The following section shows the FWD deflection measurements and measured horizontal strains at the bottom of the asphalt bound layers. It should be noted that the deflections and measured strains presented in – are the mean values from two location measurements for structures SE 14 and SE 18 and three measurements for SE 20.
Figure 4. (a) FWD measurements, (b) measured horizontal strain at the bottom of the asphalt bound layers for structure SE 18.
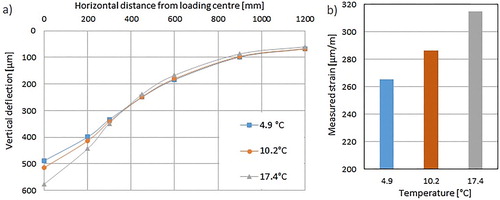
Figure 5. (a) FWD measurements, (b) measured horizontal strain at the bottom of the asphalt bound layers for structure SE 20.
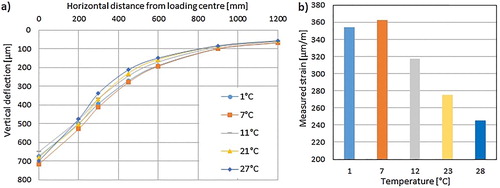
Figure 6. (a) FWD measurements, (b) measured horizontal strain at the bottom of the asphalt bound layers for structure SE 14.
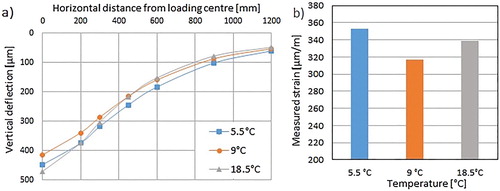
Figure 7. (a) FWD measurements at 10°C with varying groundwater levels, (b) measured horizontal strain at the bottom of the asphalt bound layers for structure SE 14.
3.1.1. SE 18 – effect of temperature
(a) illustrates the mean of vertical deflections at different pavement temperatures (4.9°C, 10.2°C and 17.4°C). The effect of temperature clearly decreased with horizontal distance from the loading centre, especially after a distance of 300 mm, which indicates that temperature influences the AC layers (Doré and Zubeck Citation2009). (b) shows the mean of measured horizontal strains, indicating that strain increases as temperature increases.
Surface deflection and measured horizontal strain increased as pavement temperature increased. Similar results have been presented by El-Maaty (Citation2017). A change in temperature from 10°C to 18°C increased vertical deflection by 12% and measured strain by 15% at the loading centre.
3.1.2. SE 20 – effect of temperature on thin asphalt layers
The FWD measurements were performed at different temperatures in order to determine the relationships between tensile strain and temperature for a thin asphalt pavement structure such as SE 20 (1°C–27°C). The AC thickness for this structure was only 70 mm. Asphalt thickness thinner than 75 mm is not recommended for estimating the strain at the bottom of the asphalt layer according to the Swedish standard (Jansson Citation1994). illustrates the vertical deflection and measured horizontal strains for structure SE 20 to clarify the influence of temperature changes on structures with a thin AC layer.
(a) shows that the vertical deflection at the loading centre increased from 676 to 716 μm when the temperature increased from 0.9°C to 6.6°C. The tensile strain at the bottom of the asphalt layer also increased slightly from 353 to 364 μm/m ((b)). However, at temperatures higher than 6.6°C, the tensile strains unexpectedly decreased as the temperature increased. Further, the deflection basin from structure SE 20 showed that at temperatures higher than 6.6°C, the surface deflection at the loading centre remained nearly stable or decreased slightly as temperature increased. This finding might be explained by the fact that the combined effect of an increase in temperature and thin AC thickness changes the response of the asphalt layer from acting as a beam to a membrane deformation pattern, which results in lower tension (Papadopoulos and Santamarina Citation2016, Citation2019). Measurements for SE 20 higher than 6.6°C are therefore not included in further analysis of the results.
3.1.3. SE 14 – effect of temperature and groundwater level
presents the vertical deflections and measured horizontal strains at different temperatures and natural moisture content of the structure. Measurements at 5.5°C were performed three months earlier than the other measurements for the same structure.
shows that vertical deflections and horizontal strain measurements were greater at 5.5°C than 9°C. Additionally, the deflection basin for 5.5°C did not converge with the other basins after 300 mm, meaning that there are factors in addition to temperature affecting the measurements at 5.5°C, which is unreasonable. These measurements were performed three months earlier, as noted above. Therefore, some unknown changes in the test conditions might have occurred during these three months (e.g. aging).
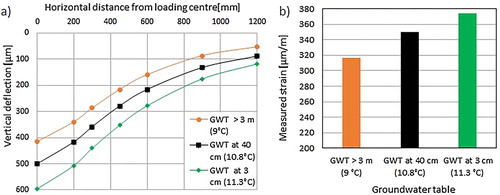
At approximately 10°C, two additional FWD tests were conducted with GWT levels at 3 and 40 cm below the subgrade surface (see (a)) to illustrate the effect when the GWT is raised. (b) shows the horizontal strain for the conducted measurements at approximately 10°C with varying groundwater levels.
shows that the deflection basin and measured tensile strains increased considerably as the GWT level was raised. Changes in GWT level and subsurface moisture conditions significantly affected the outer part of the deflection basin, which indicates that the subgrade weakened (Doré and Zubeck Citation2009). Moreover, changes in the groundwater level from a considerable depth to 3 cm below the subgrade surface increased vertical deflection by 43% and measured strains by 18% at the loading centre. Similar findings have been reported in a previous study (Salour and Erlingsson Citation2014).
3.2. Estimation of strain
Relationships for estimating strains at the bottom of the bituminous layers from FWD measurements have been previously reported (Jansson Citation1994, Kim Citation2001, Xu et al. Citation2002, Xu et al. Citation2003). Equation (1) is based on multiple linear regressions to calculate strains at the bottom of bituminous layers according to the Swedish Transport Administration (Citation2012a) for several different pavements with asphalt layer thicknesses greater than 75 mm.
(1)
(1) where ε is the tensile strain at the bottom of a bituminous layer [μm/m] and D0, D300 and D600 are deflections [in μm] at 0, 300 and 600 mm, respectively, from the centre of the loading plate.
The tensile strain at the bottom of the bituminous layer can also be estimated using formulas developed by the Asphalt Layer Condition Assessment Program (APLCAP) (Kim Citation2001, Xu et al. Citation2003). Equation (2) is proposed for aggregate base pavements with AC, Hac < 6 in (150 mm):
(2)
(2) where SCI and BDI are deflection basin indicators [in mil] and Hac is the thickness of the asphalt layer [in in].
Equations (1) and (2) were developed based on theoretical calculations of surface deflections and horizontal strain at the bottom of the AC layer using multilayer elastic theory. These relationships assume that the effects of environmental conditions are reflected in the deflections from the FWD measurements. AC layer thickness is included in Equation (2) but not in Equation (1). Neither temperature nor moisture content parameters are directly included in these relationships. compares estimated strains using Equations (1) and (2) with measured strains.
Figure 8. (a) Measured and predicted values of horizontal strain at the bottom of the asphalt layer using Equation (1) and (b) Equation (2) with respect to the 45° equality line.
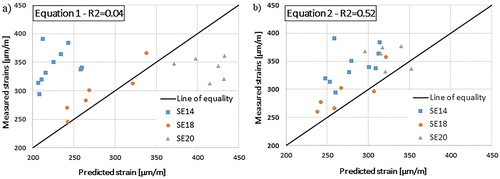
(a) shows that the coefficient of determination (R2) for the estimated and measured strains was determined to be 0.18 using Equation (1) (Swedish formula). (b) shows that the R2 using Equation (2) was 0.52 (APLCAP formula) for the data measured in this work. The low R2 values indicate poor fit with the measured strains. (a and b) illustrate that structure SE 18 with its 100 mm thick AC layer, natural moisture content in the subgrade and temperatures ranging between 5°C and 18°C shows the best agreement between the estimated and measured strains for both Equations (1) and (2). However, for structure SE 20, with its thin hot mix asphalt (HMA) layer (70 mm) (measurements at temperatures >7°C were not included) and at conditions with excess moisture content in the subgrade, the fit between the estimated and measured strains was poorer.
3.3. Regression analysis
Multiple linear regression analysis was performed between the measured asphalt strain (dependent variable) and deflections. Asphalt layer thickness, temperature in the asphalt mixture and moisture content at 22.5 cm below the subgrade surface were tested as independent variables. The thickness of the AC layer was shown not to be significant and is therefore not included in the statistical analysis below. shows the ANOVA analysis.
Table 4. ANOVA analysis with moisture content as an independent variable.
Since, in practice, no moisture content information is available for a pavement due to difficulties in measurement, an additional multiple linear regression analysis was performed without the volume of water content in the pavement. That ANOVA analysis is shown in .
Table 5. ANOVA analysis without moisture content as an independent variable.
The values of R2 with and without water content are 0.76 () and 0.55 (), respectively. The P-values of the coefficients in and show that all independent variables significantly affected the estimation of strain at the bottom of the AC layer. shows that without considering moisture content, the R2 value decreased from 0.76 to 0.55, which indicates that moisture content plays a major role in estimating the strain at the bottom of the AC layer.
The two relationships developed to determine the strain at the bottom of the AC layer based on and are shown in Equations (3) and (4), respectively.
(3)
(3)
(4)
(4) where εac is tensile strain at the bottom of the asphalt mixture [μm/m], T is the temperature (°C), v is the volume of water content at 22.5 cm below the subgrade surface [%] and D0, D300 and D900 are the deflections at horizontal distances from loads of 0, 300 and 900 mm [in μm], respectively. The estimated strains using Equations (3) and (4) were compared to the measured strains (see ).
Figure 9. Measured and predicted values of horizontal strain at the bottom of the asphalt layer using (a) Equation (3) and (b) Equation (4) with respect to the 45° equality line.
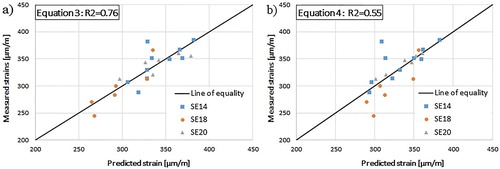
As can be seen from (a), Equation (3) shows better agreement with the predicted and measured strains at the bottom of the AC layers compared to Equations (1) and (2). Equations (1) and (2) were developed based on theoretical calculations of surface deflections and horizontal strain at the bottom of the asphalt layer simulating pavements that cover the range of layer thickness and stiffness modulus for many existing pavements. It is understood that Equations (1) and (2) were developed under the assumption that the effects of environmental conditions are reflected in the deflections, which may explain why Equations (1) and (2) have a lower determination coefficient than Equation (3) when the range of temperature and groundwater level is included. Considering the difficulty of measuring water content under actual field conditions, Equation (4) was developed without moisture content as an independent variable, although it shows low R2. Temperature is directly included in Equation (4), and it shows a slightly higher R2 value than Equations (1) and (2). However, Equation (4) has a considerably lower R2 value than Equation (3), which indicates the significant contribution of water content in explaining the strain at the bottom of the AC layer. Thus, the results of this study show that environmental conditions should be directly included when the tensile strain is estimated in order to correctly estimate the tensile strain from the measured FWD deflections.
4. Discussion
This study revealed that temperature mainly affects FWD deflections from the loading centre to a distance of 300 mm, which agrees with an earlier study by El-Maaty (Citation2017). Temperature was also found to significantly influence the measured horizontal strain at the bottom of asphalt layers. Earlier studies (Papadopoulos and Santamarina Citation2016, Citation2019) have shown that the combined effect of high temperature and thin AC thickness changes the response of the asphalt layer from acting as a beam to a membrane deformation pattern, which results in lower tensile strain at the bottom of the AC layer. For structures with a thin AC layer (SE 20) and FWD measurements at high temperatures (> 6.6°C), centre deflection and measured deflections and strains were almost the same or decreased as temperature increased. These results are consistent with the recommendations from the Swedish standard that tensile strain at the bottom of an AC layer should not be directly predicted with Equation (1) for structures with AC layers thinner than 75 mm.
The presence of moisture in the subgrade significantly affected the horizontal strain at the bottom of the AC layers under load from FWD. For structure SE 14, the rise in groundwater level from considerable depth to 30 cm below the subgrade surface had a greater impact on the measured horizontal strain and vertical deflection than increasing the temperature of the asphalt layer from 9°C to 18.5°C. The collected data showed a correlation between the water content and the measured strain at the bottom of the AC layer. Similar findings have been reported in other studies (see, e.g. Salour and Erlingsson Citation2013, Saevarsdottir and Erlingsson Citation2014). Increased moisture content in the unbound layers and subgrade may cause increased strains in the AC layers through poorer support to asphalt bound layers (Roberts et al. Citation1996, Said et al. Citation2011).
This study showed that the strains estimated using the relationships represented by Equations (1) and (2) have poor agreement with measured strains for structures, particularly under conditions with excess moisture content in the subgrade. A new relationship, Equation (3), was developed to estimate the horizontal strain at the bottom of an AC layer based on measured FWD deflections, strains, temperatures and moisture content. An ANOVA analysis showed that all independent variables selected in this equation have a significant effect on the predicted strain at the bottom of the AC layer. As noted earlier, AC layer thickness is an important factor when the strain at the bottom of the AC layer is predicted (Jansson Citation1994, Ullidtz Citation1998, Said et al. Citation2011). However, a multiple linear regression analysis showed the thickness of the AC layer was not a significant factor (p = 0.15) in estimating the strain at the bottom of the AC layer. This finding may be because of the relatively narrow range of AC layer thicknesses (70–110 mm) for the structures used in this study, which are within the range of typical Swedish structures (Said et al. Citation2011).
The relationship represented by Equation (3) that includes moisture content as an independent variable showed better accuracy with measured strains compared to the relationships represented by Equations (1) and (2). However, Equation (4), which did not include moisture content as a variable, had a considerably lower R2 value compared with Equation (3), indicating the significant influence of moisture content in explaining the strain at the bottom of the AC layer.
The new relationship, Equation (3), offers more flexibility for predicting tensile strain at the bottom of the AC layer with FWD measurements under different temperature and moisture conditions. In practice, this relationship is therefore more flexible for the periodic evaluation of pavement structures. However, more measured data would be useful to verify this relationship. Further studies with a wider range of AC layer thicknesses, temperatures and moisture contents need to be conducted for a better understanding of the impact of these variables on the tensile strain at the bottom of the AC layer. In addition, it would be valuable to study the effect of temperature and moisture based on actual field conditions where the formula in Equation (3) can be validated.
5. Conclusions and recommendations
The following conclusions can be drawn from the study:
Temperature and moisture content make a significant contribution to explaining the strain at the bottom of the AC layer.
An enhanced relationship develops between temperature, moisture content, surface deflection measurements and the tensile strain at the bottom of the asphalt layer. This relationship can be useful in evaluating the influence of environmental parameters on the strain level at the bottom of the AC layer.
The adapted relationship represented in Equation (3) can be used to predict strains at the bottom of AC layers even for AC layer thicknesses less than 75 mm but only at temperatures lower than 7°C.
Validation of the Equation (3) relationship with a wider spectrum of input data would be valuable.
Acknowledgements
The authors would like to express their gratitude to Olle Eriksson at The Swedish National Road and Transport Research Institute (VTI) for his help with statistical analysis. Special thanks go to the technical staff at VTI for their construction and measurements of the test structures.
Disclosure statement
No potential conflict of interest was reported by the authors.
References
- Arvidsson, H., 2014. HVS-test för skattning av nedbrytningseffekter från den tunga trafikens belastning: SE14, SE18 och SE20. Linköping, Sweden: Statens väg-och transportforskningsinstitut.
- Dhakal, S. and Ashtiani, R, 2016. Effect of different levels of moisture intrusion on the dynamic modulus and tensile properties of dense graded hot mix asphalt using a cyclic moisture induced stress tester. International Conference on Transportation and Development, 2016, 803–812.
- Doré, G. and Zubeck, H.K., 2009. Cold regions pavement engineering. Reston, VA: ASCE Press.
- El-Maaty, A.E.A, 2017. Temperature change implications for flexible pavement performance and life. International Journal of Transportation Engineering and Technology, 3, 1. doi: https://doi.org/10.11648/j.ijtet.20170301.11
- Erlingsson, S, 2010. Impact of water on the response and performance of a pavement structure in an accelerated test. Road Materials and Pavement Design, 11, 863–880. doi: https://doi.org/10.1080/14680629.2010.9690310
- European Commission Directorate General Transport (ECDGT), 1997. Cost 325 new road monitoring equipment and methods. Belgium.
- European Commission Directorate General Transport (ECDGT)., 1998. COST 336. Falling weight deflectometer. Information gathering report. Task Group 2-FWD at Network Level: Final draft version. European Commission Brussels.
- Huang, Y.H, 1993. Pavement analysis and design. New Jersy, NJ: Prentice-Hall, Inc.
- Jansson, H., 1994. A simple structural index based on FWD measurement. Statens Väg-och Transportforskningsinstitut., VTI särtryck 223.
- Khattak, M., et al., 2012. Variability of in-situ HMA volumetric and mechanistic characteristics using non-destructive test (NDT): case study. International Journal of Pavement Engineering, 13, 110–125. doi: https://doi.org/10.1080/10298436.2011.597858
- Kim, Y.R, 2001. Assessing pavement layer condition using deflection data. Washington, DC: Transportation Research Board, National Research Council.
- Losa, M., Bacci, R., and Leandri, P, 2008. A statistical model for prediction of critical strains in pavements from deflection measurements. Road Materials and Pavement Design, 9, 373–396. doi: https://doi.org/10.1080/14680629.2008.9690175
- Lukanen, E.O., Stubstad, R., and Briggs, R, 2000. Temperature predictions and adjustment factors for asphalt pavement. No. FHWA-RD-98-085; DBNX94822-D; NTIS-PB2000107444. Turner-Fairbank Highway Research Center.
- Marshall, C., Meier, R., and Welch, M, 2001. Seasonal temperature effects on flexible pavements in Tennessee. Transportation Research Record: Journal of the Transportation Research Board, 1764, 89–96. doi: https://doi.org/10.3141/1764-10
- Papadopoulos, E. and Santamarina, J.C, 2016. Analysis of inverted base pavements with thin-asphalt layers. International Journal of Pavement Engineering, 17, 590–601. doi: https://doi.org/10.1080/10298436.2015.1007232
- Papadopoulos, E. and Santamarina, J.C, 2019. Inverted base pavements: construction and performance. International Journal of Pavement Engineering, 20, 697–703. doi: https://doi.org/10.1080/10298436.2017.1326237
- Park, H.M. and Kim, Y.R., 2003. Prediction of remaining life of asphalt pavement using fwd multiload level deflections. Transportation Research Board. In: 2003 Annual Meeting Proceedings, Transportation Research Board. Washington, DC.
- Qiao, Y., et al., 2013. Examining effects of climatic factors on flexible pavement performance and service life. Transportation Research Record: Journal of the Transportation Research Board, 2349, 100–107. doi: https://doi.org/10.3141/2349-12
- Roberts, F.L., et al., 1996. Hot mix asphalt materials, mixture design and construction. National Asphalt Pavement Association Research and Education Foundation. 5100 Forbes Boulevard, Lanham, Maryland 20706-4407. Second Edition.
- Saevarsdottir, T. and Erlingsson, S, 2013. Water impact on the behaviour of flexible pavement structures in an accelerated test. Road Materials and Pavement Design, 14, 256–277. doi: https://doi.org/10.1080/14680629.2013.779308
- Said, S.F., et al., 2011. Fatigue life evaluation of flexible pavement. International Journal of Pavement Research and Technology, 4, 80–88.
- Salour, F. and Erlingsson, S., 2012. Pavement structural behaviour during spring thaw. Interpretation of FWD measurements by monitoring environmental data from a county road. VTI Report, 738.
- Salour, F. and Erlingsson, S, 2013. Investigation of a pavement structural behaviour during spring thaw using falling weight deflectometer. Road Materials and Pavement Design, 14, 141–158. doi: https://doi.org/10.1080/14680629.2012.754600
- Salour, F. and Erlingsson, S, 2014. Impact of groundwater level on the mechanical response of a flexible pavement structure: a case study at the Torpsbruk test section along county road 126 using Falling Weight Deflectometer. Linköping, Sweden: VTI.
- Sulejmani, P., et al., 2019. Moisture sensitivity of asphalt mixtures using cycling pore pressure conditioning. Transportation Research Record: Journal of the Transportation Research Board, 2673, 294–303. doi: https://doi.org/10.1177/0361198118823496
- Swedish Transport Administration, 2011. Trafikverkets tekniska krav Vägkonstruktion. In: S.T. Administration, ed. TDOK 2011:264.
- Swedish Transport Administration, 2012a. TRVMB 112 Bearbetning av deflektionsmätdata, erhållna vid provbelastning av väg med FWD–apparat.
- Swedish Transport Administration, 2012b. TRVMB 114 Bearbetning av deflektionsmätdata, erhållna vid provbelastning av väg med FWD-apparat.
- Ullidtz, P., 1998. Modelling flexible pavement response and performance. Amsterdam, The Netherlands: Gylling Polyteknisk Forlag.
- Wiman, L.G, 2006. Accelerated load testing of pavements: HVS-NORDIC tests at VTI Sweden 2003–2004. Linköping, Sweden: VTI.
- Xu, B., Ranjithan, S.R., and Kim, Y.R, 2002. New relationships between falling weight deflectometer deflections and asphalt pavement layer condition indicators. Transportation Research Record: Journal of the Transportation Research Board, 1806, 48–56. doi: https://doi.org/10.3141/1806-06
- Xu, B., Ranjithan, S., and Kim, Y, 2003. Using the asphalt pavement layer condition assessment program: case studies. Transportation Research Record: Journal of the Transportation Research Board, 1860, 66–75. doi: https://doi.org/10.3141/1860-08
- Zuo, G., Drumm, E.C., and Meier, R.W, 2007. Environmental effects on the predicted service life of flexible pavements. Journal of Transportation Engineering, 133, 47–56. doi: https://doi.org/10.1061/(ASCE)0733-947X(2007)133:1(47)