
 ?Mathematical formulae have been encoded as MathML and are displayed in this HTML version using MathJax in order to improve their display. Uncheck the box to turn MathJax off. This feature requires Javascript. Click on a formula to zoom.
ABSTRACT
A new crack detection approach based on local binary patterns (LBP) with support vector machine (SVM) was proposed in this paper. The propsed algorithm can extract the LBP feature from each frame of the video taken from the road. Then, the dimension of the LBP feature spaces can be reduced by Principal Component Analysis(PCA). The simplified samples are trained to be decided the type of crack using Support Vector Machine(SVM). In order to reflect the directional imformation in detail, the LBP processed image is devided into nine sub-blocks. In this paper, driving tests were performed 10 times and 12,000 image data were applied to the proposed algorithm. The average accuracy of the proposed algorithm with sub-blocks is 91.91%, which is about 6.6% higher than the algorithm without sub-blocks. The LBP-PCA with SVM applying sub-blocks reflects the directional information of the crack so that it has high accuracy of 89.41% and 88.24%, especially in transverse and longitudinal cracks. In the performance analysis of different crack classifiers, the F-Measure, which considered balance between the precision and the recall, of alligator cracks classifier was the highest at 0.7601 and hence crack detection performance is higher than others.
1. Introduction
The road pavement is damaged by various physical influences, which can influence to the congestion of traffic. If cracks start to be generated, it is extended to be more significant damages by the continuous physical bumping from the wheels of vechicles. Therefore, it is required to measure and to repair cracks in the pavement at an early stage. In the past, the cracks of pavement were monitored manually. However, the manual inspection is not only time-labour consuming but also it is not accurate enough so that most studies recently aim to find out and to repair the cracks quickly and effectively from the pavement. Common crack identification and detection methods include image processing, machine learning and 3D image-based methods (Lin et al. Citation2019, Cao et al. Citation2020), simultaneous, linear laser thermal imaging scanning method (Jang and An Citation2018) and vibration-based crack identification method are also applied to effectively and quickly detect cracks. Cubero-Fernandez et al. (Citation2017) evaluated the type of cracks in the pavement. Typically, the crack is mainly classified into three categories: transverse cracks, longitudinal cracks, and alligator cracks. The purpose of this paper is to evaluate the damage of the road surface by extracting cracks from the image and classifying cracks. Chen et al. (Citation2019) proposed the algorithm for the automatic crack detection in pavement based on image recognition.
Research on crack detection and identification of complex pavements is in a diversified development. There are both traditional detection method using image processing and detection technology based on machine vision, neural network and fuzzy set theory. However, there is a technical challenge for crack detection due to the complexity of the actual road and the limitation of experimental conditions. Pavement crack detection algorithm based on pixel segmentation is mainly based on extracting the features of crack pixels from global images. It means that the crack region can be segmented from the background image of the road surface by different features. The grayscale threshold segmentation method mainly used the characteristics of the low grayscale value of pavement cracks. The image pixels are divided into the background and crack regions according to the grayscale value by selecting appropriate thresholds. The grayscale threshold segmentation algorithm had simple principle and fast calculation and had been widely used in the automatic detection of pavement cracks. Kim (Citation2000) compared the effects of four threshold segmentation methods: regression method, Otsu threshold, Kittler threshold and relaxation factor method. Although the regression method is effective for crack detection, the universality of this algorithm is weakened by manually setting up a regression model for different data sets. Cheng et al. (Citation1999) applied the fuzzy set theory to the segmentation and recognition of pavement crack targets, built the difference image using the original image and the blurred image, and performed the threshold segmentation on the difference image according to the fuzzy segmentation theory. However, this method can lose detailed information of the crack and the calculating time is long.
Since the pavement crack has clear edge characteristics, the image segmentation method based on edge detection is widely used for pavement crack detection. Yan et al. (Citation2007) convolved the pavement crack image by designing the multi-directional Sobel operator, taking the maximum response value as the edge point, and then segmenting and extracting the crack target. The algorithm is simple to implement and has a low edge-miss detection rate, but it has the disadvantages of generating an false edge due to the influence of noise, difficulty in determining the segmentation threshold, and unstable detection effect. The traditional edge detection method only extracts local edges according to the variation of grayscale between pixels but it is also difficult to detect the edges with weak contrast. Tanaka and Uematsu (Citation1998) applied morphology methods to detect pavement cracks and combined morphological corrosion, expansion, opening and closing operations to extract linear targets from pavement crack images. In order to increase the accuracy of pavement crack detection, this method has the effect of transforming a road image into that with a strong marginality by constructing a multi-scale morphological operator, but the excessive thresholding makes the method less useful. Therefore, image analysis methods such as image multi-scale function and wavelet transform were used for pavement crack detection to further enhance the crack target. Subirats et al. (Citation2007) introduced an image decomposition method based on wavelet transform in pavement crack detection. Wavelet decomposition and correlation coefficient transformation was performed on the pavement image to strengthen the crack edge, and then the crack region was segmented according to the threshold. Subsequently, the wavelet multi-scale transform and the continuous wavelet transform are used to detect the cracks on the road surface, and a certain effect is obtained on the extraction of the fine cracks.
As the research and application of pattern recognition technology has been developed, many researchers has attempted to identify crack targets by extracting local features of road surface crack images for learning and training. These methods generally divide road images into several images for identification, which can improve the crack recognition accuracy by extracting effective classification features and designing a reasonable classification model. Cubero-Fernandez et al. (Citation2017) improved BP algorithm to accelerate the convergence speed of the algorithm. The texture features of pavement crack sub-blocks are extracted by LBP algorithm, which can be an input of the SVM classifier for the recognision. The revognition of cracks is more effective in the features with clear crack texture. The method based on sub-block recognition mainly used one or a certain type of features of the road surface image, and achieves a good recognition effect with less noise interference. However, the single feature recognition method is not able to extract road cracks accurately in the actual working environment due to the influence of illumination equipment and road noise. Therefore, there have been studies to extract multi-feature information of road crack images to improve the robustness of the detection algorithm. Song et al. (Citation2021) propsed the robust principal component analysis and the SVM for detection of microcracks using distributed optical fibre sensors.
Since the interference of complex noise in the actual environment of road pavement is always a major factor limiting the accuracy of pavement crack detection, the studies of pavement crack detection algorithms conducted so far, whether based on pixel segmentation or sub-block recognition algorithms, are the development trend of multifunctional automatic detection technology. In this paper, an automatic crack detection system for road pavement was proposed through the video and GPS (Global Position System) data obtained from the driving test. The acquired video data is converted into each frame to be used as input data for the proposed LBP-PCA-SVM operator. The LBP operator is used to calculate the histogram to extract the features of image, and then PCA is used to reduce the dimension of histogram. SVM is applied to construct a crack recognition and classification of crack types. In order to extract the specific information of crack types, the sub-block method was used to obtain a clearer shape of the crack.
2. Data collection
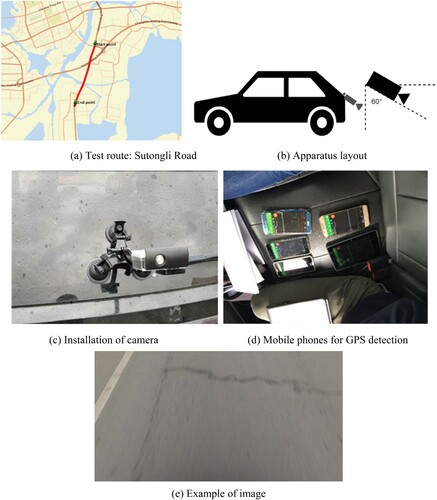
Driving tests were performed on selected route as shown in (a) to collect video of the pavement. The image data were collected from twenty times round trips with a speed of 40 km/hour on a Su Tong Li road in Suzhou, China and its total length was 3.8 km. A sports camera with 4k resolution was used for collecting the image of pavement surface. The compact size of the sports camera makes it easy to install, and it has enough resolution for acquisition. In order to compare the images of pavement, it was necessary to fix the camera on the vehicle before the experiment. The distance between the camera and the pavement is 1 m and the angle of camera has 30 ° to the ground and details of apparatus is shown in (b). A tripod was installed at the back window of the car to minimise the vibration of camera as shown in (c). GPS information is also collected by several mobile phones during the driving tests (see (d)). In this paper, field tests were conducted by using a camera and a mobile phone used in daily life. The purpose of this paper is not to find cracks with one or two images obtained by highly accurate sensors. Although the resolution of the camera is relatively lower than accurate sensors, the objective of the paper is to find a crack using the proposed analysis method in this paper. Based on this analytical solution, cracks on the pavement can be identified by numerous image data obtained in daily life. (e) shows an example of an image taken in the field test which is identical to the image taken with a typical camera.
Figure 1. Overview of driving tests.
3. Proposed method
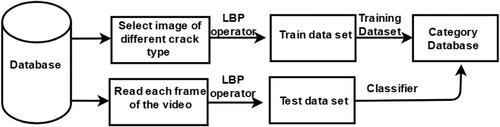
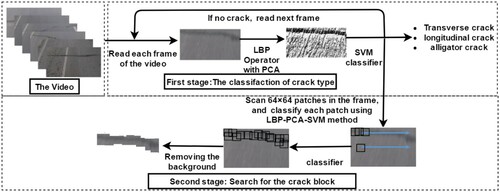
Even if the resolution of the image data is not high, this study attempts to find cracks by analyzing a large number of image data by machine learning. A new method for pavement crack detection based on LBP-PCA-SVM proposed in this paper to find out the crack in each frame of collected video. shows a simplified flowchart that describes the main steps of LBP-PCA-SVM method. After the application runs and initialises video, the detection algorithm is first started on each acquired frame to detect whether there is a crack, until the complete segment video is finally processed. The algorithm processes each frame, converting it from RGB (Red Green Blue) to a grayscale gamut and discarding unnecessary colour components. Then, grayscale frames are processed by classifiers based on LBP feature at the same time. When one of the three classifiers detects a crack, it provides a rectangle that matches the region where the distressed frame was detected. This information is combined with the original RGB frame of the drawn rectangle, which highlights the location of cracks in the frame. Finally, the output frame with overlapping sub-rectangles displays the name and number of the detected crack category.
Figure 2. The simplified flow chart of the automatic classification of pavement crack.
shows a schematic diagram of the method in this paper. Each frame converted by the collected video is captured the features of the frame by the LBP-PCA operator. The featured images are divided into different categories by the SVM classifier, if there is a crack in the image. Then, sliding window having a 64X64 pixel size will traverse the entire image, and another trained sub-block training set will determine whether there is a crack in the sliding window. Through this process, the non-cracked block is deleted from the image. If the classifier is not able to detect crack in the processed frames, the algorithm continues the iteration of the recognition until stops the recognition process. If a crack is detected by the algorithm, the algorithm automatically provides the location of the crack by using the information from the GPS module. Then, final crack image data can be saved as JPG format, and the recognition result can be obtained which are the name of the identified crack point, number and location of crack, and the date and time of collected data.
Figure 3. Overview of the proposed LBP-PCA-SVM method.
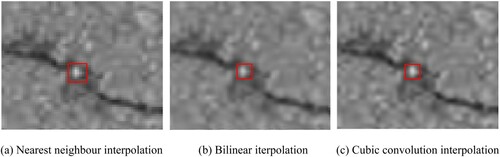
3.1. Normalisation of image size
Images of each road in the training set are inconsistent in terms of image size. When feature extraction is used for images of different sizes, it is not able to effectively train the features of images, resulting in specific difficulties in subsequent recognition and crack detection. Therefore, the collected images need to be normalised in size: the size of all images were unified in this article as 512 × 512 pixel size. Traditional Algorithm for image size conversion include nearest neighbour interpolation, bilinear interpolation, and cubic convolution interpolation. The deepening of jagged edges can be clearly obseverd in the red box marked on the image after the method of nearest neighbour interplolation (see (a)). Because the nearest neighbour interpolation is not able to consider the change of the surrounding image colour, the image aliasing can be deepened. The degree of aliasing using bilinear interpolation is much lower than using nearest neighbour interpolation, but the edges of the colour are still limited by the algorithm, resulting in some aliasing (see (b)). The image obtained by the bilinear interpolation algorithm has better edge smoothness than the image obtained by the nearest neighbour interpolation, and the degree of aliasing is also slightly improved. The cubic convolution interpolation has clearer image information (see (c)). Overrall, the neighbourhood interpolation can cause some losses in image quality, such as producing more visible saw tooth or mosaic blocks in the image. Although the cubic convolution interpolation method can produce a clearer image edge, meanwhile the calculation accuracy is higher, the amount of calculation is too large. Therefore, this paper adopts the bilinear interpolation algorithm: the algorithm is improved based on the nearest neighbour interpolation, and the final result is obtained after interpolations; first the calculation carried on in the horizontal x-direction, then in the vertical y-direction. The bilinear interpolation algorithm not only has a small amount of computation but also does not deteriorate the quality of the normalised image, which is consistent with the requirements for image size normalisation.
Figure 4. Comparison of different normalisation method.
3.2. Selection of training samples
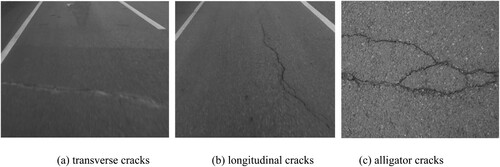
Recently, many studies have been conducted on crack detection. However, most studies use images collected in their own experiments as a database, so there are significant differences in crack image type and quantity, and there is no diversity in samples. Therefore, the final recognition accuracy of the crack is also not high. In this paper, there are three types of categories as a crack type, which include transverse cracks, longitudinal cracks, and alligator cracks as shown in (Johnson Citation2000). A total of 150 crack images were used for training in machine learning, 100 were collected, and the remaining 50 were collected by external data to consider diversity of crack. In order to identify the accuracy of the algorithm proposed in this paper, each frame of the video collected from site was used for testing.
Figure 5. Three main types of cracks.
3.3. Feature extraction based on Local Binary Pattern (LBP)
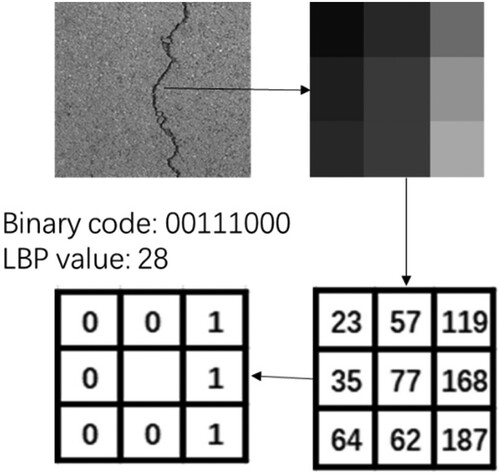
LBP operators have been widely used in texture classification, image and video retrieval and face recognition (Ojala et al. Citation2002). The local binary mode is a texture description operator in the gray range. The original LBP operator defines a 3 × 3 window (texture unit), and then the gray value of the centre pixel is regarded as a threshold value, and then the center pixel is compared with the adjacent 8 pixels. If the surrounding pixel value is greater than the value of the centre point, the pixel position is marked as 1, otherwise 0. Thus, an 8-bit binary number can be generated at 8 points in the 3 × 3 neighbourhood, and then an integer is obtained by assigning different weight values according to the position, and the integer is the LBP value of the window. The equation is as follows:
(1)
(1) where,
is the pixel value of the centre pixel of the window,
is the gray value of the eight connectivity pixels, and s(x) is a banalisation function, which is defined as follows:
(2)
(2)
The texture feature can be described by the histogram after the LBP analysis. The binary number of 33 patterns is 8; the total combination of LBP operators is 256(
). After the feature description, the texture feature points, the edge and spot can be included in a histogram which is formed by LBP cedes. The extraction process is shown in . The basic operation of LBP is to compare the center pixel with neighboured 8 pixels, and then sum the value to get the LBP value. If the gray level of the neighboured pixel is greater than or equal to the central pixel, mark it as 1, otherwise mark it as 0. As shown in a 3 × 3 sliding window, the gray of the center pixel is 77, and the value of the surrounding is 23 less than 77, and it is recorded as 0. If the Bibary code (s(x)) is calculated as 00111000, the LBP value is obtained as 28 by the following equation:
. Therefore, the LBP value has a value between 0 and 255. If this operation is applied to all pixels, LBP values converted to a decimal value can be obtained.
Figure 6. Basic LBP operator.
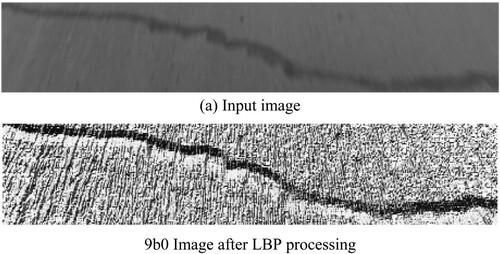
shows the comparison between original image and image obtained by using the basic LBP feature operator. Based on driving test, crack image can be obtained as shown in (a). When the LBP calculation process is performed as shown in , an LBP-processed image is obtained as shown in (b). It can be seen that the contrast of the image after the LBP process becomes more clearly than original image. Because the banalisation function can make the features of gray values simpler. Since the features of the crack are more clearly expressed in the LBP image, it can help to proceed with the subsequent categorisation process.
Figure 7. Comparison between original image and LBP image.
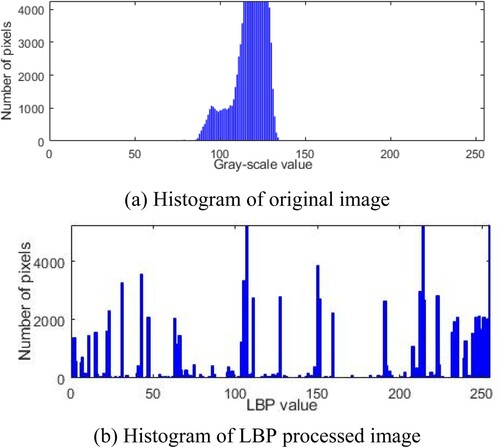
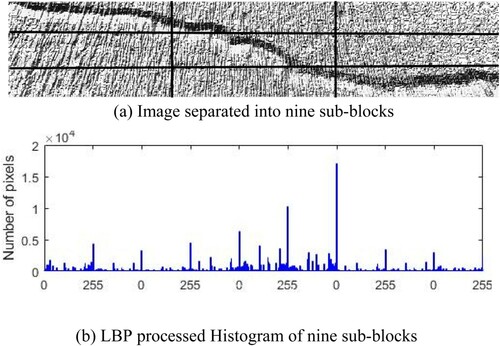
shows the histogram change of the grayscale original image after the LBP process. The original image has a grayscale ranging from 85 to 135 in the histogram. The grayscale representing the background image is intensively distributed between 110 and 130, and the grayscale representing the crack is distributed between 90 and 100 (see (a)). However, intensively distributed grayscale values can be shifted in the histogram due to the effect of the image contrast and shadow effect. It means that the grayscale value is not a determined by the relationship between pixels. This value is an absolute value obtained according to the circumstance of the site, so that the histogram can be changed due to the image contrast. However, LBP pixel values are calculated by considering the correlation with neighboured pixels in the LBP operation and hence features can be extracted regardless of the contrast of the image as shown in (b). The LBP pixel value contains more detailed information in the LBP-processed histogram because the directionality of the bright pixel value among neighboured pixels is contained in the LBP value. The feature of the LBP-processed histogram can facilitate the subsequent classification process. However, it is possible that the histogram evaluated over the entire image is not contained information on the overall directionality of the pixel representing the crack. Therefore, the histogram was reevaluated by applying a sub-block in this paper.
Figure 8. Comparison of histograms between original image and LBP processed image.
The purpose of this paper is to classify cracks in pavement into four categories: transverse crack; longitudinal crack; alligator crack; and none crack. Therefore, not only the features of the crack can be obtained by the LBP value, but also the direction information of the crack has to be included. In this paper, the LBP-processed image was split into nine windows so that the directionality of the crack could be included in the LBP histogram (see (a)). The histograms of each block were connected to express the fatures of the crack image (see (b)). Applying sub-blcok can provide a global description of distribution characteristics in the transverse or longitudinal cracks, which is helpful to improve the classification of crack types.
Figure 9. LBP feature extraction using sub-blocks.
3.4. Principal Component Analysis (PCA) combined with LBP
Each frame was converted from the video obtained the field test, and it is required to reduce the analysis time in order to analyze a large number of images. Principal component analysis (PCA) method can reduce the dimensionality of high-dimensional data, which can save a lot of time for the analysis within an acceptable information loss. The PCA method makes the data set easier to use and effectively removes image noise as well. PCA is one of the multivariate analysis techniques (Wold et al. Citation1987) and then Fukunaga and Koontz (Citation1970) has revised the method several times. The main technical core of PCA is to represent high-dimensional sample data into low-dimensional data by linear transformation on the basis of original data so that their dispersion in low-dimensional data is maximised, which makes it easier to classify and to display images. The essence of PCA is to find the best projection direction, which represents the original data under the condition of least mean square. PCA can reduce the dimension of the feature space that determines the size of data. The training set has C kinds of images in total, and each class has M images , where each image is a two-dimensional array with an intensity value can be converted into a vector of m by n pixels. The training set is defined by
, then the covariance matrix is defined as:
(3)
(3) where,
, which represents the all the training data, and
is the mean image of the training set. Then, the eigenvalues and eigenvectors are calculated from the covariance matrix. Let P = (p1, p2 … , pr) (r < N) is r normalised eigenvectors corresponding to r maximum eigenvalues. Each r eigenvector is called an Eigen image. Now, each image of the training set is projected into the feature space to obtain its corresponding feature Yk, which is defined as:
(4)
(4) where,
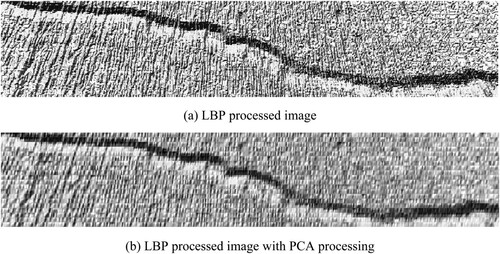
is the average subtractive image k of X. PCA extracts the global grayscale features of the whole image. The global features are useful and important. But the global nature of the fractures is environmentally sensitive. We already selected some local functions to help global functions solve this problem. Therefore, this paper introduces the local binary mode (LBP) for local feature extraction. As shown in , the LBP-processed image is converted by PCA-processed image without significant information loss. Unlike the LBP-processed image in which the pixel values show a large difference from the neighboured pixels and the dots are ruthlessly stamped on the image, it can be seen that the values of the adjacent pixels are neutralised each other in the image converted by PCA.
Figure 10. Effect of pCA procssing.
3.5. Support vector machine
In order to categorise the crack types in this paper, a machine learning algorithm as a statistical learning theory, Support Vector Machine (SVM), was applied. The main function of SVM is to find out a hyperplane to meet the requirement of categorisation (Luo et al. Citation2013). The support vector tries to find the maximum interval between classes and ensure accuracy. The feature of a crack is described by LBP operator so that the crack recognition is a nonlinear classification model. In this classifier, the input data is in a high dimensional feature space, and the data cannot be separated. A nonlinear mapping function, is used for efficient computation of inner products to map a single vector to a vector of higher dimensionality. Common kernel functions include linear, polynomial, RBF and sigmoid. Changes in the form and parameters of kernel functions implicitly change the mapping from the input space to the feature space, then affect the characteristics of the feature space, and ultimately change the performance of various kernel function methods (Zhang et al. Citation2020). RBF kernel function is applied in this paper.
4. System performance evaluation
In order to verify the effectiveness of the SVM classification algorithm based on the LBP operator with PCA as a classification of pavement crack, an accuracy analysis was performed. The results of applying and not applying sub-block was also compared to verify the effect of sub-block on classification by SVM. In this analysis, 100 images for each crack type were randomly selected from image collected by the driving test for the training. 400 hundred images of different crack type were used for the testing. The computation of the algorithm was performed by Matlab 2017b software. shows the average accuracy of the SVM clacification using sub-blocks in the LBP operator, 91.91%, which is about 6.6% higher than the method using only LBP. The SVM classification using sub-blocks in the LBP operator has higher recognition accuracy in all cases of cracks. In the case of the alligator crack, the shape of the alligator crack within the sub-block is still similar to that of the image without the sub-block applied. Therefore, in the case of alligator cracks, accuracies of both the SVM methods with and without sub-block have higher than 95%. However, in the case of transverse and longitudinal cracks, recognition accuracy is higher than 10% in the SVM method to which the sub-block is applied. Therefore, the LBP image to which the sub-block is applied has higher accuracy than the method of analyzing through the whole image because information about the direction of the crack is contained in each divided sub-block.
Table 1. Results of crack classification.
In order to evaluate the performance of the proposed method against the most advanced methods, the performance analysis in terms of precision, recall, accuracy and F measure for each classifier was performed. These indicators are based on the true positive (TP) which represents the correct decision of the classifier when a positive sample is detected, true negative (TN) which represents the correct decision of the classifier in the presence of negative samples; false positive (FP) is the negative sample marked as positive; and false negative (FN) occurs when a positive sample is rejected by the classifier ().
Figure 11. Predition of performance of proposed method.
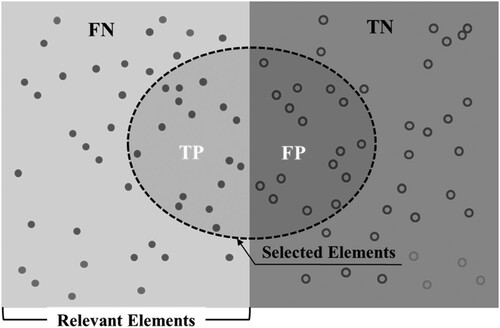
Precision is the estimated probability that a sample randomly selected from the pool of retrieved samples is relevant and recall is the estimated probability that a sample randomly selected from the pool of relevant samples is retrieved (Cakir et al. Citation2019). Precision can be seen as a measure of quality, and recall as a measure of quantity. Higher precision means that an algorithm returns more relevant results than irrelevant samples, and high recall means that an algorithm returns most of the relevant results whether or not irrelevant ones are also returned. Precision is calculated as follows:
(5)
(5) Recall index allows to measure the classifier’s ability to recover the maximum number of relevant samples:
(6)
(6)
The accuracy measure allows to evaluate the accuracy of the classifier by calculating the ratio between the true (positive and negative) results and the total number of checked samples. It is calculated as follows:
(7)
(7)
Precision and recall have a trade-off relationship. If the precision is increased, the recall is decreased. Depending on which of these two numbers is priority, you should lower or increase one number.
Depending on which of these two values is assigned to the priority, one should be lowered or higher. In order to find the balance between the precision and the recall, F-measure was proposed, which is a classification evaluation value considered both precision and recall (Powers Citation2011). F-measure can be calculated by following equation:
(8)
(8)
In order to evaluate the performance of the proposed method, 1000 crack images in jpg format are manually collected to create a set of positive samples and a set of negative samples. Then, three test sets containing 1000 images can be defined as follows: 30% of the images are negative samples; 20% of the images are positive for training; and 50% of the images are new positive samples. Samples of training and testing used in this analysis were frame images from video. These test sets are then used to evaluate the performance of each classifier. shows the performance of the three classifiers in terms of accuracy, recall, and F-Measure. In the precision, the transverse crack classifier has the highest performance as 0.7581, and the alligator cracks classifier has the highest performance as 0.7696 in the recall. The F-Measure, which considered both the precision and the recall of alligator cracks classifier was the highest at 0.7601, and that of the longitudinal cracks classifier was the lowest at 0.7413. Therefore, the alligator cracks classifier maintains highest balance between the precision and the recall and hence crack detection performance is higher than others.
Table 2. Performance of the three developed classifiers in terms of precision, recall and F-measure.
5. Conclusions and future work
The crack detection is critical to the rapid and intelligent maintenance of infrastructures. It is required to detect cracks in advance as they can lead to further breakage of the pavement. In this paper, a study was conducted to detect and to classify cracks by analyzing images of road pavements obtained by driving tests. The detailed conclusions are as follows.
The converted images from the video obtained by several driving tests were analyzed by combining the LBP operator and PCA method to capture the features of the crack included in the image. A new pixel value can be calculated by the LBP operator using the correlation with neighboured pixels, and hence the result in which the gray scale of pixels is clearly distinguished from the original image can be obtained. The PCA method was applied in this study in order to reduce the dimensionality of the numerous LBP processed images having a high resolution without significant information loss. The accuracy obtained by the SVM classification algorithm is 85.29%.
The image after feature extraction through LBP-PCA is divided into nine sub-block that directional features can be reflected in detail in a histogram. The average accuracy obtained by the SVM classification method is 91.91% in case applied sub-block. Transverse cracks classifier applied with sub-block were approximately 16% higher than those without sub-block, and longitudinal cracks were approximately 12% higher than those without sub-block. An average accuracy of the method with sub-blocks has about 6.6% higher than that of the method without sub-blocks. Therefore, it can be seen that the directional features of the cracks in the longitudinal and transverse are reflected in more detail by applying the sub-block.
In order to verify the performance of the proposed LBP and PCA with SVM method in this paper, the performance analysis in terms of precision, recall, accuracy and F-measure for each classifier was performed. The F-Measure, which considered both the precision and the recall of alligator cracks classifier was the highest at 0.7601, and that of the longitudinal cracks classifier was the lowest at 0.7413. Therefore, the alligator cracks classifier maintains highest balance between the precision and the recall and hence crack detection performance is higher than others.
Disclosure statement
There is no potential conflict.
References
- Cakir, F., et al., 2019. Deep metric learning to rank. Proceedings of the IEEE Conference on Computer Vision and Pattern Recognition, 1861–1870.
- Cao, W., Liu, Q., and He, Z., 2020. Review of pavement defect detection methods. IEEE Access, 8, 14531–14544.
- Chen, C., et al., 2019. Automatic pavement crack detection based on image recognition. International Conference on Smart Infrastructure and Construction 2019 (ICSIC), Cambridge, UK.
- Cheng, H. D., et al., 1999. Novel approach to pavement cracking detection based on fuzzy set theory. Journal of Computing in Civil Engineering, 13 (4), 270–280.
- Cubero-Fernandez, A., et al., 2017. Efficient pavement crack detection and classification. EURASIP Journal on Image and Video Processing, 39, 1–11.
- Fukunaga, K., and Koontz, W. L. G., 1970. Application of the Karhunen-Loeve expansion to feature selection and ordering. IEEE Transactions on Computers, C-19 (4), 311–318.
- Jang, K., and An, Y.-K., 2018. Multiple crack evaluation on concrete using a line laser thermography scanning system. Smart Structures and Systems, 22, 201–207.
- Johnson, A. M., 2000. Best practices handbook on asphalt pavement maintenance. Minnesota Technology Transfer/LTAP Program, Center for Transportation Studies.
- Kim, J. K., 2000. Statistical analysis of video images for evaluating pavement distress. KSCE Journal of Civil Engineering, 4, 257–264.
- Lin, W., et al., 2019. Real-time comprehensive image processing system for detecting concrete bridges crack. Computers and Concrete, 23 (6), 445–457. doi:https://doi.org/10.12989/CAC.2019.23.6.445.
- Luo, Y., Wu, C. M., and Zhang, Y., 2013. Facial expression recognition based on fusion feature of PCA and LBP with SVM. Optik-International Journal for Light and Electron Optics, 124 (17), 2767–2770.
- Ojala, T., Pietikäinen, M., and Mäenpää, T., 2002. Multiresolution gray-scale and rotation invariant texture classification with local binary patterns. IEEE Transactions on Pattern Analysis & Machine Intelligence, 24, 971–987.
- Powers, D. M. W., 2011. Evaluation: from precision, recall and F-measure to ROC, informedness, markedness & correlation. Journal of Machine Learning Technologies, 2 (1), 37–63.
- Song, Q., et al., 2021. Robust principal component analysis and support vector machine for detection of microcracks with distributed optical fiber sensors. Journal of Mechanical Systems and Signal Processing, 146, 1. doi:https://doi.org/10.1016/j.ymssp.2020.107019.
- Subirats, P., et al., 2007. Automation of pavement surface crack detection using the continuous wavelet transform. IEEE International Conference on Image Processing. doi:https://doi.org/10.1109/ICIP.2006.313007.
- Tanaka, N., and Uematsu, K., 1998. A crack detection method in road surface images using morphology. IAPR Workshop on Machine Vision Application, Makuhari, Chiba, Japan.
- Wold, S., Kim, E., and Paul, G., 1987. Principal component analysis. Chemometrics and Intelligent Laboratory Systems, 2 (1–3), 37–52.
- Yan, M., et al., 2007. Pavement crack detection and analysis for high-grade highway. International Conference on Electronic Measurement and Instruments. doi:https://doi.org/10.1109/ICEMI.2007.4351202.
- Zhang, F., et al., 2020. A new identification method for surface cracks from UAV images based on machine learning in coal mining areas. Remote Sensing, 12 (10), 1571. doi:https://doi.org/10.3390/rs12101571.