
 ?Mathematical formulae have been encoded as MathML and are displayed in this HTML version using MathJax in order to improve their display. Uncheck the box to turn MathJax off. This feature requires Javascript. Click on a formula to zoom.
ABSTRACT
Oxidative ageing in field asphalt pavements is a complex process with coupled multiple physics. This parametric study uses Multiphysics modelling approaches to evaluate the effects of material thermal properties, air voids content and distribution, mastic coating thickness, oxygen accessibility and binder oxidative kinetics on the spatial and temporal evolution of the oxidative ageing in the asphalt pavements. Results suggest that increasing the thermal conductivity of asphalt layers leads to a lower ageing gradient. The variations of base and subgrade layers’ thermal properties cause little to no effects on the oxidative ageing. A high activation energy of the asphalt binder (e.g. by adding anti-ageing additives) reduces the oxidative ageing significantly. Asphalt layers built on unbound granular base will experience greater overall ageing with a C-shaped ageing gradient compared to that built on treated base. Air voids content of <5% yields limited oxidative ageing. Five to nine percent air voids generate a gradually increased oxidative ageing with an obvious gradient across pavement depth. Air voids content beyond 9% leads to a consistently high oxidative ageing due to a full access to the oxygen. Finally, the findings were validated using available literature results and field data from 14 European road sections.
1. Introduction
Non-uniform temperature distribution within pavement depth causes oxidative ageing and pavement modulus gradients to exist (Hall et al. Citation2012, Yin et al. Citation2017). According to Lu et al. (Citation2009), the performance of asphalt pavements is closely related to the temperature profile, and the influence of temperature on pavement performance can be more significant than that of loading level and duration (Lu et al. Citation2009). Further studies revealed that reduction of the temperature by several degrees was easily possible with positive implications on pavement mechanical response and environment (Hall et al. Citation2012). Internal factors govern the temperature profile, including the thermal properties of paving materials, the thickness of layers, and the presence of thermal isolation fillers. These factors can be altered to control the temperature profile to some extent. Whereas the external factors, including the atmospheric temperature, geographic location, and earth temperature, cannot be controlled. Enhancing the thermal properties of asphalt pavement (to cool down its temperature) by adding thermal modifiers or isolators to prevent excessive thermal exposure is more practical than replacing paving materials with other substances or changing the thickness of pavement layers. Several studies have quantified the effect of thermal parameters on the temperature profile of asphalt pavements (Solaimanian and Kennedy Citation1993, Gui et al. Citation2007, Lu et al. Citation2009, Wang et al. Citation2010, Bobes-Jesus et al. Citation2013, Alavi et al. Citation2014, Chen et al. Citation2015, Chen et al. Citation2017). However, there are limited research outputs that measure the direct impact of thermal properties of paving materials on the content and distribution of oxidation products like carbonyl and sulfoxide in the field asphalt pavements. Therefore, it is vital to understand the effect of thermal properties on the temperature profile of asphalt pavement, and subsequently on the degree and extent of oxidative ageing to mitigate performance deterioration due to long-term thermal exposure and oxidation.
Oxidation kinetics of bitumen is one of the key elements determining the rate of oxidative ageing. They are particularly important because studies recognised that binders of the same temperature performance grade do not necessarily achieve the same ageing performance (Rochlani et al. Citation2020); this can be attributed to differences in the oxidation kinetics. The activation energy required to cause oxidation in binders was found to be a good indicator of their ageing susceptibility (Liu et al. Citation1996, Glover et al. Citation2009, Omairey et al. Citation2019, Liu et al. Citation2021). Luo et al. (Citation2015, Citation2018, Citation2019) and Wang et al. (Citation2015) adopted similar kinetics-based ageing modelling concepts and formulations to represent the physical and chemical dynamics of pavement materials (Luo et al. Citation2015, Wang et al. Citation2015, Luo et al. Citation2018, Luo et al. Citation2019, Li et al. Citation2021). The activation energy is a binder-source dependent parameter; it is the energy required to establish a chemical reaction between oxygen and bitumen, measured in units of (kJ/mol). A high activation energy is desirable because it means the binder is insusceptible to oxidation. In contrast, low activation energy indicates the binder can age faster, i.e. more susceptible to oxidative ageing. It is found that the activation energy can be altered by the inclusion of additives (e.g. anti-ageing compounds) to the bitumen (Omairey et al. Citation2019, Omairey et al. Citation2020, Gao et al. Citation2021, Gu et al. Citation2021). However, the scale of this alteration in the activation energy on the field ageing of asphalt pavements is still ambiguous, particularly under a complex environmental condition including coupled temperature and oxygen distribution in the pavement structure.
Another main physics affecting the oxidative ageing process is oxygen diffusion. Oxygen diffuses from the atmospheric environment to asphalt pavements to react chemically with bitumen forming carbonyl and sulfoxide functional groups. Therefore, the availability of oxygen is essential to feed this oxidative chemical reaction. This sensitivity analysis study considers three parameters directly linked to the content and distribution of oxygen pressure within the asphalt pavement structure. These parameters are (1) accessibility to oxygen from the lower boundary of asphalt concrete (AC) layer, (2) distribution of air voids across pavement depth, and (3) the overall air voids content.
The oxygen accessibility from top and bottom boundaries of the asphalt layer can influence the oxygen diffusion and thus affecting the oxidative ageing profile in the pavement structure. The surface of asphalt concrete commonly experiences a higher degree of oxidative ageing than that for asphalt at deeper layers (Han Citation2011, Glover et al. Citation2014, Yin et al. Citation2017). This is a result of higher temperatures and easy access to oxygen from atmospheric air. There is debate on the carbonyl area distribution pattern and the factors that contribute to it, such as porosity of underlying layers and air voids distribution and content in the asphalt pavements. For instance, it is believed that using a treated base or milling techniques (for new overlays) will reduce the ageing of asphalt pavement (Luo et al. Citation2018). Thus, this study investigates the effect of oxygen accessibility at the lower boundary condition of AC layer on the carbonyl area profile after one year of field ageing simulation.
The air voids distribution and air voids content are another two influencers on oxygen pressure distribution, leading to the variations of the oxidative ageing profile within the asphalt pavements. Many studies were focused on characterising air voids distribution within the pavement structure in terms of air voids content, number and diameter of air voids, and availability of accessible air channels (Castelblanco Torres Citation2006, Caro et al. Citation2010, Han Citation2011, Glover et al. Citation2014, Wang et al. Citation2014, Rose Citation2016, Zhao et al. Citation2019). Results found that a non-uniform C-shaped distribution of the air voids content along the pavement depth is commonly observed in field-compacted samples (Prapaitrakul et al. Citation2009, Zhao et al. Citation2019). The air voids content is less at the middle than at the top and bottom of asphalt layer because of movement constraints and lower temperatures at the top and bottom upon compaction. Digital imaging techniques and volumetric testing protocols were established to determine and thus characterise the air voids distribution. CT-scanning technique measures air voids of diameters not less than 0.0211 mm with usually 0.1 mm vertical intervals (Jiang et al. Citation2020). Recent advancements in quality control measures, design procedures, and materials characteristics ensure the field compaction can achieve desired specifications for the average air voids content. However, it is impossible to guarantee the air voids profile within AC depth is uniform or consistent. For this reason, studies adopted different approaches to model and simulate the volumetric distribution of air voids. For instance, studies that developed mechanical models to represent the asphalt pavement structures either placed air voids randomly in pavement structures (Zhang et al. Citation2018b, Zhang et al. Citation2019) or used probabilistic distribution for the air voids sizes and numbers (Castelblanco Torres Citation2006, Caro et al. Citation2010). In both modelling conditions, there was no defined relationship between the air voids distribution and pavement ageing. Therefore, the current study investigates the significance of air voids content and the voids distribution along depth on field oxidative ageing of asphalt pavements.
The extent of oxidative ageing is also bounded by the film thickness of asphalt mastic surrounding accessible air channels within the asphalt layers. It could be that the thicker the mastic coating film, the less the average carbonyl area will be. Previous studies on laboratory compacted asphalt specimens showed that asphalt mixtures with lower mastic film thickness and better mastic distribution are more susceptible to oxidative ageing, resulting in a dramatic decrease in pavement's resistance to cracking (Jiang et al. Citation2020). For this reason, the current parametric study is also looking into the effect of mastic film thickness on the oxidative ageing propagation.
2. Problem statement and objectives
The existing studies evaluated the influences of pavement material properties, structural parameters or climate conditions on the oxidative ageing in the asphalt pavements, separately. This kind of parametric evaluations is relatively isolated, which means the interactions or constraints between the material, structural and climate variables on the ageing evolution were not accounted for. This may have already resulted in misleading conclusions on the significance of one parameter on the ageing production. The fundamental reason is that the coupling effects or dependency relationships between the ageing Multiphysics (including heat transfer, oxygen diffusion and ageing kinetics) were not addressed or accurately modelled in the ageing prediction programmes. This was not solved until a recent study that the authors developed using a weak form equation-based ageing Multiphysics modelling framework (Omairey et al. Citation2021).
This study uses the recently developed equation-based Multiphysics finite element ageing prediction modelling framework (Omairey et al. Citation2021) to simulate one year of field ageing and identify influential parameters on the oxidative ageing growth and distribution in pavement structures. First, a brief introduction to the ageing modelling framework is presented. A suitable range of values is then identified for each parameter based on the experimental data extracted from an extensive literature search. Parameters covered include (1) thermal properties (thermal conductivity and heat capacity), (2) oxidation activation energy, (3) oxygen accessibility at the base layer, (4) mastic coating film, and (5) air voids content and distribution. Then ageing predictions for each set of parameters are made, analysed and compared with field measurements for validation. The sensitivity analysis focuses on internal parameters associated with material properties, pavement structure, and morphology of asphalt concrete. External parameters, such as climatic region, are covered separately in other research papers (Lu et al. Citation2009, Mallick et al. Citation2009, Hall et al. Citation2012, Omairey and Zhang Citation2021).
3. Multiphysics models and finite element modelling for asphalt pavements
This section briefly introduces the multiple physics that contribute to the oxidative ageing process and the mathematical equations to represent these physics. A Multiphysics finite element framework is developed to integrate these equations into one model and solve them simultaneously. Further details on the model development and validation can be found at (Omairey et al. Citation2021).
3.1. Multiphysics models
Ageing of asphalt materials involves three Multiphysics (1) chemical oxidation reaction in the bitumen; (2) mechanical responses (e.g. altered viscosity); and (3) physical environmental processes (i.e. heat transfer and oxygen diffusion) leading to varying environmental profiles within pavements. These processes are influenced by the microstructural morphology, including asphalt film thickness, pore size, and air void distribution. The interrelationships among these processes are circularly dependent in the dynamic ageing process. Comprehensive mathematical formulas to characterise the nonlinear oxidative ageing process of bitumen in the pavement are listed in (Han et al. Citation2011, Jin et al. Citation2013, Glover et al. Citation2014).
Table 1. Constitutive equations for the physical processes relevant to pavement oxidative ageing.
3.2. Finite element implementation
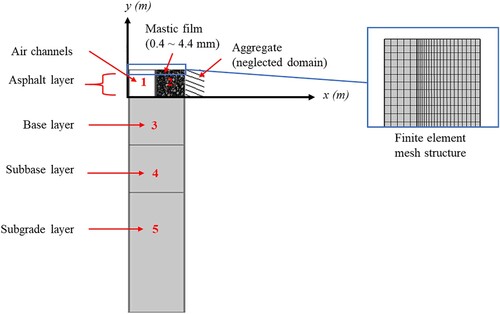
The finite element framework (proposed by Omairey et al. Citation2021) consists of (1) model geometry (physical domains) with specified materials properties for each domain; (2) model physics (represented by the weak form of the partial differential equations (PDEs)); and (3) model parameters, variables, and time-dependent interpolation functions. A two-dimensional geometry was developed (shown in ) with customised dimensions according to pavement structure and volumetric properties of asphalt mixture. The geometry consists of three main domains: (1) interconnected air channels in the AC layer, (2) mastic coating film, and (3) underlying pavement layers (base, subbase and subgrade). Herein, the thickness of the mastic coating film is defined as the diffusion depth (), that is the bitumen mastic coating film thickness that surrounds the interconnected air channels (Glover et al. Citation2014). The overall two-dimensional mesh consists of 15625 domain elements with 1550 boundary elements and 12 vertex elements, all with rectangular geometry. In x-direction, domain 1 (shown in ) consists of five mesh elements of equal lengths and domain 2 consists of twenty mesh elements with a growth ratio of 3. In y-direction, there are 175 elements with a growth ratio of 5 along the asphalt layer depth (domains 1 and 2), 250 elements with a growth ratio of 4 along the base layer depth (domain 3), 50 elements with a growth ratio of 4 along the subbase layer depth (domain 4), and 150 elements with a growth ratio of 3 along the subgrade layer depth (domain 5).
Figure 1. Geometry of the integrated ageing model (not-to-scale). Numbers mark the domains of geometry: (1) interconnected air channels, (2) mastic coating film, (3) base layer, (4) subbase layer, and (5) subgrade layer. Domain 2 has two vertical line interfaces, air-mastic interface and mastic-aggregate interface. Aggregate is not included in the geometry (Omairey et al. Citation2021).
A time-dependent simulation was built using five circularly dependent physics that work simultaneously at certain geometry domains using a weak-form PDE based finite element (FE) modelling technique in Comsol Multiphysics solver. The current model is built entirely using one interface type, the weak-form interface, instead of general form PDE and heat transfer in solids interfaces implemented by (Omairey et al. Citation2021). Thus, it would require minimal users training that otherwise would be needed to learn how to use specialised interfaces. The weak-form PDE-FE is particularly advantageous in solving a coupling problem with circular dependence between the model inputs and the dependent variables (Zhang et al. Citation2016, Zhang et al. Citation2017, Zhang et al. Citation2018a). Model interfaces were built by converting the differential equations listed in into weak-form physics, as shown in . Details of converting the general PDEs into the weak expressions can be found in (Omairey Citation2021).
Table 2. Model interfaces in weak-form partial differential equations (PDEs).
Information such as pavement structure, oxidation kinetics of bitumen, and morphology of mixture was input into the model as parameters, variables, shape functions, and materials properties. Data for road section US277 located in Laredo, Texas, USA were input into the model, as shown in and . These inputs are introduced in the same format as that in the FE model to ease direct implementation. Site-specific hourly climatic data of air temperature, wind speed, solar radiation, albedo, and emissivity were obtained using Climate Tool at the Long-Term Pavement Performance (LTPP) database.
Table 3. Model parameters for road section US277 in Laredo, Texas.
Table 4. Model variables for road section US277 in Laredo, Texas.
3.3. Model validations
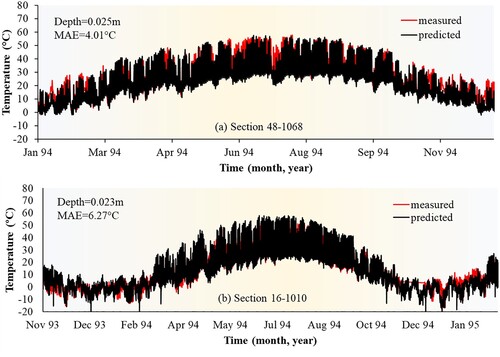
The time-dependent heat transfer interface is independent of the other ageing physics; it was run and validated individually before combining it into the integrated ageing model. LTPP database contains hourly field temperatures of 82 road sections in different climate regions across the United States. They were collected using thermistors installed at several pavement depths for extended time intervals. Three road sections were selected for model's validation (1) road section 48–1068 in Lamar, Texas, USA (in wet, no freeze region); (2) road section 27–1028 in Otter Tail, Minnesota, USA (in wet, freeze region); and (3) road section 16–1010 in Idaho, USA (in dry, freeze region). shows an example of near-surface hourly temperatures for one year of field ageing simulation compared with field measured temperatures. The model appeared to have sufficient accuracy at high temperatures where ageing is more significant.
Figure 2. Predicted and field temperatures for road sections (a) 48–1068 in Lamar, Texas, (b) 16–1010 in Idaho, at depths of 0.025 and 0.023 m, respectively, measured from the surface of the pavement. The mean absolute error (MAE) between the measurements and predictions is shown in each figure.
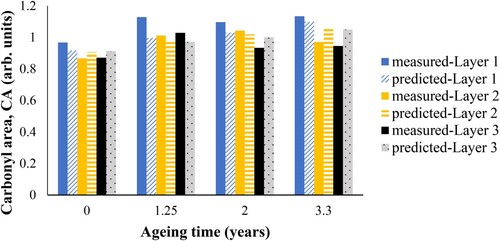
Two road sections were selected to validate the integrated ageing model: US277 and US83, both located in Texas, USA. Oxidation details (carbonyl area) for recovered field binders at these two sections were readily available in the Federal Highway Administration (FHWA) reports (Glover et al. Citation2014) at various ageing periods, in addition to the properties of binders, mixtures, and pavement structures. Aged binders were extracted and recovered from field-aged cores, cut into several slices with a thickness of 12.7 mm, and then tested using FTIR to determine CA values (Glover et al. Citation2009, Han et al. Citation2011, Jin et al. Citation2013). shows the predicted and measured CA values for road section US83 at different pavement layers and different ageing years. Field CA experienced somehow unsystematic changes across AC depth, which is not uncommon in field data. Nonetheless, model predictions were in good agreement with field measurements in terms of oxidation extent and growth pattern. More details on the model validations can be found in the previous publication (Omairey et al. Citation2021).
Figure 3. Comparison between the carbonyl area of recovered field cores and the predicted carbonyl area for road section US83 in Childress, Texas, USA.
4. Parametric analysis of oxidative ageing in asphalt pavements
This section investigates model inputs effect on ageing growth and distribution to identify parameters that play a vital role in the oxidative ageing of asphalt pavement.
4.1. Effects of thermal properties on ageing in pavements
The thermal diffusivity of a material is a term that combines all three pillars of thermal behaviour, that is, thermal conductivity, heat capacity, and density together. It plays a chief role in the heat transfer process. This parametric study focuses on thermal conductivity and heat capacity, without considering the effect of density on ageing evolution. This is because the density falls within a narrow range (i.e. it does not change significantly for the same material type); for example, density ranges for asphalt concrete, base and subbase layers are 2100–2350 kg/m3, 1800–2375 kg/m3, and 1500–2350 kg/m3, respectively (Luca and Mrawira Citation2005, Han Citation2011, Alawi and Helal Citation2014, Hassn et al. Citation2016, Alavi et al. Citation2017, Li et al. Citation2019). Thus, the density will not originate a significant change in the temperature profile when altered. Additionally, changing the density merely to mitigate oxidative ageing is not applicable from a practical point of view, as it is associated with other materials properties and bounded by design limitations. It should also be noted that the influence of thermal properties on the temperature profile of pavement is bounded by the thickness of paving layers. However, just like density, changing layers thicknesses has many economic and design implications; thus, it is kept constant. It should be kept in mind that the results of this parametric study (in terms of the influence of thermal properties on the temperature profile and oxidative ageing products) are sensitive to changes in layers thicknesses. For instance, the temperature at the bottom AC layer becomes less influenced by the temperature of outside atmosphere when increasing the pavement thickness, because of the increased thermal mass of AC materials (Gui et al. Citation2007, Alavi et al. Citation2014).
First, thermal conductivity and heat capacity values for all pavement materials are collected from the literature (Luca and Mrawira Citation2005, Gui et al. Citation2007, Han Citation2011, Alawi and Helal Citation2014, Hassn et al. Citation2016, Alavi et al. Citation2017, Li et al. Citation2019). Then, a range of thermal conductivity and heat capacity values is specified to consider in this parametric study. There is no evidence of important changes in the thermal properties of pavement materials upon ageing (Pan et al. Citation2017); accordingly, the thermal properties are kept constant with time.
This parametric analysis is carried out on road section US277, located in a dry-warm environmental zone because oxidative ageing is more notable in warmer regions. The model is run for one year to consider temperature variations in all seasons.
4.1.1. Thermal conductivity
Thermal conductivity is a material property and a measure of its ability to transfer heat. Materials with low thermal conductivity values have a low heat transfer rate (e.g. thermal isolators); whereas, materials of high thermal conductivity values experience a high heat transfer rate (e.g. metals). The thermal conductivity of the asphalt mixtures can be altered by adding fillers. Chen et al. (Citation2015, Citation2017) found that the thermal conductivity of dense asphalt mixtures increased by 0.5 W/m/K by adding 20% graphite powders to bitumen (Chen et al. Citation2015, Chen et al. Citation2017). Furthermore, aggregate type predominantly influences the thermal conductivity of asphalt concrete mixtures (Qin Citation2016), where it can be reduced by 0.5 W/m/K by replacing 40% of coarse granites with ceramic aggregates.
contains the typical range of thermal conductivity values for all pavement layers (AC, base, and subgrade layers). Three thermal conductivity values are considered for each pavement layer in the parametric sensitivity study. These are the maximum, minimum and mid-range values. One parameter is tested at a time while keeping others at the mid-range. Thus, nine field ageing simulations are set to run.
Table 5. Typical range of thermal conductivity values for different layers of the asphalt pavement.
shows the predicted pavement temperature profile for all thermal conductivity values; results are collected during peak temperatures in the daytime in the summer season. One profile pattern is observed for all thermal conductivity of the asphalt layer () values in this figure, with a temperature variation of 2.5°C at one depth. The peak temperature is recorded at the top surface of AC layer. It then declines gradually in the base layer, rises again at the base-subgrade interface (making an S-shaped pattern), and then decreases in the subgrade to reach the pre-determined earth temperature. This S-shaped formation can be attributed to the existence of higher thermal conductivity value of the base layer compared to that of the subgrade. When this happens, the temperature will easily transport from the heat source (outside atmosphere) into the asphalt concrete and base at a fast rate. Then, the heat transfer rate will drop at the subgrade-base interface. Any excess heat will be trapped in the middle of the AC layer due to the low thermal conductivity of subgrade, causing such a unique pattern. This perhaps designates that a consistent thermal conductivity along pavement depth is desirable to prevent additional temperature absorption and heat storage.
Figure 4. Predicted temperature profiles for road section US277 for different thermal conductivity at peak daily temperature in summer. (a) Temperature profiles across the pavement, (b) asphalt concrete (AC) temperature profiles for different values (c) AC temperature profiles for different
values, (d) AC temperature profiles for different
values. The yellow highlight of the figure indicates data are collected in warm intervals (summer, peak daily temperatures).
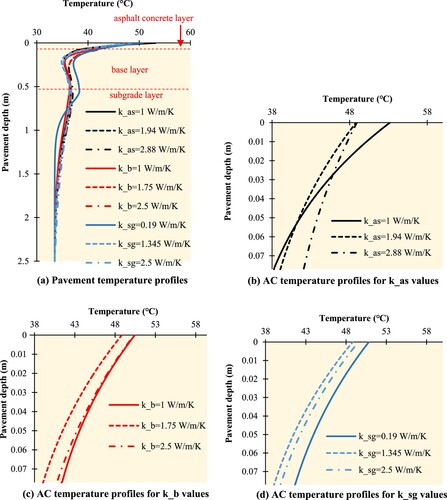
The observed temperature gradient in relation to changes in asphalt thermal conductivity () agrees well with others’ findings, in that, the surface temperature declines with increasing the thermal conductivity of AC while the temperature rises as depth increases (Solaimanian and Bolzan Citation1993, Solaimanian and Kennedy Citation1993, Wang et al. Citation2010, Bobes-Jesus et al. Citation2013). Increasing
lowers the surface temperature and increases the bottom temperature, thus lead to a less temperature gradient in asphalt layer, this can benefit the reduction of the ageing gradient and cracking damage.
Reducing the thermal conductivity of base and subgrade layers did not cause a significant improvement (temperature reduction < 2°C) within the AC layer.
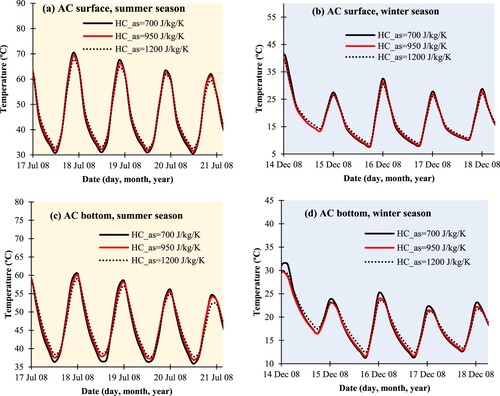
shows the temperature prediction for pavements with different asphalt thermal conductivity values () for four days intervals in the summer and winter seasons at the surface and bottom of AC layer. A nonlinear correlation exists between the AC temperature and thermal conductivity values. The minimum thermal conductivity in the AC layer (
) yielded greater day-to-night surface temperature variations and overall lower variations at AC bottom. Chen et al. (Citation2015) recorded similar behaviour in that the day-to-night temperature gradient decreases by increasing the pavement thermal conductivity (Chen et al. Citation2015). To conclude, increasing
reduces the peak temperature in summer, which can help to minimise rutting damage, and increases the bottom temperature ((d)), which softens the bitumen, leading to less fatigue damage.
Figure 5. Temperature variation with time in asphalt concrete (AC) layer with different thermal conductivity values (kas = 1, 1.94, and 2.88 W/m/K) for summer and winter time intervals at (a) AC surface during summer, (b) AC surface during winter, (c) AC bottom during summer, and (d) AC bottom during winter. The yellow and blue highlights indicate warm and cold intervals, respectively.
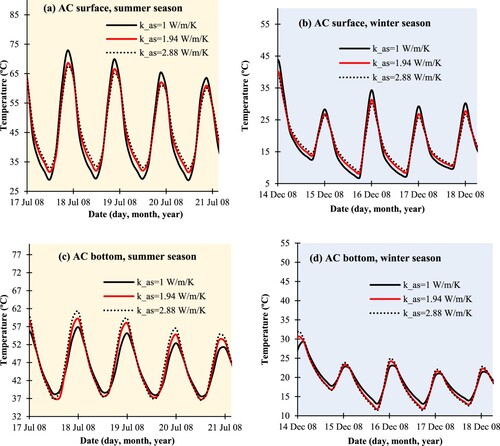
The mean increase in the daily maximum temperature at the top surface of AC layer due to reducing from 2.88 W/m/K to 1 W/m/K is 5°C, and the mean decline in the daily maximum temperature at the bottom of the asphalt layer is 4.1°C. This is an important finding because a 5°C decline in temperature can extend the pavement life by five years (Mallick et al. Citation2009); this could be due to a decline in the oxidative ageing. Thus, the change in carbonyl growth with ageing time is also investigated in this study. shows the carbonyl growth rate at the surface-mastic interface at the top, middle and bottom of the AC layer. The carbonyl indices (CI) (where, CI = (CA of aged binder – CA of unaged binder)*100/CA of unaged binder) at the surface of asphalt pavement at air-mastic interface for
of 1 and 2.88 W/m/K are 22.2% and 17%, respectively after one year of field ageing simulation. The difference in CI makes up a 5% increase per ageing year due to reducing
value from the maximum to minimum.
Figure 6. Carbonyl area at the air channels-mastic interface (CAi) vs. ageing time, for different thermal conductivity values ( = 1, 1.94, and 2.88 W/m/K) at three asphalt concrete (AC) depths (a) AC surface, (b) mid-AC depth, and (c) AC bottom.
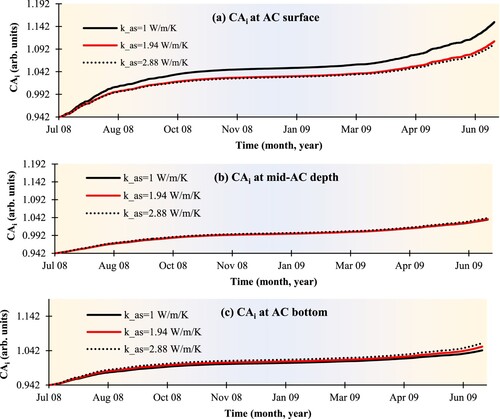
shows the average predicted carbonyl content in the mastic within AC depth for three thermal conductivity values (1, 1.94, and 2.88 W/m/K) for one year of field ageing. Maintaining a low thermal conductivity at the AC layer will cause higher oxidative ageing at the surface that declines gradually at deeper levels. also suggests that increasing lower the ageing gradient, which may help on reducing thermal and top-down cracking.
Figure 7. Average carbonyl area across the asphalt concrete (AC) depth after one-year of field ageing simulation using different thermal conductivity values (). Small sudden jumps/ changes in the curve are attributed to using different mastic film thicknesses across the asphalt depth when calculating the average carbonyl content.
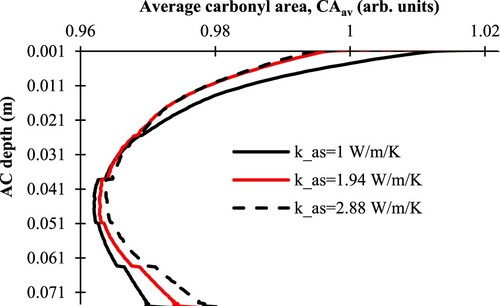
The thermal conductivity of underlayers (base and subgrade) is shown to have a minimal effect on the temperature profile and carbonyl content within the asphalt concrete layer.
4.1.2. Heat capacity of pavement materials
The heat capacity of a material is its ability to store heat. It is measured by the energy required to change the temperature of a certain mass of material by one degree. A high heat capacity value indicates a better ability of the material to maintain its temperature.
contains the typical range of heat capacity values for all pavement layers (asphalt concrete, base, and subgrade layers). Three heat capacity values are considered for each pavement layer in the parametric sensitivity study. One heat capacity value is tested at a time while keeping other parameters at mid-range values. Therefore, nine ageing simulation tests are set to run.
Table 6. Typical range of heat capacity values for different asphalt pavement layers.
Altering heat capacity caused small variation in the temperature profile, as shown in , with a maximum difference of 2°C. Higher temperatures were achieved for = 700 J/kg/K, caused by the rapid change in temperature and the layer's low ability to store or maintain its heat conditions. This suggests using low heat capacity at the surface layer is undesirable. Asphalt pavements with high heat capacity need more time to reach maximum temperatures than those with low heat capacities, which agrees well with other research findings (Yavuzturk et al. Citation2005, Bobes-Jesus et al. Citation2013).
Figure 8. Temperature profiles within the asphalt concrete (AC) layer collected at same peak daytime hour in summer for different heat capacity values at asphalt concrete (), base (
) and subgrade (
) layers.
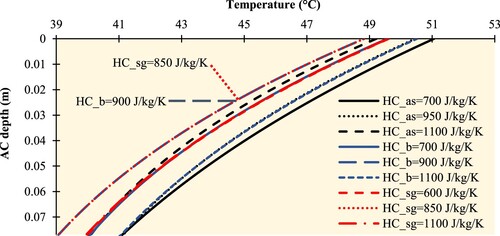
also shows that the change in HC values for base and subgrade layers are not linearly correlated to the temperature change. This is because the temperature at AC layer is only a small fraction of the overall profile of the pavement. Thus, the resultant temperature profile is affected by how all layers are working together to transport and store heat. It is therefore recommended to run a temperature simulation analysis when designing a pavement of specific thermal requirements.
Altering the heat capacity of AC layer () has more impact on the temperature profile than alterating the heat capacities of underlying layers. For this reason, results for altering
on temperature and oxidative ageing is going to be discussed in more detail. shows the day-to-night temperature variations at different locations of AC in the summer and winter seasons. The temperature fluctuation is a bit more intense at
compared to that at higher heat capacity values, with an average difference of 1–2°C. This was also recorded by Bobes-Jesus et al. (Citation2013), in that the temperature variations decreases as asphalt pavement specific heat increases (Bobes-Jesus et al. Citation2013), due to the greater heat storage capacity of the pavement. This variation is more pronounced in summer when the temperature is high.
Figure 9. Temperature variation with time at asphalt concrete (AC) with different heat capacity values ( = 700, 950, and 1200 J/kg/K) in summer and winter conditions at (a) AC surface in summer (b) AC surface in winter (c) AC bottom in summer, and (d) AC bottom in winter.
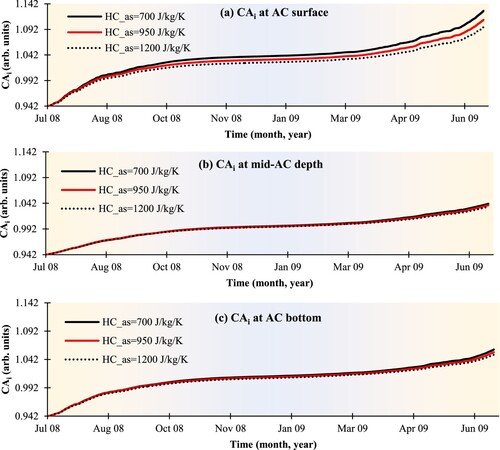
shows the carbonyl growth with time for different heat capacity values in the AC layer. Asphalt pavement with lower limit value of heat capacity () experienced more oxidative ageing compared to greater heat capacity values. However, the increase in the carbonyl index at the surface after one year of field ageing due to decreasing
did not exceed one percent. Furthermore, the impact of heat capacity of underlying layers (base and subgrade) on the oxidative ageing growth rate is also negligible.
Figure 10. Carbonyl area at the air channels-mastic interface (CAi) vs. ageing time, for different heat capacity values ( = 700, 950, and 1200 J/kg/C) at three asphalt concrete depths (AC) (a) AC surface, (b) mid-AC depth, and (c) AC bottom.
To conclude, the thermal properties of underlying layers (base and subgrade) causes little to no effects on the temperature profile and oxidative ageing products content and distribution for this data set. The most notable effect was caused by changing the thermal conductivity and heat capacity of the AC. The maximum daily surface temperature can be reduced by a maximum of 5°C, which according to previous literature, can extend the service life by five years when considering all distress factors, not that caused by oxidative ageing alone.
4.2. Effect of oxidation activation energy on ageing in pavements
This section studies the effect of oxidative activation energy of binder on the ageing of asphalt pavement using one oxidation kinetics parameter. It is possible to determine binder-source dependent oxidation kinetics (,
and
) using the oxidative activation energy of the fast-term ageing stage (
) alone using Jin et al. (Citation2011) correlations. They found a linear correlation between the activation energies of the fast and constant oxidation stages based on the tests of 15 asphalt binders aged in the laboratory using thin-film oven conditions at atmospheric air pressure (Jin et al. Citation2011), as shown in Equation (1).
(1)
(1) An exponential correlation is established between the pre-exponential factor
and constant-term activation energy
, and between
and
, as shown in Equations (2) and (3).
(2)
(2)
(3)
(3)
For the current study, a suitable range of oxidative activation energy values (74–226 kJ/mol) is identified, based on earlier experimental research by the authors (Omairey et al. Citation2019, Omairey et al. Citation2020, Gao et al. Citation2021) using thin-film oven ageing tests for anti-ageing compounds (AACs) modified bitumen. According to the study, AAC-modified bitumen showing high activation energy compared to the control specimen (with no AACs) was considered effective in the mitigation or prevention of oxidative ageing. The improvement in anti-ageing performance is presented in the form of a ratio between of AAC-modified specimen and that for the control specimen. It was observed that some AACs caused an increase in
from 222 to 664 kJ/mol, achieving a ratio of improvement of 3.0. Thus, a ratio of 3 is considered as the upper limit, and a ratio of 1 (i.e. control bitumen without improvement in
) was considered as the lower limit. Some AAC-modified binders did not show any signs of oxidation when tested under thin-film oven ageing conditions; therefore, it was impossible to determine their oxidative activation energies. Other studies identified a similar range of
values for unmodified and polymer modified bitumen. In the technical report FHWA/TX-14/0-6009-2, a number of 15 binders were tested, and their activation energy values for the fast-term ageing stage were ranging from 35.2 kJ/mol to 75.4 kJ/mol. The activation energies for the constant-term ageing were ranging from 64.9 kJ/mol to 103.8 kJ/mol for unmodified and polymer modified binders (Glover et al. Citation2014).
Climate data, pavement structure and mixture morphology for road section US277 located in Laredo – Texas were employed to conduct the parametric study. The model was let to run for one year of field ageing simulation. The original value of for road section US277 is 75.4 kJ/mol. Thus, values ranging from 75.4 kJ/mol to 226 kJ/mol are selected to maintain an improvement ratio in the activation energy of 1–3.
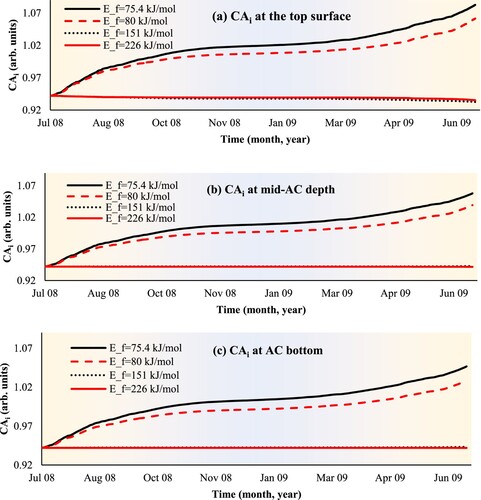
(a–c) shows the carbonyl area content at the mastic-air channel interface (where there is a minimum constraint on oxygen diffusion) for one year of field ageing simulation at three asphalt concrete depths. There is an evident growth in carbonyl content for bitumen binders of 75.4 and 80 kJ/mol. Specifically, there is a 2.3% decrease in carbonyl index (without accounting for the effect of oxygen diffusion) due to a considerably slight increase in the oxidation kinetics (), (from 75.4 to 80 kJ/mol). In contrast, for high activation energy values of 151 and 226 kJ/mol (assuming these are AAC-modified binders), there is no ageing. This suggests the following: (1) the activation energy at fast-rate ageing is a prime parameter for ageing extent and growth in asphalt binders, and subsequently, asphalt pavements; and (2) the addition of anti-ageing materials can mitigate or prevent oxidative ageing of asphalt pavements.
Figure 11. Carbonyl area at the air channels-mastic interface (CAi) vs. ageing time, using different fast-term activation energy values ( = 75.4, 80, 151, and 226 kJ/mol) at (a) asphalt concrete (AC) surface, (b) mid-AC depth, and (c) AC bottom.
4.3. Effect of oxygen accessibility on ageing in pavements
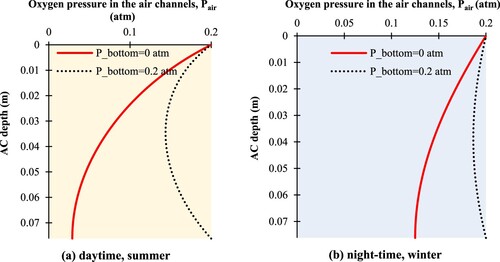
The porosity of underlying layers may affect oxygen supply and the ageing process in the AC. This section covers the influence of bottom boundary condition on oxygen pressure distribution and CA growth rate. Two extreme scenarios are considered: (1) oxygen can diffuse freely from the lower boundary (i.e. presence of porous base layer), and (2) there is no access of oxygen from the lower boundary (i.e. presence of treated base layer). The first case (free access to oxygen) is predefined in the existing ageing model. The second condition (no access to oxygen) is achieved by adjusting the boundary condition of oxygen diffusion in both air channel and mastic in the ageing model. To explain, in , amend oxygen diffusion interfaces at the interconnected air channels and inside the mastic film thickness by removing the bottom domain of Dirichlet boundary condition (Pair = 0.2[atm], and Pb = 0.2[atm]). Thus, oxygen pressure of 0.2 atm is supplied at the top surface only.
shows oxygen pressure distribution in the air channels at two different time intervals: (1) at peak daytime during summer season when rapid oxidation is expected to occur, (2) at night-time during winter when the oxidation is unlikely to occur. The oxygen pressure is greater during the winter season than in summer because the oxidation rate is low, leading to less oxygen consumption. Whereas, less oxygen exists in the air channels during the summer season because it is consumed in the oxidation process. It is also noted that the oxygen pressure (PO2) at the bottom boundary is more than 0 even for a predefined Dirichlet BC of zero, it is because the oxygen pressure is dependent on the coefficient of oxygen diffusion in the air channels (Do2) (where the latter is considerably high in the air channels). Thus, oxygen can still reach the bottom boundary for this data set (mixture morphology, internal structure, and climate data).
Figure 12. Oxygen pressure in the air channels (Pair) across asphalt concrete (AC) depth at (a) peak daytime in summer, (b) peak night-time in winter.
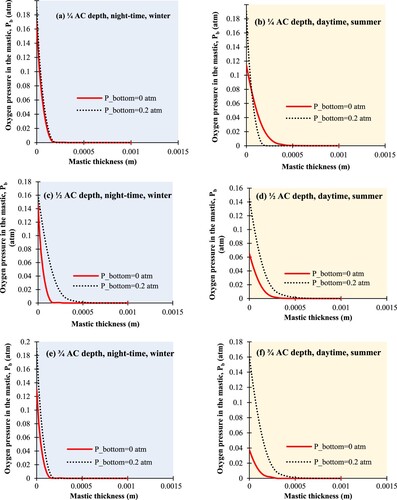
shows the oxygen pressure distribution within the mastic coating at different AC depths. Oxygen diffuses more in the mastic in summer season than in winter. This is because bitumen softens at high temperatures, allowing oxygen to diffuse into the mastic easily. Generally, higher oxygen concentration (represented by pressure) is diffused into the asphalt mastic when the lower boundary condition is made accessible to air (oxygen pressure at the bottom boundary of AC = 0.2 atm).
Figure 13. Oxygen pressure profile across mastic coating thickness at different asphalt concrete (AC) depths (1/4, 1/2 and 3/4 depth from AC top surface), collected in two seasonal conditions (winter and summer seasons).
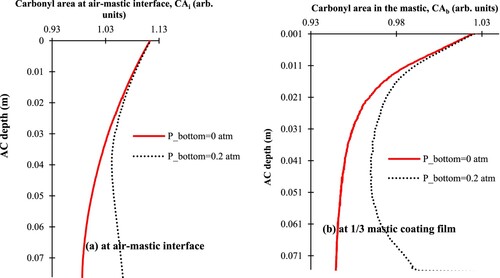
Oxygen pressure within the asphalt mastic plays a vital role on the level of oxidative ageing. shows the carbonyl area at the air channels-mastic interface (CAi), and that at one third the asphalt mastic coating thickness (CAb) after one year of field ageing simulation. The pavement with free access to oxygen from top and bottom (e.g. an unbound granular base is used) is forming carbonyl area profile of a C-shaped curve, and pavement with access to oxygen from top surface only but no access to oxygen from the bottom surface (e.g. treated base is used) is creating a carbonyl area of r-shaped distribution.
Figure 14. Carbonyl area across the pavement depth for one year of field ageing simulation at (a) air channels-mastic interface, (b) 1/3 mastic film thickness.
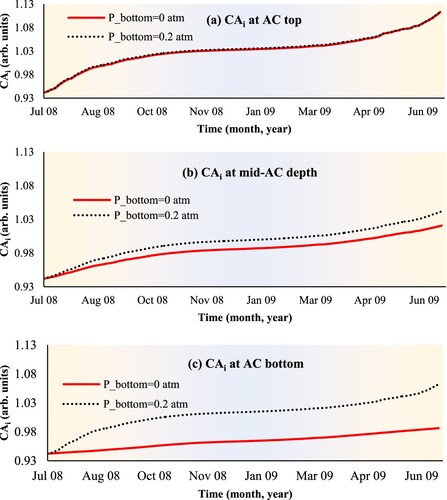
shows CA's growth at the air channels-mastic interface for one year of field ageing simulation. The pattern agrees with in that CA value at the surface is identical for both bottom boundary conditions, but it starts to diverge when going deeper in AC. Wang et al. (Citation2014) placed oxygen sensors at different locations in asphalt pavement layer in the field and observed that the sensor located in the middle of the asphalt pavement slab shows reduced oxygen concentration compared with one not covered by the slab, and one closer to the slab edge (has less accessibility to air). They stated that the difference in oxygen content at the pavement's upper and bottom layers creates an oxygen pressure gradient, contributing to the variations of asphalt ageing in a pavement structure (Wang et al. Citation2014). These conclusions agree with the obtained simulation results in this study. Because the ageing gradient is more significant for (), this may lead to a more severe top-down cracking, but less bottom-up cracking.
Figure 15. Carbonyl area at the air channels-mastic interface (CAi) vs. ageing time, for two oxygen accessibility conditions at (a) AC surface, (b) mid-AC depth, and (c) AC bottom.
4.4. Effect of mastic coating film thickness on ageing in pavements
The extent of oxidative ageing in asphalt mastics is bound by the coating film thickness surrounding accessible air channels (i.e. diffusion depth of oxygen). The current ageing model uses CT-scan and imaging analysis to determine the coating thickness from extracted field cores across the AC layer. The mastic thickness is then used as a geometric parameter to measure the average carbonyl area (CA) profile across the AC layer. (a,b) shows carbonyl content results for three pavements with mastic coating thicknesses (2.55, 3.40 and 5.00 mm) aged for one year of field simulation. All tested samples experienced similar behaviour, and the oxidative ageing did not extend beyond 0.07 mm of coating thickness after one year of exposure to field ageing simulation for all three samples for this specific data set. Thus, CA's extent is not a function of diffusion depth, but the latter carries a volumetric significance to ageing.
Figure 16. (a) carbonyl area in the binder mastic film (CAb) vs. mastic coating thickness measured at the middle depth of AC layer after one year of field ageing simulation; (b) average carbonyl area in asphalt mastic for AC with different mastic coating film thicknesses (2.55, 3.40, and 5.00 mm) after one year of field ageing.
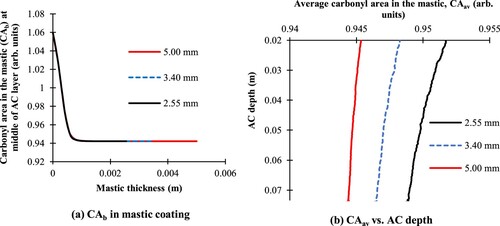
Thus, the thicker the mastic coating film, the less the average carbonyl area will be. These findings agree well will previous studies, where it was found that asphalt pavements of less mastic coating film and better mastic distribution are more susceptible to oxidative ageing, resulting in a dramatic decrease of pavement's resistance to cracking (Jiang et al. Citation2020).
4.5. Effect of air voids distribution and content on ageing in pavements
In this section, the effect of a simplified C-shaped distribution of air voids on the oxidative ageing profile will be considered and compared with results from the constant air voids approach. Then, the effect of average air voids percentage on oxidative ageing is investigated.
4.5.1. Effect of air void distribution on ageing in pavements
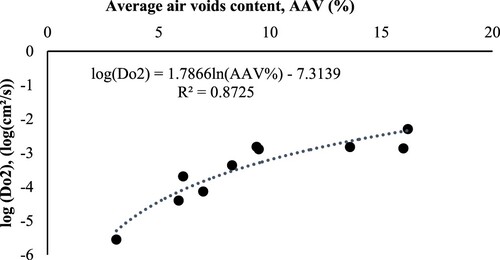
The role of air voids in the proposed equation-based ageing model is manifested in three parts (1) model geometry: the average air voids radius is forming the width of air channels (domain 1 in ); (2) coefficient of oxygen diffusion in the air channels (): the coefficient of oxygen diffusion in the air channels is linked to the average air voids content (AAV) as seen in Equation (4) and (derived from the experimental results of Wen and Wang (Citation2018)); (3) average carbonyl content at a certain depth (
): the predicted carbonyl area at any depth is calculated using the volumetric integration of mastic surrounding air voids channels (as can be seen in Equation (5)).
(4)
(4)
(5)
(5) where R1 equals the air voids diameter (rair) plus the average diffusion depth at a certain AC depth, CA(r) is the carbonyl area at a specific point, and r is the horizontal coordinate of the point.
Figure 17. Correlation between the coefficient of oxygen diffusion () and air voids content (AAV%) (derived from experimental measurements of (Wen and Wang Citation2018)).
The air voids distribution (number and diameter) were made available for road section US277 using x-ray CT-scan technique (Glover et al. Citation2014). However, the accuracy of CT-scan data (i.e. number, distribution and diameter of air voids) is highly dependent on the number and location of extracted core samples. It is unclear how many cores can be considered representative of the actual road section in the field. For this reason, it is suggested to rely entirely on the average air voids content in the developed ageing model and give up any model dependency on the air voids diameter from CT-scan images. To do so, a relationship between average air voids content and diameter (or radius) is needed. This relationship was recognised empirically by Zhang et al. (Citation2014) as shown in and Equation (6) (with ) (Zhang et al. Citation2014). It is worth mentioning that this relationship may not apply to dense-graded mixtures (air voids content is less than 2%). As appears in , the equation would still generate air voids radius even for zero air voids content. This error is attributed to limitations in air voids measuring techniques.
(6)
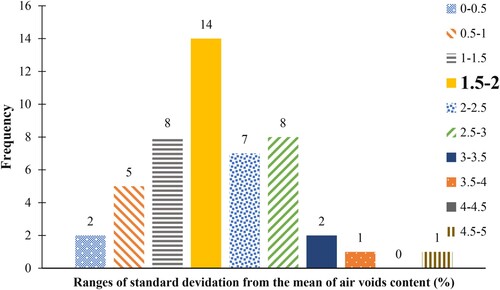
(6) To study ageing sensitivity to air voids distribution, a C-shaped distribution pattern will be imposed in the model. The minimum value of air voids content is located at the middle of AC layer, and the maximum value is located at the top and bottom. To quantify these two extreme AAV values in relationship to the average air voids content, data collected from 48 field cores at 19 road sections located in the United States were employed to estimate the standard deviation from the mean of air voids content across depth. The air voids profiles for these road sections are documented in (Glover et al. Citation2014). Although these sections did not necessarily demonstrate a C-shaped distribution, they give insight into the nature of variation in air voids content in the AC structure. shows that 30% of studied core samples had a 1.5% to 2% deviation in the air voids content from the mean AAV. Therefore, the estimated minimum and maximum air voids content for the C-shaped distribution will have 2% to 1.5% deviation from the mean value in the current study.
Figure 18. Empirical correlation between average air void radius and air void content of asphalt mixtures based on laboratory and field samples (Zhang et al. Citation2014).
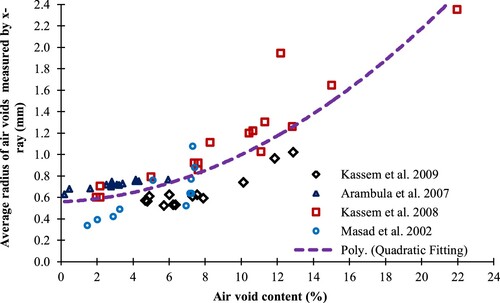
Figure 19. Ranges of standard deviation from the mean of air voids across pavement depth for 48 field cores collected from 19 road sections in the United States (based on collected field data in (Glover et al. Citation2014)).
Accordingly, the parabolic general formula is employed to form a C-shaped distribution of air voids, as seen in Equation (7).
(7)
(7) where,
is the air voids content at any AC depth (
),
and
are the maximum and minimum air voids contents, respectively, and
is the total depth of AC measured in metres.
and
are calculated using Equations (8) and (9), to ensure that the average value of air voids content calculated from the proposed C-shaped curve equals the mean air voids of asphalt pavement.
(8)
(8)
(9)
(9) where
is equal or less than 1% to maintain a standard deviation from the mean within the range (2–1.5%), as discussed in .
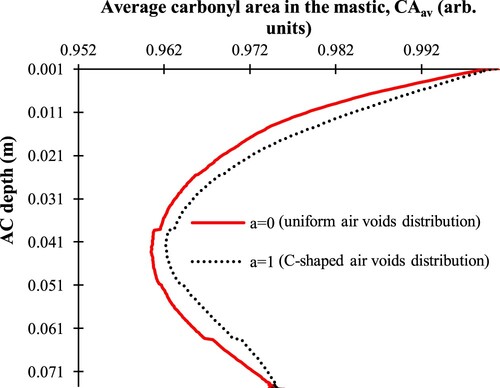
The oxygen pressure distribution in the air channels is expected to undergo changes when air voids distribution is altered because the coefficient of oxygen diffusion in air channels () is air voids dependent. Increasing the air voids content at the top and bottom of AC by forcing a C-shaped arrangement caused a slight increase in the oxygen pressure, as shown in . Consequently, there is a uniform increase in the carbonyl area growth across AC depth (). Thus, although the average air voids content is kept the same, a non-uniform air voids distribution allowed more oxygen access to AC and increased the oxidative ageing across the pavement depth.
Figure 20. Oxygen pressure profile in the air channels (Pair) for a uniform air voids distribution (a = 0) and C-shaped air voids distribution (a = 1) at an average air voids ratio of 8%, at (a) Peak night-time in winter, (b) Peak daytime in summer.
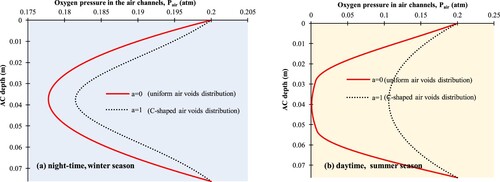
Figure 21. Average carbonyl area profile for a uniform air voids distribution (a = 0) and C-shaped air voids distribution (a = 1) at average air voids ratio of 8%, for one year of field ageing simulation.
4.5.2. Effect of air voids content on ageing in pavements
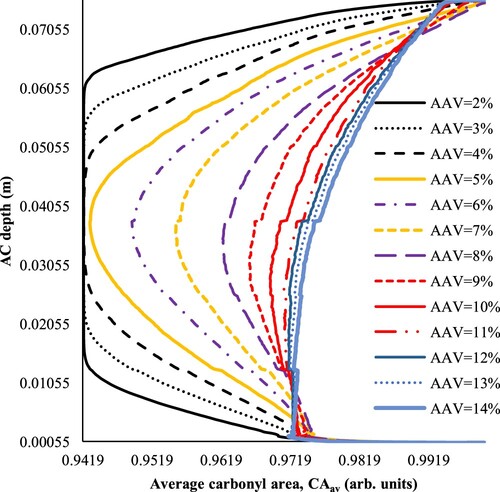
A range of air void content (AAV) from 2 to 14% with 1% increment was chosen to cover a wide range of air voids contents. The variation in AAV distribution across depth was set as a C-shaped distribution (a = 1), and the air voids content and distribution were assumed to be steady with time. shows carbonyl growth at the air-mastic interface for one year of field ageing simulation in the middle of the AC course. The results indicate a nonlinear change in carbonyl content with air voids content, and the existence of two air voids thresholds. Pavements with air voids content of 5% and less experienced limited to no oxidative ageing. Altering the air voids from 5% to 9% caused a constant increase in CA, whereas increasing the air voids by more than 9% did not increase carbonyl formation rate. Thus it can be concluded: (1) dense AC of low air voids content (< 5%) will experience little to no ageing especially in the middle of AC layers; (2) asphalt pavements with air voids content of (5–9%) will experience AAV-dependent oxidative ageing, where higher AAV leads to a higher ageing rate; (3) pavements with air voids of (> 9%) will have a full access to oxygen from the atmosphere, and thus the oxidative ageing is very significant and will not be constrained by AAV. shows the average CA content across pavement depth for AC with various AAVs, and the results confirm that of . The average carbonyl content for (AAV > 9%) is uniform across AC depth (i.e. no clear C-shaped or r-shaped ageing gradient).
Figure 22. Carbonyl area at air-mastic interface (CAi) for one year of field ageing simulation, for asphalt layer of various air voids contents (AAV = 2–14%).
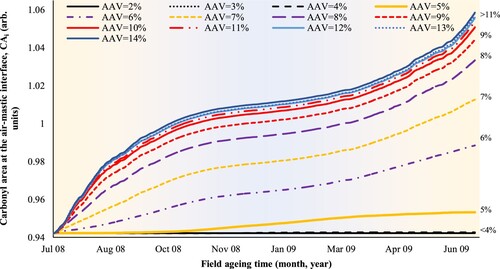
Figure 23. Carbonyl area profile in asphalt layer with various air voids contents (AAV = 2–14%) after one year of field ageing simulation.
5. Validation of parametric analysis using field ageing data
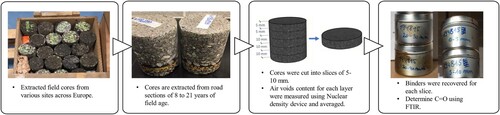
Extracted site cores data from various sites across Europe are collected from Soenen et al. (Citation2020a, Citation2020b, Citation2021) and analysed to identify a potential link between air voids content and oxidation products content. Fourteen road sections with field ageing ranged from 8 to 21 years were considered (Soenen et al. Citation2020a, Citation2020b, Citation2021). illustrates the undergone process to obtain the average air voids and carbonyl functional groups. Binders from the surface course are recovered after cutting the cores into thin layers or slices. Typically, the top slice is 5 mm, and the lower slices are 1 cm thick. Depending on the wearing course thickness, the total number of slices varied between 2 and 5. The void percentage is measured using nuclear density measurements, and the average value for all layers is considered.
Figure 24. Field cores extraction and binder recovery from aged asphalt pavements.
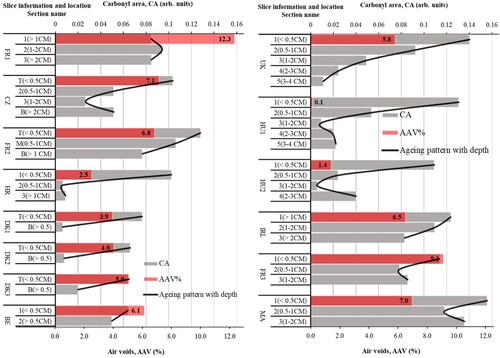
shows the carbonyl area content and the corresponding average AAV for all 14 field road sections. Generally, it is observed that top AC layers experience more ageing than that at deeper layers, validating the modelling results shown in , , and in this study. Some sections experienced a non-uniform C-shaped ageing profile, where mid-layers maintained low oxidative ageing, where others show a decreasing r-shaped ageing profile along pavement depth. This can be attributed to the presence of porous course or non-porous course (e.g. unbound or treated base) below the AC layer. It is also observed that cores of thin AC layers (sections DK1, DK2, and DK3 in ) experienced a clear CA gradient with the highest values at the top surface compared to the lower layer. For these thin cores, it is not possible to cut the cores into more than two slides.
Figure 25. Carbonyl area (CA) values and air voids contents of field cores for 14 road sections across Europe (the solid curves show the ageing pattern and CA profile along pavement depth).
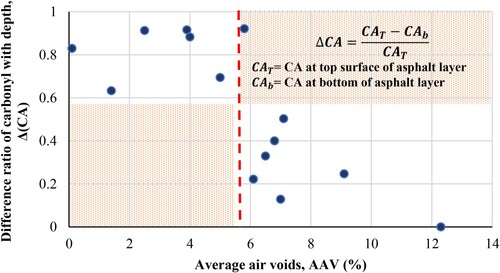
shows the carbonyl area difference (ΔCA, determined using the carbonyl content at the top and bottom slices of the asphalt layer) against air voids content. A higher ΔCA indicates a greater gradient in the CA profile along pavement depth. A lower ΔCA means the ageing profile is close to uniform along the depth. When the AAV < (5∼6)%, there is a severe ageing on the top surface of AC but very limited ageing below the surface, thus ΔCA is close to one. There is a gradually increasing ageing when the AAV is above this threshold (5∼6%), thus ΔCA decreases and ranges from 0.6 to 0.2. When the AAV > (9∼10)%, the ageing is severe and uniform across the whole layer depth, and ΔCA is close to zero. A decline in ΔCA for (5∼6) % of AAV is noticed in ; this is agreeing well with the model results in and .
Figure 26. Correlation between air voids (AAV) and carbonyl content difference between top and bottom of asphalt layer (ΔCA) for 14 European road sections.
6. Conclusions
This parametric analysis study uses Multiphysics modelling approaches for ageing simulation of asphalt pavements in the field to assess the effects of material properties on the ageing evolutions. The focused material properties include thermal properties of asphalt, base and subgrade layers, air voids content and distribution in the asphalt layer, coating thickness of asphalt mastic, oxygen accessibility of the base layers, and oxidative kinetics of binder. The ageing evolutions were examined on the spatial and temporal distribution of the oxidative products (carbonyl area) in the asphalt pavement structures. Conclusions are summarised as follows:
Increasing the thermal conductivity of asphalt layers lowers the surface temperature and increases the bottom temperature in the asphalt layer up to 5°C. It is therefore causing less temperature gradient in asphalt layer, which can cause an up to 5% per year reduction of the ageing gradient and potential less cracking damage.
Increasing the heat capacity of the asphalt layer generates slightly reduced daily temperature variations due to the greater heat storage capacity of the pavement. The maximum daily surface temperature can be reduced by 2°C upon increasing the heat capacity, generating a one per cent decrease in carbonyl index.
The variations of the thermal properties of underlying layers (base and subgrade) cause little or no effects on the temperature profile and oxidative ageing amount and distribution in the asphalt layers. The most notable changes of temperature or ageing profiles are caused by changing the thermal conductivity and heat capacity of the asphalt layers.
The activation energy at fast-rate ageing is a prime parameter for ageing extent and growth in asphalt binders, and subsequently, asphalt pavements. Increasing the fast-rate activation energy by only 5 kJ/mol caused a reduction in carbonyl index of up to 2.3% per one year of ageing. The asphalt binder with very high activation energies due to the inclusion of anti-ageing additives generates little oxidative ageing in the field.
The asphalt layers built on an unbound granular base (free access to oxygen at both top and bottom of the asphalt layer) will experience greater overall ageing with a C-shaped ageing gradient compared to that built on treated base (access to oxygen at the top but none at the bottom of the asphalt layer) which lead to an r-shaped ageing gradient along pavement depth.
The extent of oxidative ageing in asphalt mastics is bound by the mastic film thickness surrounding accessible air channels (i.e. diffusion depth). The thicker the mastic coating film, the less the average carbonyl area will be, resulting in a potentially increased pavement resistance to cracking.
A non-uniform (i.e. C-shaped) air voids distribution within the asphalt layer allows more oxygen access. It increases the oxidative ageing across the pavement depth, causing binder hardening and aged pavements prone to more fatigue damage.
The air void content plays a vital role in limiting oxidative ageing. Dense asphalt pavements with a low air voids content (< 5%) experience little to no ageing, whereas asphalt pavements with air void content of 5–9% experience a growing oxidative ageing rate with an increasing air void content. Pavements with high air voids (> 9%) will have full access to oxygen from the atmosphere, thus the average carbonyl content is high and uniform across asphalt pavement depth with no clear C-shaped or r-shaped ageing gradient.
Acknowledgements
The authors would like to thank Nynas AB, Sweden and Colas, France, for providing ageing data from European road sections. Acknowledgement is also extended to Schlumberger Foundation (Faculty for the Future Fellowship programme) for their generous financial support. The authors confirm contribution to the paper as follows: simulation work, data collection and analysis, and paper draft: Eman Omairey; study conception, objective design, and paper review: Yuqing Zhang; data acquisition and paper review: Hilde Soenen and Xavier Carbonneau. All authors reviewed the results and approved the final version of the manuscript.
Disclosure statement
No potential conflict of interest was reported by the author(s).
Additional information
Funding
References
- Alavi, M., Hajj, E. Y., and Sebaaly, P. E., 2017. A comprehensive model for predicting thermal cracking events in asphalt pavements. International Journal of Pavement Engineering, 18 (9), 871–885.
- Alavi, M. Z., Pouranian, M. R., and Hajj, E. Y., 2014. Prediction of asphalt pavement temperature profile with finite control volume method. Transportation Research Record: Journal of the Transportation Research Board, 2456 (1), 96–106.
- Alawi, M. H., and Helal, M. M., 2014. A mathematical model for the distribution of heat through pavement layers in Makkah roads. Journal of King Saud University-Engineering Sciences, 26 (1), 41–48.
- Bobes-Jesus, V., et al., 2013. Asphalt solar collectors: a literature review. Applied Energy, 102, 962–970.
- Caro, S., et al., 2010. Probabilistic modeling of the effect of air voids on the mechanical performance of asphalt mixtures subjected to moisture diffusion. Asphalt Paving Technology-Proceedings Association of Asphalt Technologists, 79, 221.
- Castelblanco Torres, A., 2006. Probabilistic analysis of air void structure and its relationship to permeability and moisture damage of hot mix asphalt. Texas A&M University.
- Chen, J., Wang, H., and Li, L., 2015. Determination of effective thermal conductivity of asphalt concrete with random aggregate microstructure. Journal of Materials in Civil Engineering, 27 (12), 04015045.
- Chen, J., Wang, H., and Zhu, H., 2017. Analytical approach for evaluating temperature field of thermal modified asphalt pavement and urban heat island effect. Applied Thermal Engineering, 113, 739–748.
- Gao, Y., et al., 2021. Influence of anti-ageing compounds on rheological properties of bitumen. 128559.
- Glover, C. J., et al., 2009. Evaluation of binder aging and its influence in aging of hot mix asphalt concrete: literature review and experimental design. Texas Transportation Institute.
- Glover, C. J., et al., 2014. Evaluation of binder aging and its influence in aging of hot mix asphalt concrete: technical report, Texas. Dept. of Transportation. Research and Technology Implementation Office.
- Gu, F., et al., 2021. Effects of additional antistrip additives on durability and moisture susceptibility of granite-based open-graded friction course. Journal of Materials in Civil Engineering, 33 (9), 04021245.
- Gui, J., et al., 2007. Impact of pavement thermophysical properties on surface temperatures. Journal of Materials in Civil Engineering, 19 (8), 683–690.
- Hall, M. R., et al., 2012. Influence of the thermophysical properties of pavement materials on the evolution of temperature depth profiles in different climatic regions. Journal of Materials in Civil Engineering, 24 (1), 32–47.
- Han, R., 2011. Improvement to a transport model of asphalt binder oxidation in pavements: Pavement temperature modeling, oxygen diffusivity in asphalt binders and mastics, and pavement air void characterization. Texas A&M University.
- Han, R., Jin, X., and Glover, C. J., 2011. Modeling pavement temperature for use in binder oxidation models and pavement performance prediction. Journal of Materials in Civil Engineering, 23 (4), 351–359.
- Hassn, A., et al., 2016. Effect of air voids content on thermal properties of asphalt mixtures. Construction and Building Materials, 115, 327–335.
- Jiang, J., et al., 2020. Distribution of mortar film thickness and its relationship to mixture cracking resistance. International Journal of Pavement Engineering, 1–10, Ahead of print.
- Jin, X., et al., 2011. Fast-rate–constant-rate oxidation kinetics model for asphalt binders. Industrial & Engineering Chemistry Research, 50 (23), 13373–13379.
- Jin, X., Cui, Y., and Glover, C., 2013. Modeling asphalt oxidation in pavement with field validation. Petroleum Science and Technology, 31 (13), 1398–1405.
- Li, R., et al., 2019. Soil thermal conductivity and its influencing factors at the Tanggula permafrost region on the Qinghai–Tibet Plateau. Agricultural and Forest Meteorology, 264, 235–246.
- Li, H., Luo, X., and Zhang, Y., 2021. A kinetics-based model of fatigue crack growth rate in bituminous material. International Journal of Fatigue, 148, 106185.
- Liu, M., et al., 1996. The kinetics of carbonyl formation in asphalt. AIChE Journal, 42 (4), 1069–1076.
- Liu, F., Zhou, Z., and Zhang, X., 2021. Linking chemical to rheological properties of asphalt binder with oxidative aging effect. Road Materials and Pavement Design, 22 (9), 2014–2028.
- Lu, Y., Wright, P., and Zhou, Y., 2009. Effect of temperature and temperature gradient on asphalt pavement response. Road & Transport Research: A Journal of Australian and New Zealand Research and Practice, 18 (1), 19.
- Luca, J., and Mrawira, D., 2005. New measurement of thermal properties of superpave asphalt concrete. Journal of Materials in Civil Engineering, 17 (1), 72–79.
- Lunsford, K. M., 1994. The effect of temperature and pressure on laboratory oxidized asphalt films with comparison to field aging. Texas A&M University. Libraries.
- Luo, X., et al., 2018. Kinetics-based aging evaluation of in-service recycled asphalt pavement. Journal of Cleaner Production, 200, 934–944.
- Luo, X., Gu, F., and Lytton, R. L., 2015. Prediction of field aging gradient in asphalt pavements. Transportation Research Record: Journal of the Transportation Research Board, 2507 (1), 19–28.
- Luo, X., Gu, F., and Lytton, R. L., 2019. Kinetics-based aging prediction of asphalt mixtures using field deflection data. International Journal of Pavement Engineering, 20 (3), 287–297.
- Mallick, R. B., Chen, B.-L., and Bhowmick, S., 2009. Harvesting energy from asphalt pavements and reducing the heat island effect. International Journal of Sustainable Engineering, 2 (3), 214–228.
- Omairey, E. L., et al., 2019. Impact of anti-ageing compounds on oxidation ageing kinetics of bitumen by infrared spectroscopy analysis. Construction and Building Materials, 223, 755–764.
- Omairey, E. L., et al., 2020. Rheological and fatigue characterisation of bitumen modified by anti-ageing compounds. Construction and Building Materials, 265, 120307.
- Omairey, E, 2021. Multiphysics modelling and mitigation of ageing in asphalt pavements. Aston University.
- Omairey, E. L., Gu, F., and Zhang, Y., 2021. An equation-based multiphysics modelling framework for oxidative ageing of asphalt pavements. Journal of Cleaner Production, 280, 124401.
- Omairey, E., and Zhang, Y., 2021. Effect of climate region on field oxidative ageing of asphalt pavements using Multiphysics modelling approach. In: International symposium on frontiers of road and airport Engineering, Delft, Netherlands.
- Pan, P., et al., 2017. Effect of freezing-thawing and ageing on thermal characteristics and mechanical properties of conductive asphalt concrete. Construction and Building Materials, 140, 239–247.
- Prapaitrakul, N., et al., 2009. A transport model of asphalt binder oxidation in pavements. Road Materials and Pavement Design, 10 (sup1), 95–113.
- Qin, Y, 2016. Pavement surface maximum temperature increases linearly with solar absorption and reciprocal thermal inertial. International Journal of Heat and Mass Transfer, 97, 391–399.
- Rochlani, M., et al., 2020. Influence of source and ageing on the Rheological properties and fatigue and rutting resistance of bitumen using a DSR. In: Proceedings of the 9th international conference on maintenance and rehabilitation of pavements—Mairepav9, Springer.
- Rose, A. A., 2016. Pavement air void property determination and incorporation of pavement air void properties in pavement oxidation modeling with an emphasis on X-Ray CT image analysis.
- Soenen, H., et al., 2020a. Rheological parameters of durability of binders extracted from road pavements. Research and Innovation, 974, 1–10.
- Soenen, H., et al., 2020b. Evaluation of the properties of bituminous binders recovered from various sites in Europe ISBM 2020.
- Soenen, H., et al., 2021. Durability paramterts evaluated on binders recovered from various field sites in Europe. In: 7th e&E congress, Madrid, Spain, Eurasphalt and Eurobitume.
- Solaimanian, M., and Bolzan, P., 1993. Analysis of the integrated model of climatic effects on pavements, Strategic Highway Research Program. National Research Council.
- Solaimanian, M., and Kennedy, T. W., 1993. Predicting maximum pavement surface temperature using maximum air temperature and hourly solar radiation. Transportation Research Record, 1417, 1–11.
- Wang, H., et al., 2010. Numerical simulation on the thermal response of heat-conducting asphalt pavements. Physica Scripta, T139, 014041.
- Wang, P. Y., et al., 2014. Evolution and locational variation of asphalt binder aging in long-life hot-mix asphalt pavements. Construction and Building Materials, 68, 172–182.
- Wang, Y., Sun, L., and Qin, Y., 2015. Aging mechanism of SBS modified asphalt based on chemical reaction kinetics. Construction and Building Materials, 91, 47–56.
- Wen, Y., and Wang, Y., 2018. Determination of oxygen diffusion coefficients of compacted asphalt mixtures. Construction and Building Materials, 160, 385–398.
- Yavuzturk, C., Ksaibati, K., and Chiasson, A., 2005. Assessment of temperature fluctuations in asphalt pavements due to thermal environmental conditions using a two-dimensional, transient finite-difference approach. Journal of Materials in Civil Engineering, 17 (4), 465–475.
- Yin, F., et al., 2017. Characterization of non-uniform field aging in asphalt pavements. Construction and Building Materials, 153, 607–615.
- Zhang, Y., et al., 2014. Crack initiation in asphalt mixtures under external compressive loads. Construction and Building Materials, 72, 94–103.
- Zhang, Y., et al., 2017. Viscoelasticplastic–fracture modeling of asphalt mixtures under monotonic and repeated loads. Transportation Research Record: Journal of the Transportation Research Board, 2631 (1), 20–29.
- Zhang, Y., et al., 2018a. Modeling stress-dependent anisotropic elastoplastic unbound granular base in flexible pavements. Transportation Research Record: Journal of the Transportation Research Board, 2672 (52), 46–56.
- Zhang, Y., et al., 2018b. Impacts of air-void structures on the rutting tests of asphalt concrete based on discretized emulation. Construction and Building Materials, 166, 334–344.
- Zhang, Y., et al., 2019. Prediction of dynamic shear modulus of fine aggregate matrix using discrete element method and modified hirsch model. Mechanics of Materials, 138, 103148.
- Zhang, Y., Birgisson, B., and Lytton, R. L., 2016. Weak form equation–based finite-element modeling of viscoelastic asphalt mixtures. Journal of Materials in Civil Engineering, 28 (2), 04015115.
- Zhao, Y., Tong, L., and Zhu, Y., 2019. Investigation on the properties and distribution of air voids in porous asphalt with relevance to the Pb (II) removal performance. Advances in Materials Science and Engineering, 2019 (13), 1–13.