
ABSTRACT
Membranes of sufficient bonding characteristics could improve the integrity of the multi-layer structures on orthotropic steel deck bridges (OSBDs), enhancing thus the structural response of these systems and, ultimately, their service life. In this research, full-scale experiments were performed at the LINTRACK accelerated pavement testing facility of the Delft University of Technology to evaluate the performance of two surfacing systems commonly used in the Netherlands, giving emphasis on assessing the interface response of membranes with the surrounding materials. Results indicated that the tensile strains remain almost uniform at the top of porous asphalt, in both transverse and longitudinal directions, as no appreciable loss in stress-carrying capabilities was seen even at the end of the testing program. The sections exhibited similar behaviour in terms of strains, with some differences in strains indicating the impacts of membranes at interfaces. The importance of membranes of the desired bonding characteristics was also reflected by the relative displacement measurements. The relative interlayer slip had been higher in the transverse direction than the longitudinal one, with slightly higher displacements in one of the test sections. Overall, no cracking was observed on either section, and the current findings support the use of membranes between surfacing layers on OSBDs.
Introduction
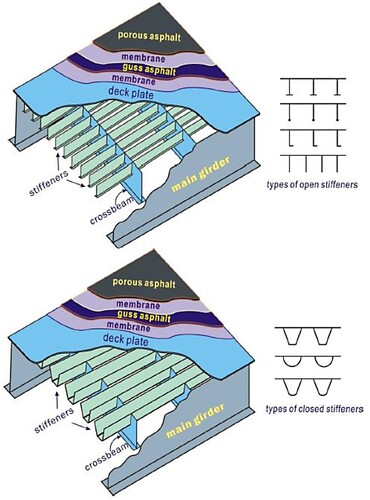
The development of Orthotropic Steel Bridge Deck (OSBD) started in the early twentieth century with the aim of reducing the overall cost of construction by optimising steel mass (AISC Citation1963). Apart from reducing mass, other properties such as thin cross-sections/shallower cross-sections, rapid installation, and the possibility to install during cold weather (Gurney Citation1992) have contributed to its widely gained popularity. Nowadays, several steel bridges use the orthotropic steel plate systems for traffic load distribution from the deck to the supporting structures (Connor et al. Citation2012). In practice, so-called ‘Open’ and ‘Closed’ stiffener types are often used in OSBDs, with their respective advantages and disadvantages to be found elsewhere (de Jong Citation2007). In the Netherlands, a multi-layered pavement structure is constructed on an OSBD (Li Citation2015; Tzimiris et al. Citation2015). In the top layer of the pavement structure, porous asphalt (PA) mixture is often used as a wearing course material as it provides sufficient noise reduction and better skid resistance capabilities (Zhang et al. Citation2018). For the lower layer of pavement structure, either mastic asphalt (MA) or gussasphalt (GA) is used, and membranes are placed between different layers, which serve as bonding and isolation entities (Liu et al. Citation2022a, Citation2022b), see .
Figure 1. Typical pavement layer arrangements on OSDB (Li Citation2015).
The composite structure of asphalt surfacing layers and OSBD is technically challenging, mainly because of the high flexibility of the combined components, causing large deformations on pavement layers. Other factors such as wind, temperature variations, earthquake forces, seasonal variations, and surrounding factors make the situation even more complex (de Jong Citation2007). Lack of such understandings often leads to a considerable reduction in the actual lifetime of pavements than the expected one. The severity of the problem is also enumerated by the significant increase in traffic of heavier wheel loads. Therefore, it is of prime importance for researchers to carry out relevant investigations on different components of asphalt layers to improve the overall performance of such a complex structure. The main focus of this study is to evaluate membranes placed in between layers by developing an evaluation framework using accelerated pavement testing facilities. It is noted that this research is continuation of past studies which were mainly conducted in the laboratory (Li Citation2015; Tzimiris Citation2017).
Previous studies have shown that the adhesive strength of the membrane between the surfacing layers and the decks of steel bridges has a strong influence on the structural response of OSBD (Li Citation2015; Tzimiris Citation2017). The most important requirement for applying membrane materials on OSBD is that the membrane adhesive layer shall provide sufficient bonds to the surrounding materials. The Membrane Adhesion Test (MAT) device was developed by Delft University of Technology (TU Delft) to characterise the adhesive bonding strength of membranes with surrounding materials on orthotropic steel bridge decks (Liu et al. Citation2013). Especially, an extensive experimental program with the six most commonly used membranes in OSDB in the Netherlands was tested with the MAT device on different substrates. The effects of temperature on the bonding characteristics of the membrane were investigated. Five-point bending (5PB) beam tests were performed as well to investigate the integral response of the typical Dutch surfacing layers with the selected membranes from MAT tests. Four membranes ranked from MAT tests were utilised as the top and bottom membrane layers in the 5PB beams. Several displacement sensors were used to detect the initiation of cracks where they were most likely to appear, and gauges have been used to monitor the significant changes in strains on the PA and GA layer during fatigue testing. The findings of the 5PB beam tests helped verify the further ranking of the best performing multilayer surfacing systems for OSDBs (Liu et al. Citation2013).
Within the pavement community, it is well known that the material performance in the laboratory and field may differ. Ideally, all the tests should be performed under realistic conditions, which could be achieved by creating test sections on in-service pavements. However, this is practically impossible for most research organisations. Another possibility is to use accelerated pavement testing (APT) facilities. It is noted here that conducting experiments using APTs could be a feasible option compared to in-situ testing, however, still, they are more expensive and time-consuming than laboratory tests. Hence, in reality, only a limited number of trials in APTs could be carried out. In this research, only the two best-performing membranes were selected to the APT experimental program on the basis of ranking obtained from a previous study (Liu et al. Citation2013). The aim of this paper is to present the construction, instrumentation, and results of the APT tests performed at TU Delft.
Accelerated pavement testing
Along with many other international agencies and research institutes (Romanoschi, et al. Citation1999; Harvey and Popescu et al. Citation2000;Choubane et al. Citation2006; Al-Qadi and Wang Citation2009; NASEM Citation2012; Greene et al. Citation2015; Jansen et al. Citation2018), TU Delft has developed an extended research programs using APT to monitor the structural response and the accumulated damage of pavement systems within a much shorter time period. The APT facility used at TU Delft is called LINTRACK, which linearly simulates the heavy in-service vehicle. More technical details about LINTRACK are discussed in the following sub-sections.
LINTRACK: the TU Delft APT device
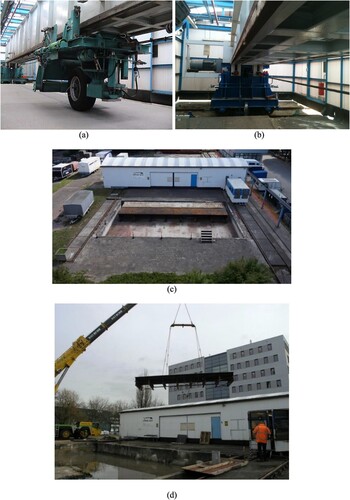
LINTRACK consists of a free-rolling wheel running forwards and backward along with a guidance system (see (a)). The load can be varied between 15 and 100 kN, and the velocity can be varied between 0 and 20 km/h. The movement of the loading carriage is realised with two steel cables and an electric motor. The total wheel travel length is 11.5-m. A maximum speed of 20 km/hr can be attained in the middle 4-m stretches, the other zones are utilised as acceleration/deceleration areas. A fully automated electronic control system allows for continuous 24 hr operation and automated data collection. About 1 million load cycles can be applied in a two-month period of continuous operation.
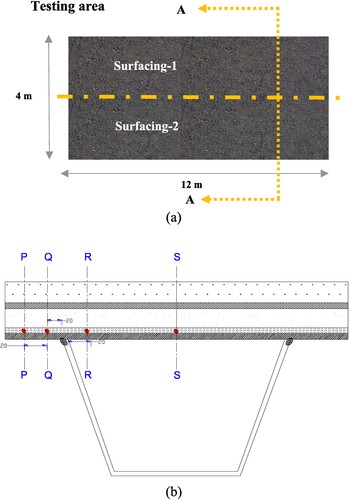
Figure 2. LINTRACK; (a) test panel, and (b) typical cross-sectional positioning of strain gauges.
The wheel load is derived from a pressure gauge in the pneumatic bellows. The readout is in 0.1 kN steps, and accuracy is about ± 0.5 kN. This gauge measures the pressure 12 times in the middle section of 4-m. Due to the roughness of the asphalt surfacing, the wheel load may vary somewhat, and therefore these frequent measurements are appropriate.
Different tires can be mounted on this carriage (see (a)). The single (type A), the double (type B), the super single (type C), and the extra-wide base (type D) can be mounted on the testing device. Compressed air is supplied from a cylinder mounted on the loading carriage. Pneumatic load application prevents leakage of hydraulic oil onto test surfacing.
The guidance system is based on movable supports at either end (see (b)). These, in turn, are mounted on a transverse system of rails which also permits the transverse movement of the entire chamber. This is a significant feature that enables the simulation of wheel wander during testing. It also enables the simultaneous construction of several parallel pavement test sections.
A bogie, running on rails, supports either end of the steel gantry. These 55-m long rails run perpendicular to the gantry across the whole test area. To shelter the test sections from climatic influences such as rain and sunshine during testing, the entire installation is covered with an enclosure (23-m long, 6-m wide, 5-m high), which moves with the installation. LINTRACK is also equipped with a heating system to control the temperature of the material being tested, which is appropriate because temperature dependency is characteristic of the behaviour of surfacing materials. The temperatures of the chamber can be controlled up to about 40°C above ambient.
LINTRACK tests for surfacing systems on steel decks
The LINTRACK facility, which allows the possibility to use different tire types and possibilities to simulate various temperature conditions, can be used to evaluate the structural response of pavement surfacing systems, consisting of different layers of asphalt materials and membranes over a steel bridge deck panel. Once the desired pavement layers are laid on the bridge deck, the mounted wheel can be passed several times over the pavement surface to observe different types of distresses (e.g. permanent deformation, cracking, debonding, blister, disintegration).
LITRACK also allows the control of testing conditions, as discussed before. The mechanical response of membrane and thus the whole response of pavement structure is influenced not only by surrounding substrate but also by the test environmental conditions. The desired temperature can always be maintained through the closed chamber and heating elements that allow the simulation of a real steel bridge situation. Hence, an improved comparison of different surfacing systems can be made.
Previous studies have shown that the adhesive strength of the membranes between the surfacing layers and the decks of steel bridges has a strong influence on the structural response of OSDBs. The role of membrane layers in ensuring the composite action and hence the integrity of the surfacing system is crucial and among the most important requirements. Therefore, it is important to use a membrane with sufficient bonding strength. Simulating in-service conditions through accelerated loading tests on LINTRACK can be amalgamated to laboratory tests that can characterise the bonding response of membrane in a real steel bridge deck surfacing system.
The other advantages of using LINTRACK are that the pavement condition surveys and pavement response measurements can be made at different times during testing. From this, one can determine how pavement response and distress change at different stages of equivalent pavement life. With the help of APT instrumentation, the wheel loads can be aligned to identify the most critical location at different stages of pavements life.
Materials and superstructure
Two types of asphalt surfacing were constructed on a steel bridge deck. As shown in (a), the whole testing area was divided into two parts such that two different types of surfacing can be prepared and tested together. The steel deck plate was shot blasted to ensure a good bond between the intermediate membrane and the steel deck plate. (b) shows a typical cross-section of the pavement layers used in this study. The aggregate gradation of two materials applied for the top and bottom layers on the steel deck is reported in and .
Table 1. Aggregate gradation of PA mixture applied as top surface layer (PA 11|Bestone).
Table 2. Aggregate gradation of GA mixture applied between top surface layer and steel deck.
The test steel deck panel utilised in this research was similar to the majority of OSBD employed in the Netherlands (at least with respect to the deck plate behaviour). The deck plate was built with a 10-mm thick steel plate and Krupp 2/325/6 profile troughs (Leendertz Citation2008). Such steel deck plate was adopted at most of the existing fixed bridges in the Netherlands having the same thickness. Note that a thicker steel plate can significantly reduce the deflection of the structure and thus the maximum tensile strains of the asphalt surfacing system (Liu et al. Citation2019). The distance between the transverse crossbeams is 2-m, whereas 4-m is a normal spacing in practice. This distance is reduced in the test specimens to create more intersections between the crossbeam and trough profile. The longitudinal weld between the trough web and steel deck plate had a throat dimension of about 6-mm and a maximum lack of penetration of 1-mm. The placement of steel is shown in (d).
Figure 3. LINTRACK accelerated pavement testing; (a) apparatus, (b) guidance system supports on transverse rails, (c) housing unit, and (d) steel bridge deck placement.
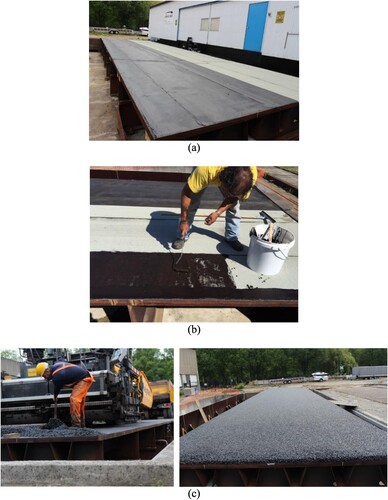
The construction of the upper layer was divided in several phases. Firstly, the presence of contaminates at the upper layer of the bridge may result in decreased interlayer bonding strength between the asphalt materials and steel surfaces. To avoid the effect of such factors, the first stage of construction was to clean the surface thoroughly by steel blasting. On the basis of the guidelines from the manufacturers, the exact amount of different materials of primer was weighed and thoroughly mixed before applying it to the bridge deck, as shown in (a). Once the steel bridge was cleaned, primer quoting was applied immediately.
Figure 4. Construction steps of the superstructure; (a) application of Primer at the top surface of steel deck on both membrane sides (i.e. A (M-A) and C (M-C)), (b) first membrane layer on M–C (left) and M–A sides (right), (c) GA at the top of membrane layer, (d) second membrane layer on M–C (left) and M-A sides (right).
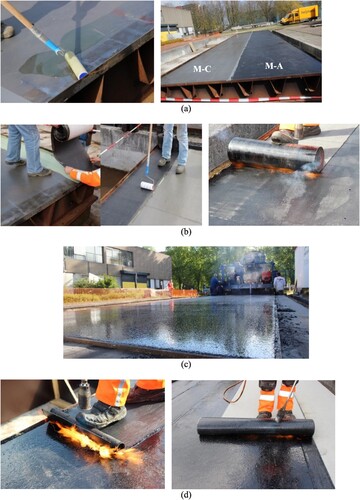
After applying primer, the bottom membrane layer was attached as per the different specifications by membrane producers. As shown in (b), the provided chemical solution was applied over the primer layer for the membrane labelled as M–C. Once the primer layer dried up, glue was applied to be fixed the M–C membrane, as shown in (b). Moreover, the membrane labelled as M-A was fixed with the specified heat, as shown in (b). GA layer of 25-mm thickness was built over the membrane layers (see (c)). The temperature was continuously monitored during the whole construction phase. The temperature during the construction remained at about 220°C. Shear Displacement Measurement Sensors (SDMSs) were placed at the prescribed location and direction; as a first step, dirt was cleaned from the existing GA layer. As per the M–C and M-A membranes’ recommendations, the heat was applied over the GA layer see (d), respectively. Note that membranes of improved cohesive and adhesive characteristics, i.e. high adhesive strength with different substrates (e.g. steel, asphalt and cementitious materials), could improve the integrity of the multi-layer structures and subsequently reduce the overall damage. In this context, the M-A and M–C membranes were selected based on the improved bonding characteristics at earlier stages of this research (Liu et al. Citation2013) but their compositions were not available.
(a) shows upper membrane layers on both sides. The upper membrane layer was built over the GA. At the M-A side of construction before PA layer construction primer was, as shown in (b). On the side of M–C, nothing was applied as per the specification by M–C producers. The PA layer of 35-mm thickness was constructed over the top membrane, as shown in (c).
Figure 5. Construction steps of PA surfacing layer; (a) overview of upper membrane layer, (b) application of Primer on the M–A side, and (c) PA layer construction.
Superstructure instrumentation and test preparation
The strain gauges were installed at several cross-sections on the bridge deck test panel. In the longitudinal direction, the test panel is divided into two sections, each 2-m × 14-m. In particular, the middle troughs of each section will be equipped with strain gauges. In general, strain gauges are to be mounted at the following locations
The bottom of the trough,
The top and bottom surface of the deck plate,
The top and bottom of the surfacing layer,
The top and bottom surface of the membrane layers.
It was of utmost importance to quantify the performance of both M-A and M–C membranes against debonding. The measurement of relative displacements (horizontal slipping) of membranes compared to the nearby bonding layers will give a basis for comparison. For example, if membrane X, after the end of the test, results in significantly higher relative displacement as compared to membrane Y, this will indicate that Y performs better against debonding. Special SDMSs were used for this purpose. (a) shows a typical SDMS, whereas one end of SDMS was anchored to the membrane layer, and the other side was attached to the PA and GA layers during construction.
Figure 6. Installations; (a) SDMS, (b) sensors inside PA pavement layer, and (c) special connectivity between strain gauges and control unit (left), and amplifiers manufactured to avoid signal loss and interference of signal radiation (right).
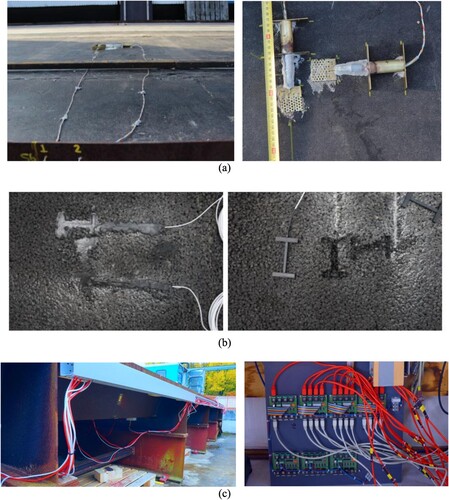
For ease of post-processing, a unique and distinctive number has been assigned to all strain gauges. Each sensor is designated with its position, orientation, horizontal level, and type. Especially, Dynatest PAST II-AC is a quarter-bridge strain gauge designed for asphalt pavements. It comprises one 120 Ohm bonded electrical resistance strain gauges adhered to a fiberglass-epoxy core. Two stainless steel bars are secured at the ends and act as the anchors for the instrument. The strain gauge and the core are covered in numerous layers of other materials to protect the fragile gauge and de-bond the inner portion of the gauge from the outer portion, as shown in (b).
During the M–C section construction of the bottom membrane, no flame was used. Thus, the strain gauges were put on the top of the steel bridge deck. However, it was impossible to put these strain gauges on the M-A section as they used to heat. Since the steel bridge deck is symmetrical about the middle line (separation line between M–C and M–A) and also loading condition is identical, the strain on the two sides of the bridge is expected to be symmetrical.
Finally, the amplifier was required to remain as close as possible to the strain gauge position. This solves the problem of ‘signal loss’ and interference of signal radiations. For this purpose, special amplifiers were manufactured at TU Delft, as shown in (c).
Results
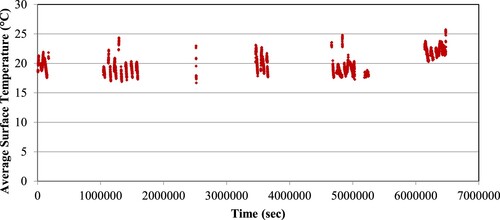
LINTRACK temperature and strain measurements were collected on a weekly basis. In particular, the variation of temperature in the LINTRACK apparatus was recorded at testing. The measured temperatures at the top of the PA surface layer were plotted in . Even during seasonal temperature variations, a small deviation from 20°C was obtained, indicating that the energy supplied by the heating system inside the chamber could be maintained sufficiently and the apparatus operated at the desired temperature levels.
Figure 7. Temperature development with time, at the top of the PA layer.
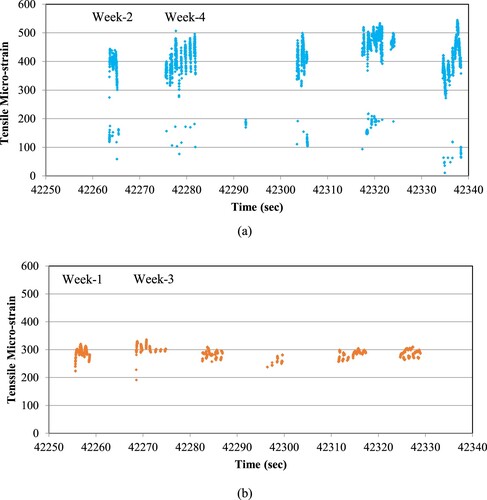
The horizontal tensile strains were recorded at the bottom of the PA surface layer in both M-A and M–C sections. Typical results obtained from the installed strain gauges are plotted in , which depicts only a sample of output from the strain gauges. Every odd week, the M–C section was tested, and in between, the M-A section was also tested, as shown in this figure. The horizontal axis represents time in seconds passed from day 1, and the vertical axis represents output strain data. Note that membranes on both sections are compared under similar test conditions, such as temperature, loading magnitude, and speed. The following sub-chapters present the effect of all testing parameters considered in this study to apply correction factors if necessary.
Figure 8. Typical horizontal tensile strains measured at the top of the PA layer in: (a) M-A and (b) M-C section.
Effect of temperature
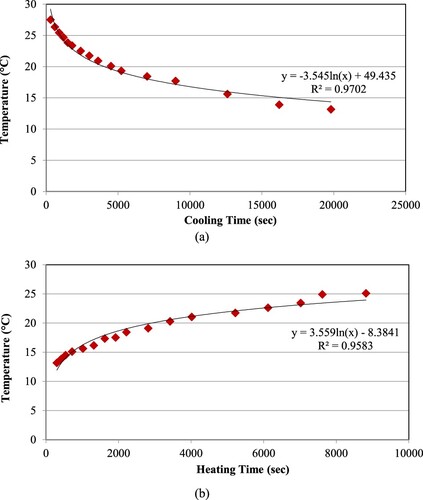
As explained earlier that the heater maintains the temperature inside the chamber. If the outside temperature reduces, the heating system needs to provide more power. When the temperature of the heater is altered, the pavement surface does not react immediately, indicating the existence of phase lag between the temperature development and time. To find out this relationship, a set of LINTRACK tests was conducted, as shown in . These tests were carried out inside the test chamber, where temperatures were constantly monitored. Two different tests for the heating and cooling period were carried out. For the cooling test, the chamber was heated up to 27 °C, it was left to cool down to 13°C. The relationship between temperature development and time is identified in the same figures.
Figure 9. Temperature development at the top of the PA layer during: (a) cooling and (b) heating.
Effect of loading speed
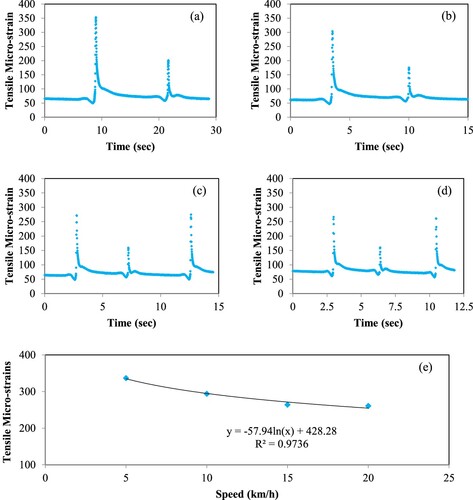
shows the horizontal tensile strains measured at the top of the PA surface layer in the transverse direction under different loading speeds (i.e. 5, 10, 15, and 20 km/h) and a constant load of 50 kN from the travelling wheel. Especially, the effect of loading speeds on the tensile strains is illustrated in (a–d), depicting the generation of lower measured strain responses at the top of the surface layer at increased loading speeds. This attribute of the dependence of tensile strain values on the speed of the wheel load is also shown in (e). The tensile strain results show marginal variation between 12-20 km/h, indicating no need to apply correction factors in this testing range.
Figure 10. Effect of speed; (a) 5, (b) 10, (c) 15, and (d) 20 km/h, at 50kN load, and (e) the relationship of speed with the horizontal tensile strains at the top of PA layer in the transverse direction in M–A section.
Effect of loading magnitude
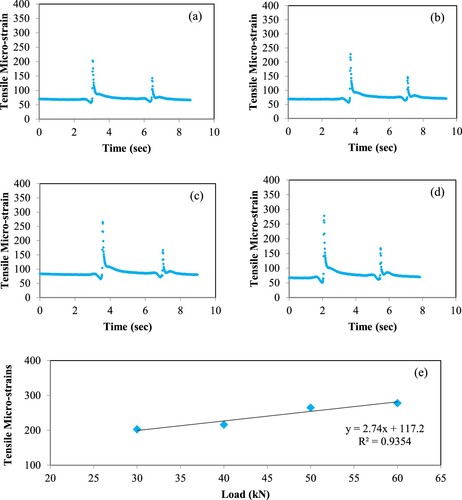
plots the transverse horizontal tensile strains under different loading levels (30, 40, 50, and 60 kN). The effect of the loading magnitude of a travelling wheel at a constant speed of 20 km/h and pressure of 900 kPa is illustrated in (a–d). It is clear from these figures that tensile strains at the top of the surface layer increase with the increase of the wheel load in a stepwise way. Such behaviour is also shown in (e), where a relationship between the loading levels of a travelling wheel and the measured tensile strains is established. Note that, in LINTRACK, the experimental program to evaluate the structural response of different pavement systems on the steel deck was conducted at 50 kN loading conditions. The main results are discussed below.
Figure 11. Effect of load; (a) 30, (b) 40, (c) 50, and (d) 60kN, at 900 kPa pressure and 20 km/h speed, and (e) the relationship of load with the horizontal tensile strains at the top of the PA layer in the transverse direction in the M–A section.
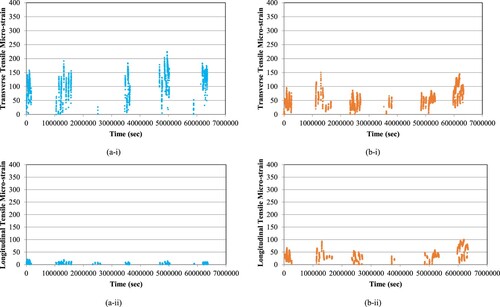
The referenced development of transverse tensile strains at the top of the PA surface layer in the M-A section is presented in (a). Neglecting practical variability, it can be seen that at this location in pavement structure on the steel deck, more or less tensile strains remain uniform. As such, no appreciable loss in stress carrying capabilities was seen even after 12 weeks of continuous loading. (a) similar plot at the top of PA surface layer in the transverse direction. A comparison of (a) indicates that strain development in the transverse direction is much higher than in the longitudinal direction. Moreover, the measured response at the corresponding layer in the M–C section is depicted in (b). This section exhibited a similar strain response from the M-A section but significantly lower tensile strains in the transverse direction. Counterintuitively, the strain response in the longitudinal direction of the M–C section was remarkably higher than that of the M-A section. This behaviour might suggest that the studied multilayer systems on steel decks can behave differently depending on the type of applied membranes at interfaces.
Figure 12. Development of the horizontal tensile strains at the top of PA surface layer in the (a) M–A and (b) M-C section in (i) transverse and (ii) longitudinal direction (at constant temperature of 20 °C).
The displacement readings measured by the SDMS between the membrane and surrounding layers were recorded in and . Especially, the slipping response between the top membrane and the PA layer in both studied sections and both transverse and longitudinal directions is demonstrated in . On average, the relative slip between these two layers had been higher in the transverse direction than the longitudinal one, with slightly higher displacement values in the M–C section.
Figure 13. Relative displacement between top membrane and PA in (a) M–A and (b) M–C section in (i) transverse and (ii) longitudinal direction.
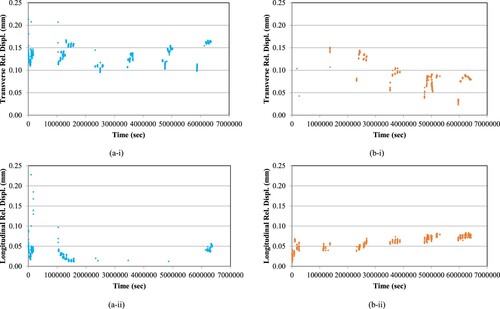
Figure 14. Relative displacement between bottom membrane layer and GA in (a) M–A and (b) M–C section in (a) transverse and (b) longitudinal direction.
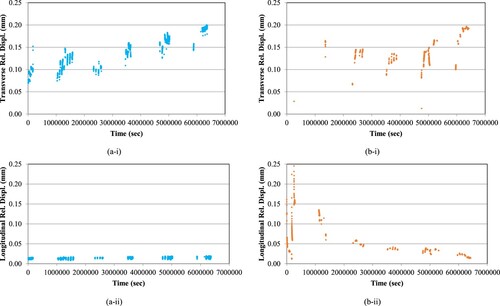
Furthermore, the displacement measurements between the bottom membrane and GA in both sections and directions are shown in . In contrast, the relative transverse displacements at this location were higher than those observed in . This attribute depicts the different interlayer responses of membranes at various locations on the superstructure, indicating the importance of membranes of the desired characteristics at locations closer to the steel decks.
Although the relative displacements, especially at the bottom membranes in the transverse direction, continued to increase with wheel load passes over time, the transverse strain values at the top of the PA layer did not alter considerably. That might be the reason for not noting surface distresses on either trial section after completing the experimental program. In a future study, special attention should be given to the actual debonding statues within the superstructure.
Conclusions
Based on the monitoring of load-induced strains and displacements of fully instrumented pavement systems on an orthotropic steel bridge deck at TU Delft, the main findings are follows:
After construction of the surfacing layers on the top of the steel deck, it was noticed that the strains were dependent on the wheel's speed, load, and temperature. Particularly, the effect of loading speeds on the tensile strains was evaluated by applying constant loading under different speeds. The results have shown lower measured strains at the top of the surface layer at increased load speeds. The effect of the loading at a constant speed was also assessed, making clear that the tensile strains at the top of the surface layer increase with the increase of the wheel load.
At the top of the PA surface layer, the tensile strains remain almost uniform in both transverse and longitudinal directions, as no appreciable loss in stress carrying capabilities was seen even at the end of the testing program, while the transverse strains were higher than those in the longitudinal direction. Moreover, the two trial sections exhibited similar behaviour in terms of strains, with some differences in strains indicating the influence of applied membranes at interfaces.
The displacement response between membranes and layers in both sections and directions was also evaluated. The relative interlayer slip had been higher in the transverse direction than the longitudinal one, with slightly higher displacement values in one of the studied sections, indicating the importance of membranes of the desired bonding at locations closer to the steel decks.
Overall, LINTRACK APT apparatus was able to run continuously for 12 weeks, and thermal analysis revealed that even during the winter season chamber was able to maintain the desired temperature. All the manufactured instrumentation devices, such as amplifiers, strain gauges and shear displacement sensors, also performed well, and none of them failed during measurement. By reproducing in-service conditions, accelerated tests by means of the LINTRACK APT facility provided an additional and conclusive means for verification of the capabilities of the laboratory facilities in ranking and predicting the field response of membranes at TU Delft. In a future study, special attention might be given to the actual debonding performance of various components of superstructures designed for orthotropic steel bridge decks and also other advanced pavement systems.
Disclosure statement
No potential conflict of interest was reported by the author(s).
References
- Al-Qadi, I., and Wang, H., 2009. Full-Depth pavement responses under various tire configurations: accelerated pavement testing and finite element modeling. Asphalt Paving Technology: Association of Asphalt Paving Technologists – Proceedings of the Technical Sessions, 78, 721–759.
- American Institute of Steel Construction - AISC, 1963. Design manual for orthotropic steel plate deck bridges. New York: American Institute of Steel Construction.
- Choubane, B., et al., 2006. Evaluation of coarse- and fine-graded superpave mixtures under accelerated pavement testing. Transportation Research Record: Journal of the Transportation Research Board 1974, TRB, National Research Council, Washington, D.C., 120–127.
- Connor, R.J. J. Fischer, et al., 2012. Manual for Design, Construction, and Maintenance of Orthotropic Steel Deck Bridges. Federal Highway Administration, FHWA-IF-12-027.
- de Jong, F.B.P, 2007. Renovation techniques for fatigue cracked orthotropic steel bridge decks. Unpublished thesis. Delft University of Technology.
- Greene, J., et al, 2015. Evaluation and implementation of PG 76-22 asphalt rubber binder in Florida. Transportation Research Record: Journal of the Transportation Research Board 2524, TRB, National Research Council, Washington, D.C., pp. 3–10.
- Gurney, T. Fatigue of Steel Bridge Decks. 1992.
- Harvey, J., and Popescu, L., 2000 Accelerated pavement testing of rutting performance of two caltrans overlay strategies. Transportation Research Record: Journal of the Transportation Research Board 1716, TRB, National Research Council, Washington, D.C., pp. 116–125.
- Jansen, D., Wacker, B., and Pinkofsky, L., 2018. Full-scale accelerated pavement testing with the MLS30 on innovative testing infrastructures. International Journal of Pavement Engineering, 19 (5), 456–465.
- Leendertz, J.J, 2008. Fatigue behaviour of closed stiffener to crossbeam connections in orthotropic steel bridge decks. Unpublished thesis. Delft University of Technology.
- Li, J, 2015. Optimum design of multilayer asphalt surfacing systems for orthotropic steel deck bridges. [Unpublished thesis]. Delft University of Technology.
- Liu, X., et al., 2013. Test method to assess bonding characteristics of membrane layers in wearing course on orthotropic steel bridge decks. Transportation Research Record: Journal of the Transportation Research Board 2360, TRB, National Research Council, Washington, D.C., pp. 77–83.
- Liu, X., et al., 2019. Modelling of five-point bending beam test for asphalt surfacing system on orthotropic steel deck bridges. International Journal of Pavement Engineering, 22 (11), 1469–1490.
- Liu, X., et al., 2022a. Modelling of membrane bonding response: part 1 development of an adhesive contact interface element. International Journal of Pavement Engineering, 23 (3), 612–625.
- Liu, X., et al., 2022b. Modelling of membrane bonding response: part 1 development of an adhesive contact interface element. International Journal of Pavement Engineering, 23 (3), 626–637.
- National Academies of Sciences, Engineering, and Medicine, 2012. Significant findings from full-scale accelerated pavement testing. Washington, DC: The National Academies Press.
- Romanoschi, S.A., et al, 1999. Assessment of pavement life at first full-scale accelerated pavement test in Louisiana. Transportation Research Record: Journal of the Transportation Research Board 1655, TRB, National Research Council, Washington, D.C., pp. 219–226.
- Tzimiris, G., et al., 2015. Prediction of fatigue life of membrane on orthotropic steel bridge decks. Transportation Research Board, 94th Annual Meeting.
- Tzimiris, G, 2017. Experimental investigation of membrane materials used in multilayer surfacing systems for orthotropic steel deck bridges. [Unpublished thesis]. Delft University of Technology.
- Zhang, H., et al., 2018. Comparison of different micromechanical models for predicting the effective properties of open graded mixes. Transportation Research Record: Journal of the Transportation Research Board 2672(28), TRB, National Research Council, Washington, D.C., pp. 404–415.