
 ?Mathematical formulae have been encoded as MathML and are displayed in this HTML version using MathJax in order to improve their display. Uncheck the box to turn MathJax off. This feature requires Javascript. Click on a formula to zoom.
ABSTRACT
Surface hot-in place recycling of asphalt mixtures has been conducted on Finnish roads for several years. The procedure is performed either in full-lane('remix') or shorter widths ('rut-remix'). In a 2020-2021 project, different mixture types were subjected to both kinds of recycling; reference mixtures, and mixtures modified with aramid fibres, FEP elastomer pellets, polymer, Storelastic rubber additive, recycled asphalt shingles, steel slag, and soft bitumen. This paper (Part II) presents the results of an extensive laboratory test plan at the bitumen scale. Asphalt mixture cores were recovered from four roads, and the bitumen was extracted fortesting. Various tests were performed on the bitumens in original state (aged, before recycling) and after recycling (remix or rut-remix), including FT-IR, DSR, MSCR, as well as bitumen content, penetration, and softening point. The master curves were constructed for all bitumens. Gradations are also presented herein. The effect of remix/rut-remix is evaluated via changes in all measured properties (including Glover-Rowe) before and after recycling, over a wide range of temperatures. The results complement the mixture-scale data and provide a comprehensive database of bitumen performance for an extended group of materials. Data appendices are accessible from the link at the bottom of the page.
1. Introduction
Hot-in-place recycling of surface asphalt layers, locally called remix (REM) and rut-remix (RUT-REM, a type of shorter-width remix), is a common rehabilitation approach in Finland. It is a cost-efficient treatment with environmental and economic advantages, which have led transportation agencies to apply it for several years (Apilo and Eskola Citation1999, Makowska et al. Citation2017a). Simultaneously, as more roads are being built with different types of modified and alternative asphalt mixtures, the Finnish Transportation Agency (Väylä) is interested in studying the effect of remix on these materials, and how the results differ from the remix of traditional asphalt mixtures. Alternative asphalt mixtures include modified mixtures, mixtures with very soft bitumen, and mixtures where industrial and construction wastes have partially replaced aggregates and/or binder.
The materials of a road may still retain part of their original mechanical integrity even several years after the original construction. In particular, hot mix asphalt is a combination of granular aggregates (rocks), bitumen (asphalt), air, and potentially other materials in smaller quantities (additives, industrial wastes). Recycling of these materials is an alternative that offers economic and sustainability-related advantages. Aggregates are subject to relatively low deterioration, mainly cracking, and sometimes surface chemical changes depending on the aggregate source. The bitumen in an asphalt mixture is subjected to aging during its life, especially on the road’s surface. Aging is caused by the exposure of bitumen to oxygen in the air, as well as high temperatures, and UV radiation. Aging is a non-reversible chemical process, and it generally causes the bitumen to become stiffer and more brittle. As a viscoelastic material, bitumen behaves more like a solid and less like a viscous substance when it ages. To counter the effect of the stiffer material, i.e. to ‘rejuvenate’ the bitumen, it is possible to use chemical agents, or to add softer neat bitumen during the hot-in-place recycling (Aromaa Citation2016). An important amount of research work has been conducted on asphalt recycling, including traditional as well as innovative rejuvenators and their dosages (Wang et al. Citation2019, Sánchez et al. Citation2020). Effects like differential aging (Ferreira et al. Citation2021), high usage of recycled material (Yu et al. Citation2016), and overall the difficulties associated with ensuring a level of homogeneity in recycled materials are generally recognised as challenges when dealing with recycled asphalt.
The objective of this project is, therefore, to study the effect of remix and rut-remix on modified and alternative asphalt mixtures in Finnish roads. For this purpose, we assess the change of a set of properties before and after remix/rut-remix for a set of bitumens. This document describes the results of laboratory testing at the bitumen scale, and it complements Part I (Mixture scale).
2. Road sites and materials
The materials of the project originated from four roads in Finland. The roads are Ylöjärvi (Ylö), Kilvakkala (Kil), Riihimäki (Riihi), and Oulu. The roads are identified with a short label and a symbol, as presented in . Roads and materials after REM/RUT are marked with a star.
Table 1. Roads, codes, and conventions of the project.
A relatively wide set of modified or alternative asphalt mixtures were part of this project. The data thus follows a system of conventions and colours to facilitate the presentation and interpretation of the results. The materials were identified using the name of the modifier or the most relevant characteristic of the mixture, as follows: aramid fibre (ARA), rubber elastomer pellet (FEP), polymer-modified (KB, for its initials in Finnish), soft bitumen (PAB, for its initials in Finnish), Storelastic tyre rubber powder (STO), recycled asphalt shingles (RAS), and slags (OKTO). A summary of the materials and the four roads of origin is presented in . Following are some comments related to the materials and traffic conditions of the roads of the project. The roads in Ylöjärvi and Kilvakkala were built during 2015–2017 as part of an effort to evaluate the effect of additives (Valkonen Citation2020).
Table 2. Roads and materials of the project.
2.1. Ylöjärvi (MT 2773)
The last reconstruction of the road (previous to REM) was in August 2015. Details regarding the last road reconstruction can be found in Rossi (Citation2016). Next is some information on the materials used for this reconstruction:
REF in Ylöjärvi was asphalt concrete AB 16 (AB, asfalttibetoni in Finnish), i.e. asphalt concrete with nominal maximum aggregate size ∼16 mm, with binder 70/100. These are the same specifications for Kilvakkala REF.
ARA was asphalt concrete AB 16 with binder 70/100. ARA additive proportion was 0.05% (same as in Kilvakkala). ARA fibres were incorporated separated into small bags, after the bitumen, directly to the mixer (mixing time was 10 seconds). The fibres incorporated well, and the mixture did not experience changes in workability or compact-ability (Valkonen Citation2020).
FEP was asphalt concrete AB 16 with binder 70/100. FEP additive proportion was 0.66%. FEP pellets were added directly into the mixer, with the aggregates, before the binder was added. Dry and wet mixing times were 10 seconds (Valkonen Citation2020). This additive increases the need for binder.
KB was asphalt concrete AB 16 with binder KB 75. This denomination indicates a polymer-modified bitumen with softening point between 70 and 75°C and penetration 40–130 dmm (PANK Citation2017).
PAB was asphalt concrete with penetration-graded binder PAB-B B 650/900. PAB-B is a mixture with soft bitumen that can be used as an alternative to traditional asphalt mixture for average daily traffic below 2500 vehicles/day, and not on roads that are regularly salted (Finnish Transport Infrastructure Agency Citation2018).
At the time of construction, the average annual daily traffic (ADT) for the most part of the road site was 1723 (62) vehicles/day, of which 62 vehicles were classified as heavy traffic. The road was classified as a low volume road (Rossi Citation2016). In 2021, the ADT is reported as 1939 vehicles/day (Finnish Transport Infrastructure Agency Citation2021), a 12.5% increase. The speed limit varies from 60 to 80 km/h (Valkonen Citation2020). The life of the Ylöjärvi road at the time of remix was around 5 years. According to a report on service life analyses (Suikki and Spoof Citation2018), roads with ADT between 1500 and 2000 vehicles/day may rut at an average rate of 1 mm per year. Following the same report, remix is expected to reduce the service life between 14 and 43% in average compared to a traditional construction of the road.
After the last construction, the mechanical properties of the materials were reported to be on level with the reference material. However, the Ylöjärvi road was in relatively bad condition before REM, even when its age was about 5 years at the time of REM. The sections suffered from unexpected rapid damage and had rutted considerably, reaching ∼2 mm/year (Valkonen Citation2020). In her work, Rossi (Citation2016) also alerted about potential deficiencies in the drainage system of the Ylöjärvi road. This may be a relevant warning for the materials that exhibited moisture susceptibility in this road (particularly FEP, see Part I).
2.2. Kilvakkala (KT 261)
The last reconstruction of the road previous to RUT-REM was in August 2017. The reconstruction of the Kilvakkala road is reported by Valkonen (Citation2020). Following is some information on the materials used in the road:
REF in Kilvakkala was asphalt concrete AB 16 with binder 70/100 (same as Ylöjärvi REF).
ARA was asphalt concrete AB 16 with binder 70/100. ARA additive proportion was 0.05% (same as in Ylöjärvi).
FEP was asphalt concrete AB 16 with additive proportion was 0.675%. In contrast to Ylöjärvi, in Kilvakkala the binder used for FEP was KB 65.
KB was asphalt concrete AB 16 with binder KB 65. The denomination indicates a polymer-modified bitumen with softening point between 65 and 70°C and penetration 75–130 dmm.
STO was asphalt concrete AB 16 with binder KB 65. STO additive proportion was 0.575%. STO was mixed with the warm aggregates before the addition of the bitumen. This additive increases the need for binder, and it also added some difficulty to the compaction (Valkonen Citation2020). The road in Kilvakkala was the first Finnish experience using STO as an asphalt additive.
At the time of RUT-REM, the Kilvakkala road had not yet reached the threshold for maintenance (i.e. 16–20 mm ruts); however, it was included in the study to test the behaviour of the materials under this treatment. Therefore, the road was subject to cold milling to ‘artificially’ create ruts previous to the RUT-REM treatment. No other large deteriorations were identified on this road; in contrast, deterioration was large in Ylöjärvi and Oulu. Generally, this road section was in relatively good condition before the reconstruction; however, rutting was considered high, at a rate of 1–1.2 mm/year for all materials except for KB (Valkonen Citation2020). After the reconstruction, rutting rates of all materials except for KB increased to 1.5–2 mm/year. These values are high considering the traffic level and life of the road. The life of the Kilvakkala road at the time of RUT-REM was around 3 years. The road had a traffic volume of approximately 1600 vehicles/day by the time of the last reconstruction (Valkonen Citation2020). This number is measured as 1512 vehicles/day in 2021 (Finnish Transport Infrastructure Agency Citation2021).
2.3. Riihimäki (MT 2879)
Previous to RUT-REM, the Riihimäki road was built in the autumn of 2015, with approximately 50% recycled material. The last reconstruction of the Riihimäki road was reported by Heinonen (Citation2017).
REF in Riihimäki was AB 16 RC50. ‘RC’ denotes the proportion of crushed aged asphalt pavement in the recycled asphalt. This means that of the 5.3% target binder content, 2.35% was reclaimed asphalt and 2.95% was added bitumen (160/220) (Heinonen Citation2017). This bitumen is added to counteract excessive hardening.
RAS was AB 16 RC50, plus 2% recycled from asphalt shingles. Of the 5.3 target binder content, 2.35% was reclaimed asphalt, 1.08 was RAS, and 1.87% was the added 160/220 bitumen (Heinonen Citation2017).
The life of the Riihimäki road at the time of RUT-REM was about 5 years. The traffic volume of the road in 2016 was 1699 vehicles/day at the time of reconstruction (Heinonen Citation2017), and this number increased slightly to 1746 vehicles/day in 2021 (Finnish Transport Infrastructure Agency Citation2021). The speed limit of the road was 80 km/h. The road maintained a relatively good condition after its construction. No large distresses were reported on this road; in contrast, deterioration was large in Ylöjärvi and Oulu. At the time of the last reconstruction, there were no significant performance differences between REF and RAS material properties (Heinonen Citation2017). Similarly to Kilvakkala, the Riihimäki road was subject to cold milling before RUT-REM.
2.4. Oulu (VT 4 and MT 847)
OKTO is air-cooled and weathered ferrochromium slag aggregate (Makowska et al. Citation2015). This material has a high resistance to abrasion in the laboratory, and previously it has worked relatively well under low traffic. Overall, OKTO has some properties that may be challenging from the point of view of the road infrastructure construction, including susceptibility and influence of water and low capacity to transfer heat, which makes effective heating of the material during remix difficult. While the slag particles are highly resistant to abrasion, chemical reactions on their surface may decrease the quality of the bond with the binder, which facilitates the rutting of the mixture. The loss of bond is worsened by the expansion of the material when new surfaces are exposed to the weather. Currently, the Finnish Asphalt specifications set limits to the volume expansion for slag aggregates, but this change first came in force with the latest specifications (PANK Citation2017). In addition to weathering, heating and milling themselves may contribute partially to the swelling of the material.
Previous experiences using slag aggregate in northern Finland have found that the roads presented accelerated rutting, rough wearing courses (potentially denoting ravelling), and lack of adhesive bond at the interface between mastic and large aggregates. The risks during recycling of slag material are connected with the polishing of the surface by studded tyres right before the recycling, which traps the polished and un-weathered layer inside of the pavement in the following life cycle. This in turn may lead to increased ravelling. More details are provided by Makowska et al. (Citation2015).
The traffic volume of the road VT4 (OKTO SMA) is 19,440 vehicles/day in 2021 (Finnish Transport Infrastructure Agency Citation2021). On the other hand, the traffic volume of the road MT 847 (OKTO AC) is 6072 vehicles/day in 2021 (Finnish Transport Infrastructure Agency Citation2021). During the present project, there were no problems reported for the OKTO material regarding ignition during REM.
3. Test plan
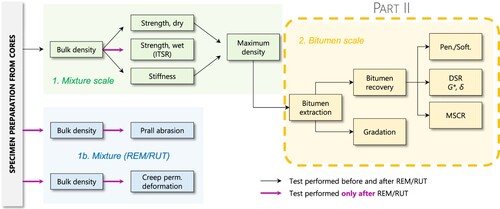
A test plan was proposed to evaluate the performance of the materials at the mixture and bitumen scales. The tests at the bitumen scale include traditional tests (penetration and softening point), characterisation using Dynamic Shear Rheometer (DSR) with two plate sizes (4 and 8 mm), and Multiple Stress Creep Recovery (MSCR). The quality of bitumen extraction was checked using FT-IR. Gradation results are also presented in this paper. The test plan is presented in . The results at the mixture scale are presented in Part I.
Figure 1. Flowchart of the test plan. Bitumen scale results are presented herein. Mixture scale results are presented in Part I.
4. Laboratory test results. Bitumen scale
This section summarises the data that was measured and obtained at the bitumen scale: FT-IR spectra, bitumen content, penetration, softening point, DSR, and MSCR. The gradations of the recovered material are included here as well. As a general rule, the bitumen was extracted from the specimens that were tested for stiffness at the mixture scale. There were always at least four stiffness specimens available per material (depending on the road of origin, in two locations: AV and RV). The maximum density of the mixture, presented in Part I, was also measured from these specimens. After this stage, the material was used for the extraction and recovery of bitumen, determination of the gradation, and the bitumen performance tests.
4.1. Preliminary analysis of aging using Fourier transform infrared spectroscopy (FT-IR)
The FT-IR test was performed to establish the quality of the bitumen extraction (CEN/TS-17337 Citation2019). The spectra measured for the all the materials before and after REM/RUT is presented in Appendix 1. The bitumen was extracted from the specimens of asphalt mixture using dichloromethane (DCM) as a solvent. The equipment used was a Strassentest (A01140) automatic binder extraction machine type 520. During extraction, the bitumen solves into the DCM phase, while the clean aggregate stays in the sieves, and the fines stay in the centrifuge. In the case of ARA material, the fibres stayed with the clean aggregates on extraction.
The extraction machine distils about 700 ml of solution, still containing solvent. The solvent is further evaporated using a Buchi Rotavapor R-205 equipment. It is desirable that the solvent is not present after extraction, to preserve the viscosity (the solvent may cause it to decrease) and the performance grade of the bitumen. Therefore, spectroscopy was used to evaluate if the DCM solvent was still detectable in the sample. An FT-IR equipment (Nicolet iS50 with PIKE GladiATR) was used to evaluate if the bitumen was clean from solvent. An evaluation was done to observe the presence or absence of a peak in the wavelength band around 1260 cm−1, associated with the DCM solvent. For most bitumens it was found that there was no peak or a relatively small peak in this area, indicating an acceptable quality of the extracted bitumen.
It has been proposed to used FT-IR results as part of quality controls during recycling of asphalt (Makowska et al. Citation2017b). From the perspective of spectra, aging is associated with increased absorbance overall in the spectre, especially for wavelengths around 1700 cm−1 (peak of carbonyls) and 1030 cm−1 (peak of sulfoxides) (Qin et al. Citation2014). From the measured spectra, both of these peaks are visible in almost all bitumens, before and after REM/RUT, consistent with their aged nature. Overall, the spectra for most of the bitumens moved down after REM/RUT (i.e. less absorbance). This is indicative of a rejuvenation process, as the spectre of absorbance increases with aging (Qin et al. Citation2014). Still, after REM the spectra of Ylö-FEP* and Oulu-OKTO AC* did not change significantly. In Appendix 1, the order of presentation of the spectra facilitates the comparison between aged and rejuvenated material.
Applying the same principle as with the DCM, and focusing on the characteristic peaks for polymers, it is possible to determine if the polymer passed through to the extracted bitumen. Polymer peaks are around 966 and 700 cm−1. This technique has been applied and recommended by previous works in the literature (Zofka et al. Citation2015, Heinonen Citation2017). With this information, it was possible to observe distinctive polymer-related peaks on some bitumens (Ylö-KB, KB*; Kil-KB, KB*; Oulu-OKTO SMA, OKTO SMA*), and smaller peaks on other bitumens (Ylö-FEP, FEP*, Kil-FEP, FEP*, Riihi-RAS, RAS*). It was observed that the polymer-like quality was exhibited by the same bitumens before and after REM/RUT.
4.2. Gradations
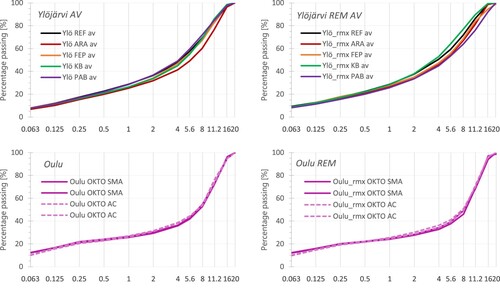
The particle size distribution of the aggregates recovered after extraction was determined for all materials (SFS-EN-12697-Citation2019+A1 Citation2019). A total of 56 gradation curves were tabulated, for the materials before and after REM/RUT, in AV and RV locations where appropriate. The summary of all the gradation curves is presented in Appendix 2. Perhaps the most important observation from the gradations is that that the two materials in Oulu (OKTO SMA and OKTO AC) follow the same or a very similar SMA gradation before and after REM, despite being labelled as SMA and AC. Some examples of gradation curves are presented in .
Figure 2. Example of gradations of the materials from the project, before and after REM. Notice that the materials labelled OKTO SMA and OKTO AC both follow and SMA-type gradation.
To establish the change experienced by the gradation during REM/RUT, the change in percentage passing each sieve is presented in . As observed, most of the gradations were noticeably modified during the treatment. The gradations became predominantly finer after REM/RUT. This happened particularly in the mid-size sieves (1–11 mm), which experienced the largest changes in percentage passing during REM/RUT. These changes were comparatively larger under RUT-REM. In contrast, the originally coarse OKTO SMA and OKTO AC became coarser in the same range, while PAB became clearly coarser (AV location) or only slightly (RV location). The change in gradation was overall erratic. Some materials became clearly finer or slightly coarser, alternatively for the AV and RV locations. For example, Ylö-KB became finer (both AV and RV locations), but Ylö-ARA became finer for AV while RV changed little. At the same time, some gradations were affected relatively little by the treatments (Ylö-FEP/AV, Ylö-REF/RV, Ylö-ARA/RV, Kil-REF).
Figure 3. Change in percentage passing (gradations), after REM/RUT. (a) Ylöjärvi, (b) Kilvakkala, (c) Riihimäki, (d) Oulu. Notes. Changes in the AV and RV locations are presented separately for Ylöjärvi, Kilvakkala and Riihimäki. A diagram with the AV/RV locations is presented in Paper I.
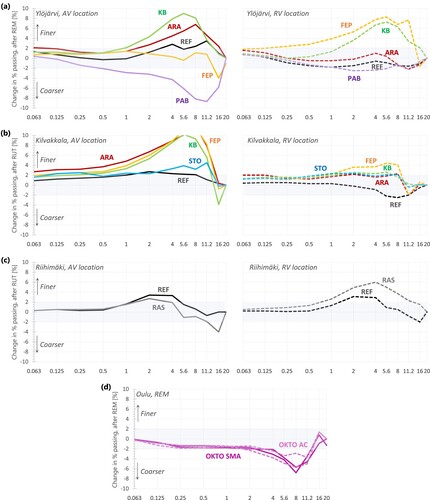
The change is gradation depends on the particle size distribution of the aggregates in the mixture added during REM/RUT, and it may be indicative of the quality of homogenisation during construction. Once again, these differences highlight that the REM/RUT processes are highly heterogeneous. Some materials did experience a relatively similar change in AV and RV locations (Ylö-KB, Kil-STO, Riihi-REF). This could be taken as an indication of homogeneity during REM/RUT.
4.3. Bitumen content
The bitumen content was established from compounded samples. When applicable, two AV samples and two RV samples were compounded per material into one AV and one RV sample to keep the distinction between AV and RV origins of the cores (Ylöjärvi and Kilvakkala REM/RUT; Riihimäki RUT-REM). The summary of bitumen contents for all materials is presented in . From this point on, recall that the ARA bitumen does not contain fibres after extraction.
Figure 4. Bitumen content of the specimens, before and after REM/RUT, all roads. Ylöjärvi (●), Kilvakkala (▴). The values from Ylöjärvi are linked with a line. Notes: STO before REM is likely lower than presented. ARA bitumen does not contain fibres after extraction.
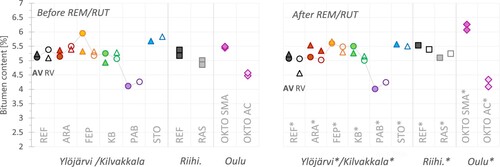
The lowest bitumen contents (<4.5%) were measured for PAB before and after REM, and OKTO AC*. On the other hand, the largest bitumen contents (around and above 6%) were in Ylö-FEP/AV and OKTO SMA*. On average, most materials had bitumen contents between 5 and 5.5%, before and after REM/RUT. These bitumen contents are in line with the guidelines for normal mixture (∼5%), PAB (∼4%), and SMA (∼6%). Regarding Kil-STO, the bitumen content may be smaller than presented in , as there was an amount of bitumen stuck to the sieve during the extraction process.
Mostly, there was high consistency among AV/RV and redundant samples. The largest internal differences occurred between the AV and RV samples of Ylö-FEP, Ylö-KB*, and Kil-REF*. These differences are larger than the ±0.5%, tolerance provided by the Asphalt standard (PANK Citation2017). However, the standard indicates that this limit is not intended for samples that may have been combined with old coatings (recycled). This suggests that while relatively large, these variations may be appropriate and proportional to a high-variability process such as REM/RUT.
The corresponding change in bitumen content after REM/RUT is presented in . The bitumen content changed between ±0.6%, sometimes increasing or decreasing for the AV and RV locations. Bitumen content may increase due to a large amount of bitumen in the added mixture. The bitumen content in PAB changed little at both AV and RV locations. After RUT-REM, the asphalt content of most materials increased in average, except Kil-REF and STO. Similarly to the air voids, the bitumen content to one side of the rut was mostly unaffected. This was also the case during REM for Ylö-REF, ARA, KB and PAB. The bitumen content of OKTO SMA increased importantly after REM (0.7% increase). This material was found to be over-compacted, and with air void contents close to 0% (see Part I). No apparent correlation was found between bitumen content and the average air voids of the specimens.
Figure 5. Change in bitumen content after REM/RUT. Ylöjärvi (●), Kilvakkala (▴). The values from Ylöjärvi are linked with a line. ARA bitumen does not contain fibres after extraction.
4.4. Traditional tests (penetration and softening point)
As it has been observed, the distinction between the original locations of the specimens (AV and RV) was maintained as much as possible during the project. After the extraction and measurement of bitumen content, the bitumen obtained from the stiffness specimens was compounded. This means that the AV/RV distinction is lost at this point, and a unique measurement will characterise each bitumen from this point on.
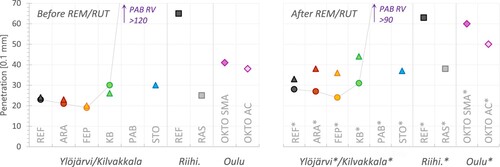
The penetration was tested at 25°C for the compounded bitumens. The summary of penetration values is presented in . The materials were quite aged already before the treatment. Penetrations between 20 and 40 (before REM/RUT) and between 25 and 60 (after REM/RUT) were measured for all materials except PAB (122 before, 92.5 after REM) and Riihi-REF (65 before RUT-REM). Before and after REM/RUT, PAB and Riihi-REF behave as the softest bitumens of the group, followed by OKTO SMA and OKTO AC. In fact, PAB appears to have aged considerably during the life of the Ylöjärvi road. The penetration went down to 122 from an original 650/900 (Rossi Citation2016). This penetration is even below the 250/330 minimum penetration defined by the asphalt standard for PAB material (PANK Citation2017).
Figure 6. Penetration for all bitumens, before and after REM/RUT. Ylöjärvi (●), Kilvakkala (▴). The values from Ylöjärvi are linked with a line. Notice that one bitumen has been compounded per material from the AV and RV specimens. ARA bitumen does not contain fibres after extraction.
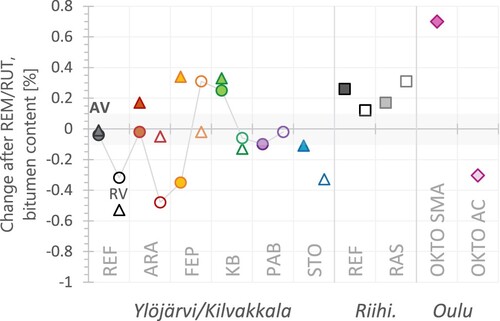
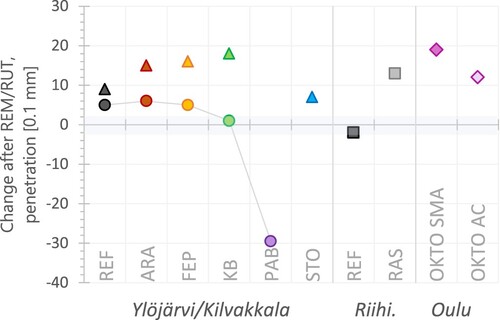
The corresponding change in penetration after REM/RUT is presented in . Penetration increased for most materials after REM/RUT. PAB was the only material to reduce its penetration after REM, as the heating process likely contributed to the aging of this soft bitumen. The increase in penetration is consistent with the expected rejuvenation for most bitumens, which aims to make the asphalt softer. After REM, the penetration of Ylö-REF, ARA and FEP increased by ∼5 dmm, while OKTO SMA and OKTO AC increased considerably, more than 10 dmm. The penetration of KB remained almost constant. On the other hand, RUT-REM in Kilvakkala and Riihimäki increased the penetration of most materials by 10 dmm or more, reaching 15–20 dmm for Kil-ARA, FEP, and KB. The penetration of Riihi-REF remained similar after RUT-REM, but comparatively, it was still quite high among the materials from the project.
Figure 7. Change in penetration after REM/RUT. Ylöjärvi (●), Kilvakkala (▴). The values from Ylöjärvi are linked with a line. ARA bitumen does not contain fibres after extraction.
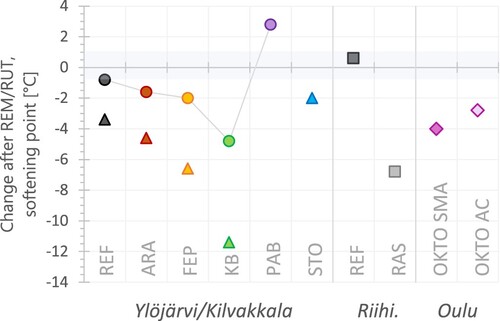
The summary of softening point is presented in and the corresponding change after REM/RUT in . As observed before, PAB, Riihi-REF, OKTO SMA and OKTO AC were the softest bitumens of the group. For all other materials, the softening point was close and above 60°. Overall, the softening point of most bitumens reduced after REM/RUT. This again is consistent with the process of rejuvenation of the bitumen. Ylö-REF, ARA and FEP were moderately affected by REM, while KB, OKTO AC and OKTO SMA had larger reductions in softening point. ARA, FEP and KB were more strongly affected after RUT-REM than REM. Riihi-REF and STO were the materials least affected by RUT-REM, while KB reduced its softening point the most after both treatments. The softest materials (PAB, Riihi-REF) were the only ones to increase their softening point after REM/RUT, likely as a consequence of aging.
Figure 8. Softening point for all materials, before and after REM/RUT. Ylöjärvi (●), Kilvakkala (▴). The values from Ylöjärvi are linked with a line. One bitumen has been compounded per material from the AV and RV specimens. ARA bitumen does not contain fibres after extraction.
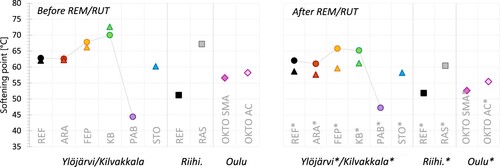
Figure 9. Change in softening point after REM/RUT. Ylöjärvi (●), Kilvakkala (▴). The values from Ylöjärvi are linked with a line. ARA bitumen does not contain fibres after extraction.
4.5. DSR, dynamic shear rheometer
The DSR test measures the complex shear modulus and the phase angle for a sample of bitumen at a range of frequencies and temperatures (SFS-EN-14770 Citation2012). In this project, two plate geometries were used: 8 and 4 mm. The test consisted of a temperature/frequency sweep, ranging from 0 to 70°C for the 8-mm plate (10°C step, 0.01–10 Hz, 2 mm gap), and from 6 to −30°C for the 4-mm plate (6°C step, 0.16–15 Hz, 1.75 mm gap). Different strain levels were achieved during the testing, between 0.01% and 10%. Criteria for the selection of the DSR test parameters included an interest in high frequencies and low temperatures (performance to studded tyres), intermediate temperatures (performance to rutting), and low frequencies and low temperatures (performance to thermal cracking), as well as a fast approach to testing. The test plan was devised in this way aiming for efficiency in testing and comparability of the results, as we will focus on the change of the properties between the aged state (before remix/rut-remix) and the rejuvenated state (after remix/rut-remix) measured at the same testing conditions. The rheometer used was an Anton Paar MCR 302. The rheometer automatically corrects the compliance at low temperatures taking into account separate contributions of the components of the equipment, as well as temperature and other environmental conditions. Compliance values are machine-dependent; the values are calibrated directly by the manufacturer of the rheometer using standardized specimens and materials.
shows the range of temperatures that yielded meaningful results for DSR in the frequency range tested. At high temperatures, the results at 60 and 70°C were erratic or failed for most bitumens. The behaviour of the phase angle was most erratic at high temperatures (>50°C) and frequencies above 1 Hz. Several bitumens lost performance at high temperatures after REM/RUT. REM seemed to affect the high temperature behaviour (i.e. Ylö-ARA, FEP, KB), except if the bitumens were soft (PAB, OKTO AC); the exception was OKTO SMA. After RUT-REM, performance also reduced to a lower degree. Meanwhile, at low temperatures some of the tests failed to provide meaningful results as the bitumen cracked. Most of the bitumens that were not ‘soft’ as per traditional tests were able to perform at equal or lower temperatures after REM/RUT (i.e. Ylö-ARA, FEP; Kil-ARA, FEP, KB, STO). However, the softer bitumens (PAB, Riihi-REF, OKTO SMA, OKTO AC) as well as Ylö-REF, Ylö-KB, and RAS saw their low-temperature performance negatively affected by REM/RUT. A complete summary of the shear complex modulus and phase angle test results for all bitumens is presented in Appendix 3 (all frequencies and temperatures). This appendix also includes the Black diagram curves, i.e. plots of complex modulus versus phase angle.
Table 3. Range of temperatures with meaningful DSR results within the tested frequency range, all bitumens, before and after remix/rut-remix.
It is possible to provide a continuous representation of the data using a master curve approach. This manipulation facilitates the analysis along a wide range of temperatures and frequencies, and the comparison of results from different materials. The quality, smoothness, and continuity of the master curve should be high for thermo-rheologically simple materials, such as unmodified asphalt (Airey Citation2002). However, polymer-modified bitumens may not follow this behaviour (i.e. KB). For each bitumen tested, the modulus and phase angle data at each temperature can be shifted ‘horizontally’ (along the frequency axis) with shift factors unique per temperature (aT) until all the data segments lie in a continuous curve (master curve). A temperature may be selected to remain unshifted (aT = 1); this is the reference temperature. It is common to correlate aT values and temperatures using the WLF shape:
(1)
(1) where aT is the shift factor, T is the associated temperature, Tref is the selected reference temperature, and C1 and C2 are fitting constants.
The values of aT were calculated for all the tested temperatures to produce master curves for the bitumens before and after REM/RUT. This was done separately for the 8-mm and 4-mm data. The reference temperature was 20°C for the 8-mm data (range, 0–70°C), and −6°C for the 4-mm data (range, −30–6°C). The fitting constants (C1 and C2) for the calculation of the shift factors and their corresponding temperature ranges following the WLF fit, for both plate sizes, are presented in Appendix 5. Here, the WLF fit was limited to the temperatures with meaningful results for modulus and phase angle (see ).
A sigmoidal asymmetric curve was used to fit the data. The selected model was a generalised logistic sigmoidal accounting for the effect of non-symmetry (Rowe et al. Citation2009). Some sources include the logarithm operator on the variable being fitted (Rowe et al. Citation2009), and some not (Forough et al. Citation2016). However, both alternatives are possible, as the sigmoidal is used herein as a fitting tool rather than to extrapolate. The equation used to fit the master curves was similar to that used by Liu et al. (Citation2020). The equation is as follows:
(2)
(2) where G* is the complex shear modulus (Pa), and fr is the reduced frequency (Hz). α, β, γ, δ, and λ are fitting constants. Notice that δ is not the phase angle. The same equation was used to fit the phase angle φ (°), i.e. replacing the modulus with the phase angle in the equation. The calculated fitting parameters of the master curves for all bitumens are presented in Appendix 5. For all bitumens, δ was taken as 0, and α as 1 × 10⁹ Pa (when fitting modulus) or 90 degrees (when fitting phase angle).
illustrates the process of shifting the original data and fitting a master curve for modulus and phase angle (Kil-ARA*). The temperatures are also shown over the horizontal axis as an indication of the origin of the segment data. A complete summary of the fitted master curves of the bitumens of the project (complex shear modulus G* and phase angle φ), before and after REM/RUT, is presented in (before) and (after). The summary showing the shifted segments and the fitted curves is presented in appendices (8-mm, 4-mm). The corresponding change diagrams were calculated for complex modulus and phase angle. A change diagram presents the percentage change of a property before and after REM/RUT. The change diagrams are presented in .
Figure 10. Illustrating the process of shifting original data towards a master curve. Notice the shift factors (aT) and the reference temperature 20°C. (a) Complex shear modulus, (b) phase angle. Bitumen: Kilvakkala ARA* after REM, 8-mm.
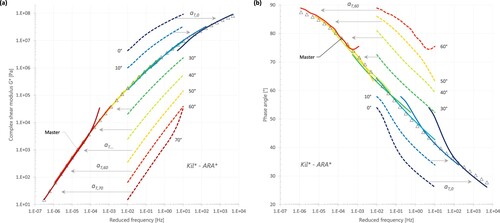
Figure 11. Master curves, (a) shear complex modulus and (b) phase angle, for all bitumens before REM/RUT. Left side: 8-mm plate (70 to 0°C). Right side: 4-mm plate (6 to −30°C). ARA bitumen does not contain fibres after extraction.
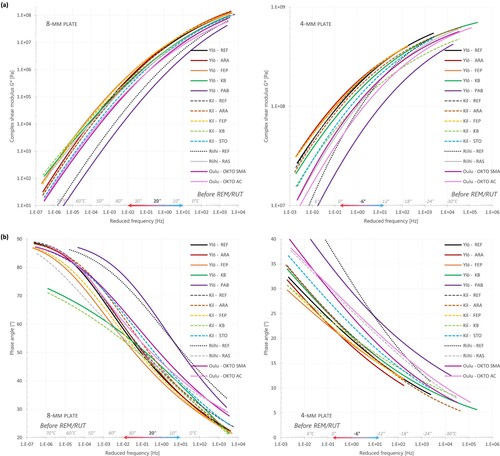
Figure 12. Master curves, (a) shear complex modulus and (b) phase angle, for all bitumens after REM/RUT. Left side: 8-mm plate (70 to 0°C). Right side: 4-mm plate (6 to −30°C). ARA bitumen does not contain fibres after extraction.
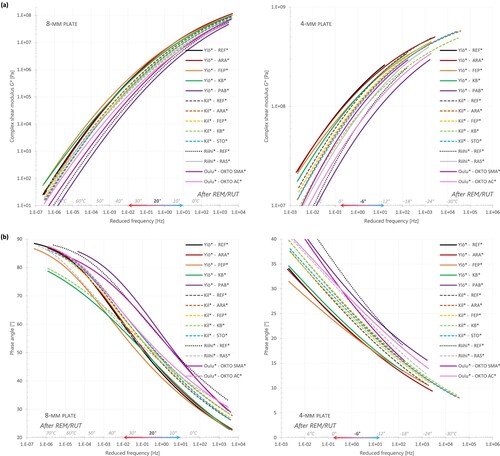
Figure 13. Change in (a) shear complex modulus and (b) phase angle, for all bitumens after REM/RUT. Left side: 8-mm plate (70 to 0°C). Right side: 4-mm plate (6 to −30°C). ARA bitumen does not contain fibres after extraction.
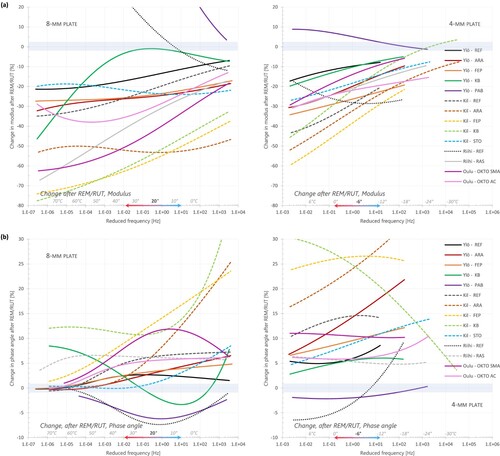
Some general observations may be extracted from the summary of master curves ( and ). For example, FEP and ARA were amongst the stiffest materials before and after REM/RUT. KB would follow, especially after REM. Also, the softening is apparent in the bitumens from Oulu (OKTO AC and OKTO SMA), which after REM behave more closely to the softest bitumen (PAB). Particularly from the change diagrams () it is clear that in general, REM/RUT tended to reduce the complex modulus and to increase the phase angle of the bitumens along the full temperature range. Only a few materials, including the two softest bitumens, deviated from this trend:
PAB and Riihi-REF were the softest materials of the group. This was confirmed by their complex modulus and phase angle diagrams, which were overall the lowest (G*) and highest (φ) among the materials at all or most temperatures. G* and φ of Rihi-REF deviated from this trend only at temperatures below 0°. These materials were likely aged during REM/RUT, which increased their modulus and reduced their phase angle (Riihi-REF only for high temperatures).
For a short range of intermediate temperatures, and only under REM, the complex modulus of KB did not change after remix (between ∼20 and 40°C) and its phase angle decreased slightly (∼0 and 20°C),
Under REM, a trend similar to the mixture-scale assessment can be observed at the bitumen level. Under REM, OKTO SMA suffered the largest reductions in modulus at high temperatures (more than 50% reduction above ∼30°C). The modulus of OKTO AC also reduced importantly at large temperatures (20–40% reduction above 0°C). At intermediate temperatures, ARA and FEP experienced a similar reduction in modulus, between 20 and 30% and about 10% more than Ylö-REF. However, at low temperatures FEP saw the largest reductions in modulus (20–35%), followed by OKTO AC, ARA, and OKTO SMA. KB seemed to reduce its modulus similarly to the reference material at low temperatures. Meanwhile, the phase angle of OKTO SMA increased the most at intermediate temperatures (12% increase at ∼10°C), followed by OKTO AC (6% increase). FEP and ARA performed similarly in this range, increasing less than 5%. At low temperatures, ARA registered the largest increases in phase angle (more than 10% increase below 0°C), followed by OKTO SMA and FEP (∼10% increase). OKTO AC and KB experienced increases below the reference material.
The materials under RUT-REM experienced more critical reductions in modulus and larger increments in phase angle than under REM. At high temperatures, the modulus of FEP and KB were the most affected (more than 60% reduction above ∼30°C), followed by ARA (∼50% reduction). RAS experienced high modulus reductions at high temperatures, but its performance improved at intermediate and low temperatures. At low temperatures, FEP again experienced the largest reductions in modulus, followed by ARA. STO performed well at high and low temperatures, with reductions between 10 and 25% overall, and KB performed well at very low temperatures where is modulus almost did not change after RUT-REM. The phase angles of KB and FEP increased the most at high and intermediate temperatures, followed by ARA and RAS. RAS presented a consistent increase of ∼5% along the full temperature range. At low temperatures, ARA increased its phase angle considerably (more than 20% at 0°C and more than 30% below −18°C), followed by FEP and KB. STO performed well at high and low temperatures, relatively close to the change of Ylö-REF.
It is useful to have two ranges of results (8 and 4 mm) spanning different temperatures and frequencies. It was possible to check the ‘compatibility’ of the results in the overlapping temperatures, that is, around 0–6°C. The change diagrams () already show that this compatibility is reasonable and quite good for all the materials from the perspective of both plate sizes. To check for this, the master curves from 8 and 4 mm were shifted to 0°C and compared on the same plane. A good agreement was obtained from both sets of data for the phase angle. For the modulus, a moderately small vertical shift appeared; that is, for the same bitumen, the modulus was larger as predicted by the 4-mm master curves. The quality of the agreement increased for the higher frequencies of the overlap, and it was best for the softer bitumens. In any case, the overall trends of both sets of data are clearly maintained and the adjustment is reasonable. These good results provide validity to the test data that were obtained from the two temperature ranges for the materials before and after REM/RUT.
Several manipulations are possible once the master curves are available. For example, as an indication of resistance to rutting it is possible to calculate the parameter G*/sin(φ). A material that maximises this parameter may better withstand rutting. Using the 8-mm master curve data (reference temperature 20°C), the modulus and phase angles of the materials were calculated at a frequency of 10 rad/s (1.59 Hz). This parameter was highest for FEP and ARA before REM/RUT, right above Ylö-REF and REF*, indicating good resistance to rutting. Most of the best-ranked materials were before REM/RUT, indicating that these processes may induce susceptibility to rutting (the opposite was indicated by mixture-scale data – see Part I). As expected, the softest bitumens before and after REM/RUT had the lower index values (PAB, Riihi-REF, OKTO SMA, OKTO AC). However, RAS* and Kil-KB* also ranked relatively low.
Regarding fatigue, an indication is provided by the parameter G*·sin(φ). A material that minimises this parameter may better withstand fatigue. Using the same data as before, the minimum values were achieved by the soft bitumens before and after REM/RUT (PAB, Riihi-REF, OKTO AC, OKTO SMA), with Kil-KB* and RAS* ranking relatively high. At the low end were FEP, ARA, and Ylö-REF before REM/RUT. Overall, in this case the materials after REM/RUT generally fared better.
Regarding low-temperature performance, a standard index used to correlate bitumen test results with field cracking is the Glover-Rowe parameter (G-R), defined as follows (Anderson et al. Citation2011, Rowe Citation2011, Mensching et al. Citation2016):
(3)
(3) where G* and φ are the complex shear modulus and the phase angle of the asphalt binder at 15°C and an angular frequency of 0.005 rad/s or ∼8 × 10⁻⁴ Hz. Using the 8-mm master curves (ref. temp. 20°C) and the appropriate WLF fits, the corresponding shift parameters (aT) were obtained to calculate the values at 15°C. shows the Glover-Rowe data plotted in a Black space (i.e. modulus vs. phase angle) for the bitumens before and after REM/RUT.
Figure 14. Complex modulus and Phase angle at Glover-Rowe conditions, all bitumens, (a) before and (b) after REM/RUT. Notice the names of the areas to the right. ARA bitumen does not contain fibres after extraction.
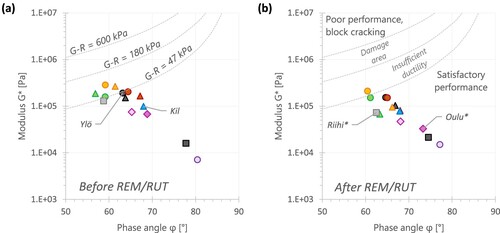
This data shows that before REM/RUT, most of the bitumens were outside the damage area, with some already in a condition that could be considered of insufficient ductility (FEP, KB) and perhaps dangerously close to potential damage. The insufficient ductility zone has been proposed as an area where the rheological properties of the bitumen may not withstand the climatic conditions characteristic of northern climates (as in Finland), i.e. cracking and studded tyres for more than 3 years (Makowska et al. Citation2017a). The REM/RUT processes were mostly successful in moving the bitumens away and outside the edge of insufficient ductility; however, Ylö-FEP* may still be at risk.
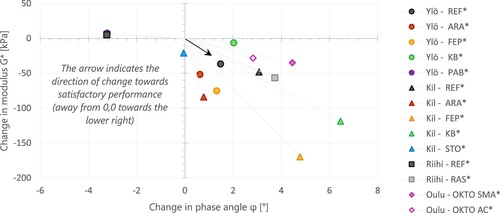
The ‘movement’ of the data points plotted in may offer an indication of the change in performance after REM/RUT. The change in modulus vs. change in phase angle is presented in ; i.e. how/if the bitumens are moving ‘away’ from the failure areas depicted in the figures. From the change we can identify the materials for which the effect of rejuvenation during REM/RUT was more evident and effective than others. In this case, the change was quite clear on Kil-FEP and Kil-KB (that is, RUT-REM), which at this temperature and frequency resulted in a reduction of more than 100 kPa in modulus and increased in phase angle above 4°. In fact, this change was enough to take both materials out of the insufficient ductility zone. In some materials, the modulus reduced but the phase angle changed little (i.e. ARA), while i.e. Ylö-KB, OKTO SMA, and OKTO AC increased in phase angle but did not reduced stiffness too much. STO was little affected in modulus and phase angle under RUT-REM. Once again, the soft bitumens Riihi-REF and PAB were out of the norm as their phase angle reduced and the modulus did not change. However, these materials remain the farthest away of the poor performance areas.
Figure 15. Change in modulus and phase angle after REM/RUT at Glover-Rowe conditions, all bitumens. ARA bitumen does not contain fibres after extraction.
Some of the indices calculated previously are point results. Considering that the master curves are available, it is advisable and more representative to compare the whole curves directly, observing the behaviours at the larger range of temperatures. For instance, additional transformations are possible regarding low temperature cracking, i.e. operating the whole master curves (G* and φ) using empirical transfer functions to estimate stiffness in the time domain (Hajj et al. Citation2019).
4.6. Multiple stress creep and recovery (MSCR)
The MSCR test was used to measure percent recovery and non-recoverable creep compliance of the bitumens of the project (SFS-EN-16659 Citation2015). The percent recovery is representative of the elastic response of the bitumen. A decrease in the percent recovery may indicate less favourability to remixing; also, low recovery values may indicate a low level of modification. At the same time, the non-recoverable creep compliance indicates susceptibility to permanent deformations at the bitumen scale, similar to what the creep/permanent deformation test measures at the mixture scale (see Part I).
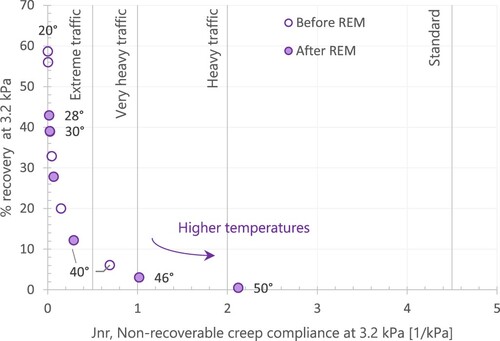
The test range covered the following temperatures for all the bitumens (except for PAB): 50, 52, 58, 60 and 70°C. Given its softness, PAB was tested under a different range of temperatures: 20, 22, 28, 30, 34, and 40°C before REM, and 28, 30, 34, 40, 46, and 50°C after REM. The MSCR test was performed using the same rheometer that was used for the DSR. The plots summarising the MSCR results are presented in for PAB and in for the other materials. PAB remained in the ‘Very heavy traffic’ category above 40°C before and after REM, and its creep compliance decreased after REM ( and ).
Figure 16. Summary of results of the MSCR test for the bitumens before and after remix/rut-remix, at five temperatures: 50, 52, 58, 60, and 70°C. ARA bitumen does not contain fibres after extraction.
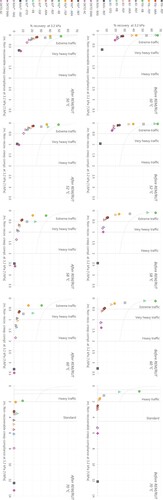
Figure 17. Summary of results of the MSCR test for PAB, before and after REM, at temperatures 20, 22, 28, 30, 34, and 40°C before REM, and 28, 30, 34, 40, 46, and 50°C after REM.
Before REM/RUT, it can be observed from the non-recoverable creep compliances that Riihi-REF was the bitumen most susceptible to permanent deformations. OKTO SMA, OKTO AC and STO follow, but their values are not as high as Riihi-REF at any temperature. After this group, ARA seems the most susceptible, followed by FEP, RAS and KB in that order. This apparent ranking was held for the temperatures 50–70°C. The change after remix/rut remix is better appreciated in the change diagram presented in .
Figure 18. Change in non-recoverable creep compliance after remix/rut remix, i.e. percent change in Jnr(3,2). ARA bitumen does not contain fibres after extraction.
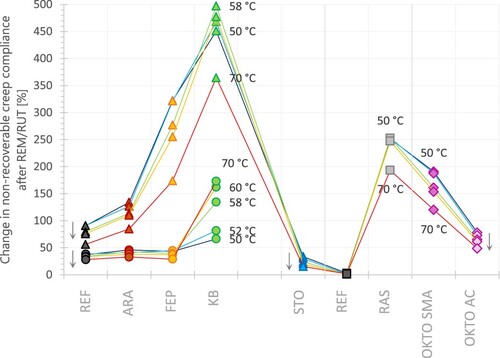
Clearly, REM/RUT is increasing the susceptibility of the bitumens to permanent deformations. The effect of RUT-REM is considerably larger. For most materials, as temperature increases, the change in creep compliance reduced. However, the trend was reverted for KB under REM, which changed the most at higher temperatures.
After REM, the non-recoverable creep compliance of OKTO SMA is greatly affected, and it quickly becomes the most susceptible bitumen to permanent deformation. This may help explain the creep results observed at the mixture scale (see Part I). OKTO AC is affected as well, but to a lower degree, and it does not seem to affect the results at the mixture scale. Meanwhile, KB is affected less at 50°C, but its change increases importantly until 70°C.
Ylö-REF, ARA and FEP are similarly affected by REM (increase between 30 and 45%). However, under RUT-REM the effect is dissimilar, and FEP sees much larger increases in non-recoverable creep compliance, while ARA is affected slightly more than Kil-REF.
STO was affected only slightly by RUT-REM. This is positive, as this material also performed well at the mixture scale.
Riihi-REF practically does not change its creep compliance during RUT-REM. However, its value is in many cases the highest of the group by a large margin, and its performance at the mixture scale was not good.
REM/RUT reduced the percent recovery of most materials significantly (except PAB and Riihi-REF). OKTO SMA and OKTO AC were the most affected by REM (30–90% reduction), and STO was the least affected by RUT-REM (20–30% reduction). Ylö-REF, ARA, and FEP were less affected by REM (10% reduction). Also, from the position of the data points in the figure (high percentage recovery vs. low non-recoverable creep), the KB bitumen still behaves as a polymer-modified bitumen after REM.
5. Concluding remarks
A summary of the most important observations at the bitumen scale is provided in . After evaluating the data at the asphalt mixture and bitumen scales, the results suggest that most of the materials used in the study may be subject to remix or rut remix. Based on mixture-scale tests (see Part I) it was possible to propose a relative ‘ranking’ of the materials, and it was established that the physical and mechanical properties of the materials were affected erratically by REM and (especially) RUT-REM, in some cases negatively, and most times also increasing variability and heterogeneity of the material. At the bitumen scale, however, most of the results span wide ranges of temperatures and frequencies and vary along these ranges (i.e. they are not point results). Overall, general comments on the performance of the bitumens of the project are as follows:
ARA kept a similar high- and low- temperature performance after REM, slightly better after RUT-REM. Before REM/RUT it had high stiffness at low temperatures; it lost stiffness after REM-RUT. The phase angle increased considerably after REM/RUT at low temperatures (softening at low temperatures). It was more susceptible than FEP to permanent deformations after REM. Recall that ARA bitumen does not contain fibres after extraction.
FEP kept a similar high- and low- temperature performance after REM. It had high stiffness before REM/RUT, and lost stiffness after REM-RUT (complex modulus reduced considerably). The phase angle increased at low temperatures after RUT-REM (softening at low temperatures). The effect of rejuvenation was considerably apparent after RUT-REM (Glover-Rowe change). It was less susceptible than ARA to permanent deformations after REM.
KB lost some low-temperature performance after REM. The effect of rejuvenation was considerably apparent after RUT-REM (Glover-Rowe change). The modulus reduced importantly after RUT-REM. However, this bitumen was amongst those with lowest susceptibility to permanent deformation (bitumen scale) before and after REM/RUT, even when the change in non-recoverable creep compliance was high after REM and the highest after RUT-REM.
RAS performed well after RUT-REM, losing some low-temperature performance. It had a low susceptibility to permanent deformation before RUT-REM, and afterwards it was on level with ARA* (REM). RAS had the most stable phase angles at high temperatures before and after RUT-REM.
STO was tested only under RUT-REM. The results were mostly consistent and positive, even when RUT-REM was found to affect the materials more than REM. It may be susceptible to permanent deformations after REM-RUT; however, it was already susceptible before RUT-REM, and the change after RUT-REM was very low. Also, the change in percent recovery was the lowest.
OKTO AC lost some low-temperature performance after REM. It was already quite soft before REM, and even more after, especially at low temperatures. It showed high susceptibility to permanent deformations.
OKTO SMA may have been overly softened during REM. It was quite soft before REM, and very susceptible to permanent deformations, especially after REM. This bitumen lost performance at high and low temperatures after REM. The modulus, phase angle and percent recovery of the bitumen at high temperatures were the most affected by REM.
Table 4. Summary of comments on performance. Bitumen scale.
PAB was tested only under REM. In many ways, PAB was managed separately from the other materials as it is comparatively very soft. Being tested separately, its ranges and characteristics were most times special and unique, which makes it challenging to place it on a relative ranking. As a very soft bitumen it usually presented the reverse trend than most of the other materials. It may be susceptible to permanent deformations after REM.
From the bitumen scale results, it was observed that the Riihi-REF material was negatively affected overall, producing an exceedingly soft bitumen (many times close to PAB) and quite susceptible to permanent deformation. This bitumen was soft to begin with, even after RUT-REM. It is important to consider that the materials in Riihimäki (Riihi-REF, RAS) already contained recycled material; the road had 50% recycled bitumen (50%). Even so, RAS performed quite well in contrast.
The present is a case study. The data and results presented correspond specifically to the materials, mix designs, and construction processes associated to the roads of the project. The data provided with the manuscript can be used for further analyses, for example to evaluate separately the differential aging induced by the recycling techniques on the materials. Additional limitations of the study and comments on future work are presented in Part I.
Acknowledgements
The present paper is a result of a project with Väylä, the Finnish Transportation Agency. We appreciate the dedicated work of laboratory technicians Heli Nikiforow and Petri Peltonen. Additionally, we want to acknowledge the company and inputs of Katri Eskola and Anne Valkonen. Open publication was possible thanks to Aalto University. Michalina Makowska was involved in this project.
Disclosure statement
No potential competing interest was reported by the authors.
Additional information
Funding
References
- Airey, G., 2002. Use of black diagrams to identify inconsistencies in rheological data. Road Materials and Pavement Design, 3, 403–424.
- Anderson, R. M., et al., 2011. Evaluation of the relationship between asphalt binder properties and non-load related cracking. Journal of the Association of Asphalt Paving Technologists, 80.
- Apilo, L., and Eskola, K, 1999. Recycled asphalt pavement studies [In Finnish, Uusiopäällystetutkimukset]. In: Insitute, R. (Ed.). Helsinki, Finland: Tiehallinto.
- Aromaa, K., 2016. The effects of ageing and rejuvenation on bitumen rheology (In Finnish). Thesis (Master). Aalto University.
- Cen/Ts-17337, 2019. Stationary source emissions – determination of mass concentration of multiple gaseous species – Fourier transform infrared spectroscopy. Helsinki: Finnish Standards Association.
- Ferreira, W. L., et al., 2021. The impact of aging heterogeneities within rap binder on recycled asphalt mixture design. Construction and Building Materials, 300, 124260.
- Finnish Transport Infrastructure Agency, 2018. Road design guide. Helsinki: Tierakenteen suunnittelu.
- Finnish Transport Infrastructure Agency, 2021. Traffic volume maps (In Finnish) [Online]. Available from: Https://Vayla.Fi/Vaylista/Aineistot/Kartat/Liikennemaarakartat.
- Forough, S. A., Nejad, F. M., and Khodaii, A, 2016. Comparing various fitting models to construct the tensile relaxation modulus master curve of asphalt mixes. International Journal of Pavement Engineering, 17, 314–330.
- Hajj, R., et al., 2019. Considerations for using the 4 Mm plate geometry in the dynamic shear rheometer for low temperature evaluation of asphalt binders. Transportation Research Record, 2673, 649–659.
- Heinonen, A., 2017. Development of the requirements for market validity of recycled asphalt – asphalt pavement containing asphalt shingles (roofing felt) as a case study (In Finnish). Thesis (M.Sc.). Aalto University.
- Liu, F., Zhou, Z., and Zhang, X, 2020. Construction of complex shear modulus and phase angle master curves for aging asphalt binders. International Journal of Pavement Engineering, 23, 1–9.
- Makowska, M., et al., 2015. Composition of abraded dust from asphalt pavement produced using ferrochromium smelter slag (Okto-aggregate). Helsinki: Aalto University.
- Makowska, M., Aromaa, K., and Pellinen, T, 2017a. The rheological transformation of bitumen during the recycling of repetitively aged asphalt pavement. Road Materials and Pavement Design, 18 (Suppl. 2), 50–65.
- Makowska, M., Hartikainen, A., and Pellinen, T, 2017b. The oxidation of bitumen witnessed in-situ by infrared spectroscopy. Materials and Structures, 50, 1–17.
- Mensching, D. J., Jacques, C. D., and Daniel, J. S, 2016. Applying the Glover-Rowe parameter to evaluate low-temperature performance of hot mix asphalt Ltpp sections. Journal of Materials In Civil Engineering (Asce), 20, 04016096.
- Pank, 2017. Asphalt standards (In Finnish). Helsinki: Finnish Asphalt Pavement Association.
- Qin, Q., et al., 2014. Field aging effect on chemistry and rheology of asphalt binders and rheological predictions for field aging. Fuel, 121, 86–94.
- Rossi, J., 2016. Suitability of modified bitumen pavements for low-traffic volume roads (In Finnish). Thesis (M.Sc.). Tampere University of Technology.
- Rowe, G, 2011. Evaluation of the relationship between asphalt binder properties and non-load related cracking. Journal of the Association of Asphalt Paving Technologists, 80, 649–662.
- Rowe, G., Baumgardner, G., and Sharrock, M. J., 2009. Functional forms for master curve analysis of bituminous materials. In: Press/Balkema, C., ed. 7th Advanced Testing and Characterization of Bituminous Materials (International Symposium). Rhodes, Greece.
- Sánchez, D. B., S. Caro, and A. E. Alvarez, 2020. Determining optimum doses of palm oil rejuvenators for recycled blends. In: C. Press, ed. Advances in materials and pavement performance prediction. San Antonio, TX: CRC Press, 339–342.
- Sfs-En-12697-2+A1, 2019. Bituminous mixtures – test methods – part 2: determination of particle size distribution. Helsinki: Finnish Standards Association.
- Sfs-En-14770, 2012. Bitumen and bituminous binders – determination of complex shear modulus and phase angle – Dynamic Shear Rheometer (DSR). Helsinki: Finnish Standards Association.
- Sfs-En-16659, 2015. Bitumen and bituminous binders – Multiple Stress Creep and Recovery Test (MSCRT). Helsinki: Finnish Standards Association.
- Suikki, L., and Spoof, H, 2018. Service Life analyses of resurfacing methods (In Finnish). In: Agency, F. T., ed. Helsinki: Finnish Transport Agency, Maintenance Department.
- Valkonen, A, 2020. Monitoring of test construction sites of asphalt additives and glass fibre grids, 2015–2019 (In Finnish). Helsinki: Finnish Transport Infrastructure Agency.
- Wang, D., et al., 2019. Artificially prepared reclaimed asphalt pavement (rap) – an experimental investigation on re-recycling. Environmental Science & Pollution Research, 26, 35620–35628.
- Yu, B., et al., 2016. Application of a high percentage of reclaimed asphalt pavement in an asphalt mixture: blending process and performance investigation. Road Materials and Pavement Design, 18, 753–765.
- Zofka, A., et al., 2015. Application of FTIR ATR method to examine the polymer content in the modified bitumen and to assess susceptibility of bitumen to ageing. Roads And Bridges – Drogi I Mosty, 14, 163–174.