
 ?Mathematical formulae have been encoded as MathML and are displayed in this HTML version using MathJax in order to improve their display. Uncheck the box to turn MathJax off. This feature requires Javascript. Click on a formula to zoom.
ABSTRACT
Electrically Conductive Asphalt (ECA) pavements are a promising technology for preventing snow and ice accumulation on roadways. This study assesses the mechanical performance of ECA pavements using Accelerated Pavement Testing (APT). Three pavement test strips were constructed in New Jersey: a traditional asphalt layer as test strip-I, an ECA mastic prepared using a combination of asphalt binder and conductive fibres (strip-II), and an ECA-HPTO (high performance thin overlay mixture) layer containing graphite and carbon fibres (strip-III). Each test strip was instrumented with asphalt strain gauges (ASGs), pressure cells, and thermocouples to evaluate the structural responses. A Heavy Vehicle Simulator (HVS) was used to apply 300,000 passes on each test strip using a 40-kN truck tire. The structural integrity of the test strips was evaluated by conducting Heavy Weight Deflectometer (HWD) testing before and after HVS loading. Data from the ASGs revealed that strip III exhibited the highest cracking resistance (nearly 2 times less tensile strain). The rut depths in all test strips were negligible (less than 2 mm). ECA mastic and steel electrodes in the ECA layer impact the structural integrity of test strips, with variations in HWD deflection behaviour indicating the role of electrode spacing in maintaining pavement stability.
Introduction
Transportation agencies face a significant challenge of snow accumulation and ice formation on roadway surfaces during extreme weather conditions. Electrically conductive Asphalt (ECA) pavements are an emerging solution for preventing snow accumulation through heating a pavement surface amidst snowfall events. In general, an ECA pavement structure is connected to an external electric power source to conduct electric current and generate thermal energy (Derwin et al. Citation2003). Conventional asphalt mixtures, which are typically electrical insulators, are transformed into ECA mixtures through incorporating conductive additives such as graphite, carbon fibres, and steel wool (Anderson and Kennedy Citation1993, Wen and Chung Citation2004, Liu et al. Citation2008, Wu et al. Citation2008). Previous studies focused on optimising the design parameters of ECA mixtures (e.g. type and content of conductive additives, asphalt content, gradation, etc.) to maximise heating performance. Several laboratory and full-scale performance testing studies were also conducted to assess the resistance of ECA mixtures to pavement distresses such as rutting and cracking (Huang et al. Citation2009, Wu et al. Citation2010, Liu and Wu Citation2011, Wang et al. Citation2016, Pan et al. Citation2017, Hasan et al. Citation2021).
One such study conducted by Huang et al. (Citation2009) which utilised the asphalt pavement analyzer (APA) and flow number (FN) tests to assess the impact of varying conductive additives on the rutting susceptibility of ECA mixtures. The authors reported that the addition of graphite showed a significant improvement in the resistance of ECA mixtures to rutting, followed by carbon and steel fibres. This agreed with the findings of another study by Hasan et al. (Citation2021), where the authors recommended the use of graphite at 30% by volume of binder to ensure a rut depth less than 4 mm. According to Wang et al. (Citation2016), while incorporating graphite into ECA mixtures enhanced their ability to resist permanent deformation, this conductive additive presented a negative impact on low-temperature cracking performance of the ECA mixtures. In a similar study, Liu and Wu (Citation2011) found that increasing graphite contents in ECA mixtures can lead to a reduced Marshall stability. When introducing carbon fibres at 2% by asphalt volume to these mixtures, the Marshall stability values increased considerably. Liu and Wu (Citation2011) recommended using both graphite and carbon fibres to ensure a maximum ECA cracking resistance. Wu et al. (Citation2010) conducted indirect tensile (IDT) tests on ECA mixtures prepared using different types and contents of conductive additives to evaluate the impact on ECA cracking resistance. The authors reported that the combination of graphite and carbon fibres at 18% and 2% by volume of asphalt, respectively, resulted in the highest improvement in ECA strength (Wu et al. Citation2010). Overall, the results of these studies demonstrated that the use of conductive additives has a significant impact on the mechanical performance of asphalt mixtures. Combining multiple additives such as carbon fibres and graphite can be an effective approach for improving the mechanical performance of ECA mixtures while maintaining a high electrical conductivity (Liu and Wu Citation2011, Wang et al. Citation2016, Pan et al. Citation2017, Marath et al. Citation2023b).
Unlike the controlled laboratory testing conditions, additional factors can affect the performance of ECA mixtures in the field. These include: ambient temperature, solar radiation, precipitation, and traffic loading. Over the past few decades, few studies focused on evaluating the field performance of ECA mixtures with more focus on their heating performance at low ambient temperatures (Minsk Citation1971, Derwin et al. Citation2003). Minsk (Citation1971) was the first author to study the performance of an ECA full-scale pavement strip in 1971 for two consecutive winter seasons. The author used an ECA mixture prepared with graphite at 25% ensuring an electrical resistivity of 0.025 ohm-m to construct a 12.7-mm thick ECA layer. Additionally, 1.5-m spaced steel electrodes were placed at the bottom of the ECA layer to provide an electrical potential difference of 30 V. Minsk (Citation1971) found that the electrical resistivity of the ECA layer increased by up to 83% eighteen months after construction. Since the strip was not open to traffic and no full-scale testing was conducted, no information about the mechanical performance of the ECA pavement was provided by Minsk. In a later study, Derwin et al. (Citation2003) designed an ECA mixture with 25% graphite meeting the requirements of the Federal Aviation Administration (FAA) P401 mixture, which was used to construct a pavement strip at O’hare international airport in Chicago. At the bottom of the ECA layer, 4.8-m spaced copper cables were installed to provide an electrical potential difference of 120 V. The authors reported that the ECA pavement strip showed an up-heat rate ranging between 3°C and 5°C per hour. With regards to mechanical performance, no permanent deformation was observed at the surface of the ECA pavement strip after 200,000 departing aircraft movements. Derwin et al. (Citation2003) also found that the density of cracks emerged at the surface of the ECA pavement strip was similar to that experienced by traditional asphalt pavements. Recently, Marath et al. (Citation2023a) constructed ECA test strips and evaluated the heating and de-icing performance under weather conditions in New Jersey. It was reported that the ECA test strips developed a power output of 128 W/m2, and were able to melt a snow-layer of 3 inch thickness by heating for 8–9 hours (Marath et al. Citation2023a). Considering the additional material cost due to conductive additives, electrical components, and steel electrodes, and operating cost of such pavements, these specialised pavements are particularly recommended for applications in critical infrastructure such as airstrips, bridges, and parking areas.
Numerous full-scale studies were also conducted to evaluate the mechanical performance of traditional asphalt mixtures in the field (Harvey et al. Citation2001, Wu et al. Citation2015, Blanc et al. Citation2019, Saidi et al. Citation2022, Habibpour et al. Citation2023). Accelerated Pavement Testing (APT) using Heavy Vehicle Simulator (HVS) is a widely adopted methodology to simulate the real traffic loads on asphalt test strips. Mechanistic responses to HVS loading from the strain gauges (horizontal and transverse strain) and pressure cells embedded in the pavement layers were typically used to assess the cracking performance of the asphalt test sections (Blanc et al. Citation2019, Saidi et al. Citation2022, Habibpour et al. Citation2023). The permanent deformation on the pavement surface was typically measured using a laser profilometer at different stages of HVS loading (Harvey et al. Citation2001, Saidi et al. Citation2022). Several studies had adopted Heavy Weight Deflectometer test to assess the structural integrity of the test sections before and after the HVS loading (Saidi et al. Citation2022, Habibpour et al. Citation2023). The HWD test was conducted over the HVS wheel path (loaded area) to capture the impact of loading. While the HVS testing method is generally well-regarded for evaluating the full-scale performance of asphalt pavement structures, it is worth noting that no studies have been undertaken so far to assess the performance of ECA pavement structures using this approach.
In summary, extensive research was conducted on ECA mixtures to optimise their design parameters including the type and contents of conductive additives (Wen and Chung Citation2004, Huang et al. Citation2009, Hasan et al. Citation2021, Marath et al. Citation2023b). The goal was to maximise the heating performance of ECA mixtures at low ambient temperatures. While most studies considered the mechanical performance during the design process of ECA mixtures, literature had limited information about the field performance of these mixtures with regards to their resistance to load – and temperature-induced distresses. Rutting (permanent deformation), cracking performance, and structural integrity of electrically conductive asphalt pavements could be unique from conventional asphalt pavements mainly due to two reasons: (a) the presence of ECA mixtures, and (b) conductive steel electrode framework within the pavement structure. Thus, to bridge this gap, this paper adopts multiple full-scale testing techniques; including Accelerated Pavement Testing (APT) and Heavy weight deflectometer (HWD), which were proven successful in evaluating both mechanical performance and structural integrity of different types of pavements (Blanc et al. Citation2019, Saidi et al. Citation2022, Habibpour et al. Citation2023). In addition, research is needed to determine the impact of traffic loading on the heating performance of ECA pavements since load-induced damage could potentially reduce the electrical conductivity of the ECA mixture.
Paper objectives
The main goal of this paper was to assess the field performance of ECA pavements under full-scale accelerated loading. To achieve this goal, the following objectives were set:
Apply accelerated loading on three test strips using a Heavy Vehicle Simulator (HVS) to simulate truck traffic..
Assess the structural integrity of each test strip using HWD before and after HVS loading.
Evaluate the permanent deformation at the surface of each test strip using a laser profilometer.
Analyse the mechanistic responses recorded by embedded sensors at the bottom of the ECA layer.
Determine the impact of HVS loading on ECA heating performance.
Description of constructed test strips
Description of asphalt mixtures
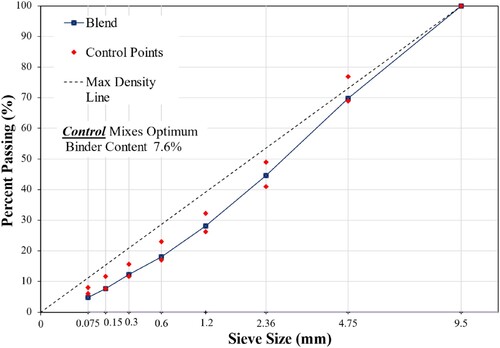
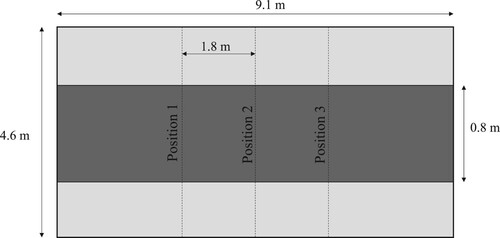
In this study, three pavement test strips were built at the Rowan University Accelerated Pavement Testing Facility (RUAPTF) in New Jersey. Each test strip was 9.1 m long and 4.6 m wide as shown in . Three types of asphalt mixtures were used: one non-conductive High Performance Thin Overlay (HPTO) mixture in test strip I and two ECA mixtures in test strips II and III. The first ECA mixture (test strip II) was a mastic (0% aggregates) prepared using a combination of rubberized-asphalt binder and carbon fibres (ECA mastic). Carbon fibres served as the only conductive additive in this ECA mastic of test strip II. The second ECA mixture (test strip III) was a modified HPTO mix (ECA-HPTO). As recommended in a previous phase of this study (7), two types of conductive additives were used in this ECA mixture: graphite at 30% and carbon fibres (6.35 mm long, and 7.2 microns diameter) at 1%, by volume of asphalt. A PG 64E-22 asphalt binder was used at an optimum content of: (a) 7.6% for the non-conductive HPTO mixture (test strip I), and (b) 8.1% for the ECA-HPTO mixture (test strip III). presents the gradation chart of the non-conductive HPTO mixture. As shown in the figure, the nominal maximum aggregate size for the HPTO mixture was 4.75 mm. The optimum binder content was designed for a target air void of 3.5 ± 0.5% for both mixtures.
Figure 1. Layout of the full-scale test strips.
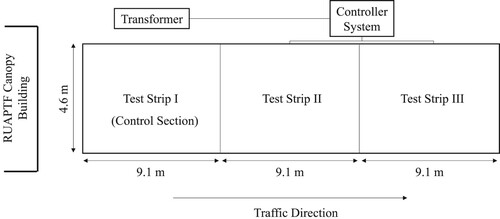
Figure 2. Gradation chart of HPTO mixture.
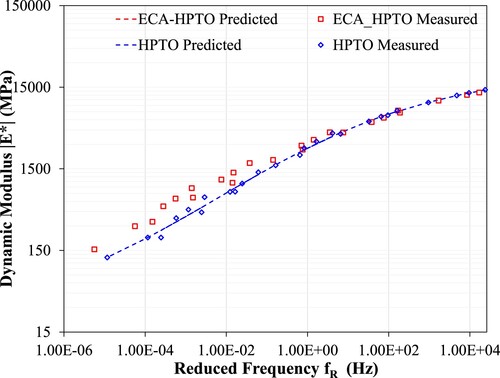
The dynamic modulus test was then conducted on plant-produced ECA-HPTO and HPTO mixtures in accordance with AASHTO T378. Each mixture was compacted using a Superpave gyratory compactor using height mode and targeting 7% air void level, then tested at five temperatures (4°C, 19°C, 31°C, 46°C, and 58°C) and five frequencies (0.1, 1, 5, 10, and 25 Hz). illustrates the master curve of both ECA-HPTO and HPTO mixtures at a reference temperature of 25°C. A sigmoidal fitting function was used to generate the master curve from the measured dynamic modulus values (0.9% – 1% fitting error). As can be seen from , the ECA-HPTO mix exhibited a higher modulus (up to 25%) compared to the HPTO mix at lower reduced frequencies. This suggests that the ECA-HPTO mixture could be more resistant to permanent deformation at higher temperature and/or lower loading frequencies.
Figure 3. Dynamic modulus master curve (reference temperature: 25°C).
Construction of test strips
presents a cross-section view of the three full-scale test strips constructed as part of this study. The construction was initiated by milling 25.4 mm of an existing rigid pavement located at RUAPTF. The milled pavement consisted originally of (from top to bottom): a 203 mm thick Portland Cement Concrete (PCC) slabs, a 406 mm thick aggregate base layer, and a 304 mm thick compacted soil layer. To enhance bonding between the remaining 177.6 mm thick PCC and the produced asphalt mixtures, a tack coat layer of polymer-modified emulsified asphalt (CRS-1P) was applied over the milled surface using a sprayer truck.
Figure 4. Cross-section details of the three test strips.
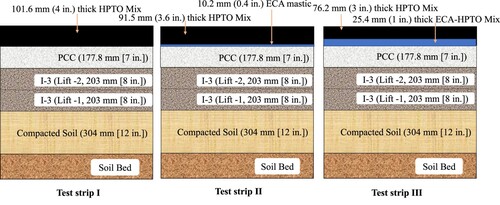
Mild steel electrodes were then installed in both longitudinal and transverse directions over the tack-coated PCC layer of ECA test strips II and III. The longitudinal electrodes were 63.5-mm wide, 12.7-mm thick, and 9.1-m long., while the transverse electrodes were 25.4-mm wide, 3.2-mm thick, and 3.66-m long. The spacing between the transverse electrodes was 0.3 m for test strip II, while two different electrode spacings were used in test strip III: 0.3 m for one half of the strip (Test strip III_12) and 0.15 m (Test Strip III_6) for the other half. The network of electrodes was established by welding multiple individual steel electrodes on-site, which was later connected to a power supply. illustrates the installation process of longitudinal and transverse steel electrodes.
Figure 5. Installation of steel electrodes in ECA test strips II and III.
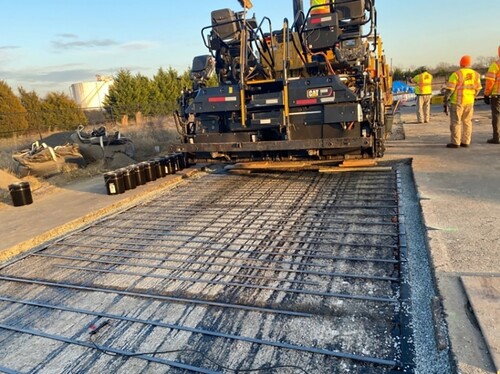
Once the networks of steel electrodes were established in test strips II and III, ECA mixtures were placed over these networks to the design thicknesses of 10.2 and 25.4 mm, respectively. For test strip II, a portable mastic melting device was utilised to maintain the ECA mastic temperature at 120°C to ensure their workability. The ECA mastic mixture of test strip II contained only asphalt binder and conductive fibres (no aggregates were used). Therefore, this mixture was placed manually using metal rakes and shovels. Uniformly-graded fine aggregates were then spread over it similarly to chip seals. Subsequently, the layer of non-conductive HPTO mixture was placed using conventional asphalt paving machinery and compactors. For test strip III, both ECA-HPTO mixture and non-conductive HPTO mixtures were placed using conventional asphalt paving machinery and compactors. For safety purposes, a 25.4 mm thick non-conductive HPTO mix was laid over the ECA layers of test strips II and III. Similarly, a 101.6-mm thick non-conductive HPTO mix was placed over the tack-coated PCC layer in test strip I. During the compaction process, no displacement of steel electrodes was observed. For proper conduction of electricity through the ECA layer, it is critical to ensure that the transverse steel is maintained in place.
Full-Scale testing program
A full-scale testing programme was employed to evaluate the mechanical performance of ECA pavements at a controlled test temperature and loading conditions. Each test strip was subjected to accelerated loading using an HVS with a dual-truck-tire configuration. The mechanical performance considered in this study included: structural integrity, rutting susceptibility, and cracking resistance. Additionally, the heating performance was assessed for the ECA test strips II and III before and after HVS loading.
APT loading program
The APT programme consisted of applying repeated loading on each test strip using an HVS until meeting one of two failure criteria were met: (1) a rut depth of 25 mm or (2) crack density of 2.5 m/m2 over 50% of the loaded area (Pidwerbesky Citation1995, Romanoschi et al. Citation1999, Bejarano and Harvey Citation2002, Louw et al. Citation2020). Additional details about the loading programme are provided below:
Bidirectional loading mode and a wheel wander of 400 mm to both sides from the centre of the pavement strip.
A dual-tire wheel configuration with 40-kN loading magnitude and 793-kPa tire pressure.
The HVS frame was tightly covered with thermal insulator boards to maintain the inside air temperature at 10°C around a particular test strip and throughout the testing period.
Accelerated loading for 300,000 passes (0.3-million Equivalent Single Axle Load). A low number of HVS pass was chosen not to fail the pavement strips completely, where the electrical conductivity of the test strips will be lost completely.
Visual inspection
After the HVS loading, a visual inspection of the test strips was conducted to investigate the presence of load-induced cracks (specifically reflective cracking that can appear due to the presence of steel electrodes).
Mechanistic responses measurements
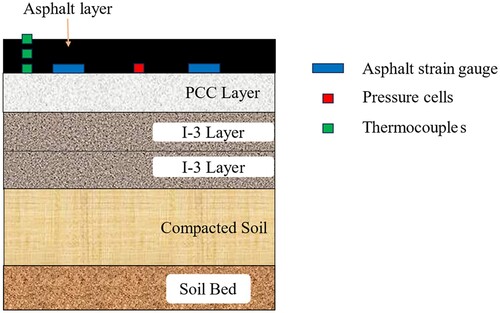
During construction, Asphalt Strain Gauges (ASGs) and pressure cells were installed at the bottom of both ECA (strip II and strip III) and non-conductive HPTO (strip I) layers to record their mechanistic responses during HVS loading. It should be noted that the ASGs (longitudinal) were positioned between transverse steel electrodes. Consequently, in strip III, the ASGs were placed within the section that had a 0.3 m spacing, as the narrower 0.15 m spacing could not accommodate the ASG. Thermocouples were also placed at different depths within the asphalt layers to monitor their temperature as loading progressed. illustrates a cross-section of a test strip showing the locations of the sensors within each test strip. The data from these sensors were recorded at a frequency of 1,600 data points per second every 10 loading passes.
Figure 6. Cross-section view of test strips.
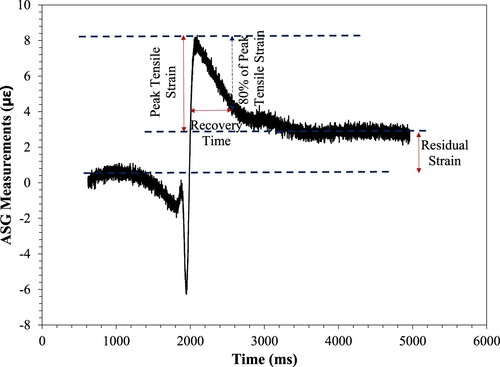
presents a typical ASG response after one HVS pass, which comprises three main areas: (1) compressive strain area, (2) tensile strain area, and (3) residual or permanent strain area. In this study, the residual strain is considered as a damage level as it may impact the electrical conductivity of the conductive pavement strips. As illustrated in , a peak tensile strain can be determined for each HVS pass as the difference between maximum tensile strain and residual strain. The tensile strain at the bottom of the asphalt layer is considered as an indicator of fatigue cracking in asphalt pavements (Thompson and Carpenter Citation2006). Additionally, tensile strain under HVS loading is a direct indication of modulus of asphalt layer. However, residual strain can be considered as an existing permanent strain which does not reflect the modulus of the asphalt layer as the HVS loading progresses. Thus, by deducting the residual strain from the total tensile strain, the peak tensile strain could represent the stiffness of the asphalt layer. Equation (1) was used to determine the peak tensile strain by deducting the mean of last 100 acquisition points from the maximum strain recorded from each HVS pass. Additionally, the recovery time can be defined as the time required to drop 80% of the maximum tensile strain. The recovery time indicates the elastic behaviour of the asphalt layer. Equation (2) was used to estimate recovery time for each HVS pass. Thus, in this study, peak tensile strain was used to analyse the fatigue cracking resistance, and residual strain and recovery time was used to analyse the creep and elastic behaviour of both non-conductive HPTO and ECA layers. A lower peak tensile strain and recovery indicates a higher stiff and elastic material, thereby a better fatigue cracking resistance.
(1)
(1)
(2)
(2) where,
;
;
Figure 7. Typical ASG reading obtained for one HVS pass.
Structural integrity using HWD testing
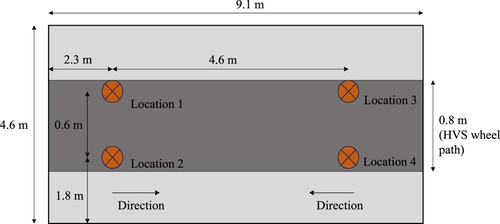
The structural integrity of each test strip was assessed by conducting an HWD test at four locations per test strip before and after 300,000 HVS passes (). All the four locations were selected such that they lied within the HVS wheel path. The HWD measures the deflection of the pavement test strip when subjected to an impact load. The measured deflection data can further be used to back-calculate the moduli of each pavement layer, thereby, the structural integrity of the pavement structure. The deflection data and back-calculated moduli were analysed to determine the impact of (1) accelerated truck loading and (2) the presence of electrodes within the ECA layers on the structural integrity of the different test strips.
Figure 8. HWD test locations and directions.
Quantification of rut depth using a laser profilometer
As HVS loading progressed, transverse profiles were determined at three positions of each test strip. A laser profilometer was used to measure the surface profile of each test strip across the HVS wheel path (transverse direction). The surface profile measurements were taken at three phases: (1) before HVS loading, (2) after 150,000 HVS passes, and (3) after 300,000 HVS passes. presents the three positions at which the profile measurements were taken. In this study, rut depth is defined as the maximum dip from the initial surface profile (i.e. at 0 HVS loading passes) to the final one (e.g. after 300,000 HVS loading passes).
Figure 9. Schematic diagram of a test strip with profilometer test positions.
Heating ability before and after HVS loading
The electrical conductivity of the ECA layer in the test strips may experience a reduction due to the development of cracks, whether macro or micro, caused by repeated traffic loading. This, in turn, can diminish the heating capability of the ECA layer either partially or entirely. It becomes crucial to assess the impact of traffic loading on the electrical power generation and heating performance of each ECA test strip. To assess this, a comparative analysis was conducted by comparing the power generated before and after applying HVS loading to both conductive test strips. It is noteworthy that a 24 V alternating current (AC) power supply was employed to ensure the safety of ECA test strips II and III during the experimentation process.
Results and discussions
Visual inspection
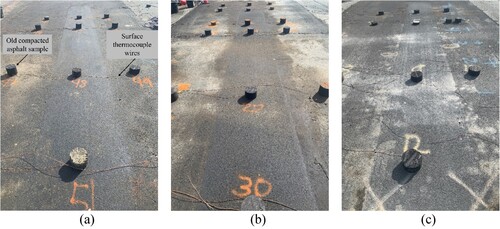
presents images taken for the surface of three test strips after the application of 300,000 HVS passes. As shown in , no visible cracks were identified along the wheel path of any of the test strips. This indicates that both ECA and traditional test strips withstood a traffic loading of 300,000 ESALs, without showing cracking distress. This also suggests that the presence of steel electrodes at a depth of 102 mm did not affect the resistance of ECA test strips to reflective cracking. Surface thermocouples (as shown in ) were held in place using old compacted asphalt samples to ensure proper contact with the pavement surface throughout the testing period.
Figure 10. Images of test strips after HVS loading: (a) Test strip I, (b) Test strip II, (c) Test strip III.
Rutting performance
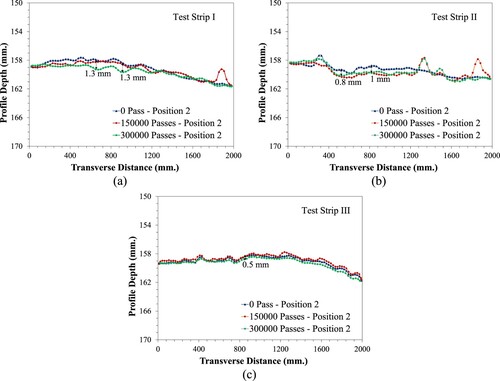
shows the transverse profiles of the different test strips at 0, 150,000, and 300,000 loading passes. From (a–c), the rut depth values for test strips I and II were maintained relatively constant (less than 2 mm) for the entire HVS loading (300,000 passes). For test strip III, the rut depth values did not exceed 0.5 mm after 300,000 loading passes. These results were expected as HVS loading was conducted at 10°C. Overall, these observations may indicate that both ECA and non-conductive asphalt mixtures have a strong resistance to permanent deformation at low ambient temperatures and under truck traffic.
Figure 11. Profilometer readings after different HVS passes: (a) Test strip I, (b) Test strip II, (c) Test strip III.
Mechanistic responses recorded from embedded sensors
The ASG data collected from the three test strips were used to determine the tensile strain, residual strain, and recovery time for each HVS pass to assess load-induced damage at both conductive and non-conductive asphalt layers. Results are presented in the following subsections.
Assessment of tensile strain and fatigue resistance
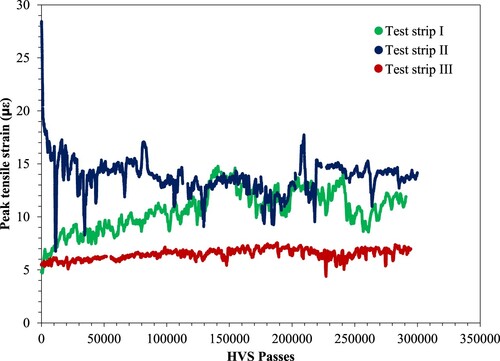
illustrates the progression of tensile strain recorded at the bottom of the asphalt layer of the three test strips under repeated HVS passes. In test strip I, the tensile strain increased from 5 micro-strains to nearly 14 micro-strains after 300,000 HVS passes. Conversely, test strip II exhibited a decrease in tensile strain, dropping from 28 micro-strains to become constant around 14 micro-strains during the initial passes. This decrease is likely due to the presence of ECA mastic at the bottom of the HPTO layer in test strip II. Although both test strips I and II stabilised around 14 micro-strains, test strip III consistently showed lower tensile strains, ranging between 5–7 micro-strains throughout the HVS passes. This reduced tensile strain in test strip III can be attributed to the higher modulus of the ECA-HPTO mixture (8,650 Mpa, estimated from the master curve, corresponding to HVS test temperature, and loading frequency) compared to that of the HPTO mixture used in strip I and II (8,380 Mpa). Furthermore, apart from the mixture's high modulus, the presence of transverse steel bars could also have contributed to the lower tensile strain observed in test strip III. Overall, due to its lower tensile strains, test strip III could slightly outperform the other strips in terms of resistance to fatigue cracking.
Figure 12. Tensile strain at the bottom of asphalt layer.
Creep and elastic behaviour of asphalt layers
(a) displays the variation of residual strain with the increase of the number of HVS passes for each test strip. As can be seen in (a), all test strips exhibited a steep increase in residual strain (0.46% slope for test strip I, 0.60% slope for test strip II, and 0.34% slope for test strip III) during the initial 10,000 HVS passes. Beyond 10,000 passes, the residual strain values of the test strip II started to fluctuate between 80 and 120 micro-strains. In contrast, test strip I continued to accumulate residual strain until reaching 300,000 HVS passes. While for test strip III, the residual strain showed a plateau trend within 50 micro-strains (± 10 micro-strains). Additionally, test strip II showed the highest residual strain at 300,000 HVS passes (118 micro-strains), followed by test strips I (94 micro-strains) and III (28 micro-strains). These observations suggest that test strip III could be the best at resisting creeping under truck traffic. The presence of steel electrodes below the ECA-HPTO layer in test strip III may have improved the strength of this layer and increased its creep resistance. This could also be due to the confining of asphalt by electrodes under accelerated HVS loading. Conversely, the high values of residual strain in test strip II could be due to the poor mechanical properties of the ECA mastic (0% aggregates) with the uniformly graded aggregate particles that were placed before the placement of non-conductive HPTO capping layer. This may also result in a reduced electrical conductivity compared to that of test strip III.
Figure 13. Sensor data analysis (a) Residual strain in test strips, (b) Peak strain and Recovery time in test strip I, (c) Peak strain and Recovery time in test strip II, (d) Peak strain and Recovery time in test strip III.
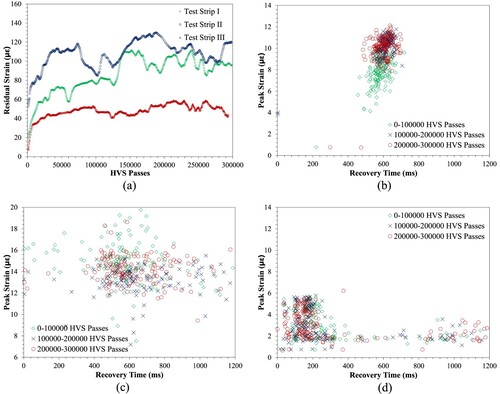
(b–d) presents the correlation between peak strain values and recovery time for all three test strips. As can be seen in (b), as the peak strain values increased from 6 to 12 micro-strains during HVS testing in test strip I, the recovery time extended from 450 to 700 milliseconds. This suggests that the non-conductive asphalt mixture in test strip I may have become less stiff and elastic under truck traffic loading. Conversely, test strip II exhibited a broader range of recovery time (350 milliseconds to 1,100 milliseconds). For test strip III, peak strain values fluctuated between 2 and 6 micro-strains during HVS loading (d). Additionally, test strip III exhibited the shortest recovery time (50–250 milliseconds) of the three test strips. This may indicate that the ECA-HPTO layer of test strip III has better elastic properties than those of the ECA mastic and HPTO mix used in test strip II and I, respectively. In fact, the presence of steel electrodes in the ECA test strips II and III may have enhanced the elastic properties for the asphalt layer, ensuring a better structural integrity under truck traffic loading.
Structural integrity
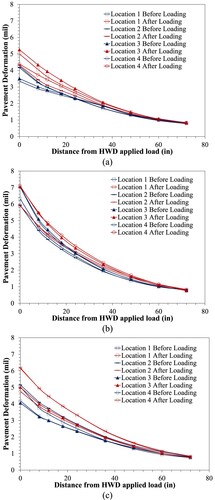
(a–c) illustrate the HWD deflection curves for the three test strips before and after HVS loading. These deflections were normalised to 40-kN and to a test temperature of 20°C (for maximum deflections) before and after HVS loading. As can be seen from these figures, test strip II showed higher maximum deflection (d0 ranging between 6–7 mils) than test strips I and III (d0 ranging from 4 to 5 mils) before HVS loading. This could be due to the presence of the thin ECA mastic layer (10.2-mm thick) in test strip II. To evaluate the impact of HVS loading on the structural integrity of the different test strips, the percent change in maximum deflection was determined after 300,000 HVS loading passes. Results showed that test strip I had the highest increase in maximum deflection (up to 28%) after HVS loading, which indicates a reduction in the structural integrity of the upper layers. For test strip II, no change in maximum deflection was observed after HVS loading (up to 3.5% reduction). In the case of test strip III, an increase in maximum deflection by up to 21% after HVS loading was observed, which may indicate a reduction in the strength of the ECA-HPTO layer. This could also be due to the debonding of the ECA-HPTO layer caused by the presence of steel electrodes at the bottom of this layer. With regards to the lower layers of the three test strips, the HWD deflections recorded by the geophones spaced beyond 915 mm from the load plate were relatively similar before and after HVS loading (within 0.5 mils). This was expected as the materials of the base and subgrade layers of the different test strips were similar. This observation suggests that the application of accelerated truck loading did not impact the structural integrity of these layers. However, by comparing the deflection data from the three test strips, it can be seen that the test strip II showed the highest deflection (6–7 mils) than the other two test strips, irrespective of the HVS loading. This indicates that the test strip II had the weakest structural integrity among the three test strips.
Figure 14. HWD deflections for test strips – Before and after HVS load: (a) Test strip I, (b) Test strip II, (c) Test strip III.
In addition to the recorded deflection data, the moduli of the different pavement layers were back-calculated using BAKFAA (the Federal Aviation Administration’s back-calculation software). Each layer was assigned a seed moduli value as follows: 10,000 MPa for the 101.6-mm thick HPTO layer, 25,500 MPa for the 177.8-mm thick PCC layer, 300 MPa for the 406.4-mm thick aggregate base layer, 140 MPa for the 304.8-mm thick subgrade layer, and 200 MPa for natural soil (semi-infinite). The seed moduli were selected based on typical values of the material used. The first step of analysis consisted of determining the moduli of the compacted natural soil, I-3 base layer, and PCC layer using the deflection data from test strip I as it had the simplest layered system (no steel electrodes). The modulus of the HPTO layer was determined from the master curve corresponding to the test temperature and loading duration of HWD. The loading duration for the HWD was 30 milli seconds, which was converted to frequency by taking the reciprocal. The estimated modulus from the master curve was fixed during the back-calculation process to estimate the moduli of the remaining layers. For subsequent back-calculations, the moduli of the unbound and PCC layers were then fixed to better capture the impact of accelerated truck loading on the moduli of both HPTO and ECA-HPTO layers. Additionally, the modulus of the subgrade was back-calculated to account for seasonal variations since the HWD test was conducted at different times of the year.
presents the estimated layer moduli for the different test strips. Before the application of HVS loading, the back-calculated moduli for the PCC, I-3, and subgrade layers were 12,532, 468, and 232 MPa, respectively. The back-calculated moduli of the asphalt layers (HPTO and ECA-HPTO) varied among test strips, with test strip I (HPTO) presenting the highest modulus (4,832 MPa). In contrast, test strip II presented the lowest modulus (640 MPa) highlighting the impact of the thin ECA mastic layer present in test strip II.
Table 1. Back-calculated layer moduli – before and after HVS loading.
In test strip III, although the ECA-HPTO layer was expected to have a higher modulus than test strip I based on the dynamic modulus master curve, the back-calculated moduli (1,401 [ECA-HPTO in test strip III-12 in.] and 3,636 MPa [ECA-HPTO in test strip III-6 in.]) were lower than that of test strip I. This suggests that the presence of steel electrodes may have resulted in reduced back-calculated moduli. Additionally, reducing the steel electrode spacing from 0.3 m (12-inch) to 0.15 m (6-inch) resulted in a 2–2.5 times increase in back-calculated moduli, thus, stiffening the ECA-HPTO layer.
After the application of 300,000 HVS loading passes, the moduli of the asphalt layers (HPTO and ECA-HPTO) decreased by (a) 35% for test strip I, (b) 23% for test strip III with 0.3 m (12-inch) electrode spacing, and (c) 38% for test strip III with 0.15 m (6-inch) electrode spacing. Conversely, a slight increase in modulus (by 7.5%) was observed for test strip II after HVS loading. Overall, before and after HVS loading, the back-calculated moduli suggests that test strip I (traditional pavement strip) had the highest structural integrity compared to test strips II and III (ECA test strips). The presence of steel electrodes within the conductive asphalt layer could be the reason for the reduction in stiffness in test strip III, while in test strip II, it could be due to the combined presence of steel electrodes and the ECA mastic layer.
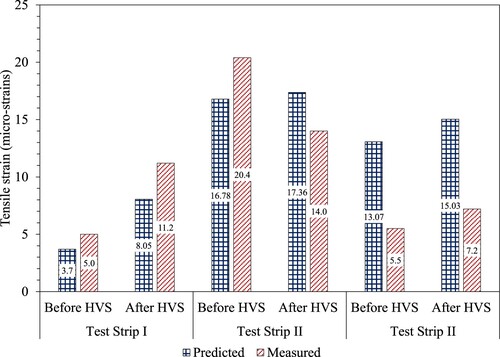
The back-calculated moduli were then utilised in a linear elastic analysis software (KENPAVE) to predict tensile strain at the bottom of asphalt layers as well as to compare them with the measured tensile strains under HVS loading (). illustrates the predicted and measured tensile strains for each test strip, both before and after HVS loading. In test strip I, the predicted tensile strains are lower (up to 28%) than the measured tensile strains. This was expected since the load duration of HVS (400–500 micro-seconds) was significantly higher than that of an HWD (30 micro-seconds), resulting in a lower asphalt modulus under HVS load, consequently leading to a higher tensile strain. However, for test strips II and III, the predicted strain values were higher than those measured by the ASGs at the bottom of the asphalt layers. This suggests that the back-calculation process tends to underpredict the moduli of ECA layers. One possible reason for this discrepancy could be a lateral confining effect occurring at the bottom of the asphalt layer due to the presence of steel electrodes, limiting the measured tensile strain to a lower value than the predicted values. Further research is needed to validate this hypothesis.
Figure 15. Comparison of tensile strains at the bottom of asphalt layer.
Impact of HVS loading on heating performance of ECA test strips
displays the electrical power generation per square foot area for ECA test strips II and III before and after HVS loading. The power generation was determined for two zones in test strip III containing steel electrodes with a spacing of 0.15 m (Test strip III_6) and 0.30 m (Test strip III_12).
Figure 16. Electrical power generated by conductive test strips – before and after HVS loading.
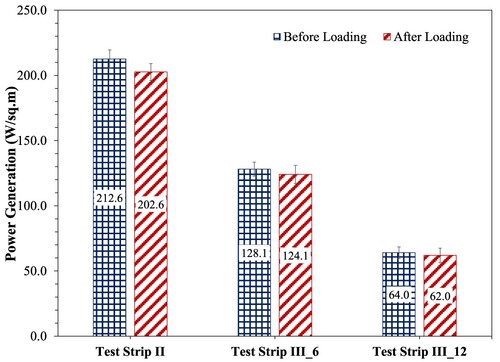
From , test strip II presented the highest electrical power generation compared to test strip III, both before and after HVS loading. In addition, the power generation was reduced by 4.7% in test strip II and 3.1% in both zones of test strip III after the HVS loading. This suggests that the ECA-HPTO mixture (test strip III) can maintain slightly better electrical conductivity under traffic load compared to ECA mastic (test strip II). The reduction in power generation could be due to the damage developed in the ECA layer under HVS loading, which is indicated by the residual strain (a).
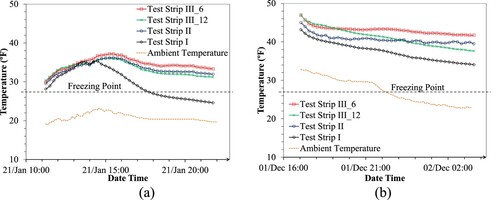
presents the surface temperature of the three test strips along with the ambient temperature recorded during a heating event before and after HVS loading. It is seen from the figure that both the ECA test strips (II and III) were able to maintain a higher surface temperature (up to 9°F) than the test strip I. As the ambient temperature was not similar in both heating period (before and after HVS), a direct comparison of temperature was not possible. However, the ranking of test strips based on ability to heat up the pavement surface remained the same even after HVS loading (i.e. test strip III_6 > test strip II > test strip III_12). This shows that, even though the impact of HVS loading resulted in a minor reduction in power generation of ECA test strips, this was not significantly reflected in the pavement surface temperature during heating.
Figure 17. Surface temperature profile during heating (a) Before HVS loading, (b) After HVS loading.
Summary and conclusions
The goal of this study was to evaluate the mechanical performance of ECA pavements subjected to truck traffic. Three full-scale test strips were constructed at Rowan University Accelerated Pavement Test Facility (RUAPTF). Three types of asphalt mixtures were used: a non-conductive High Performance Thin Overlay (HPTO) mixture in test strip I, an asphalt mix containing 10.2-mm thick ECA mastic in test strip II, and a 25.4-mm thick ECA-HPTO mixture in test strip III. A Heavy Vehicle Simulator (HVS) was then used to apply on each test strip an accelerated truck loading for 300,000 passes (0.3 million ESALs). Strain gauge readings, profilometer readings, and Heavy Weight Deflectometer (HWD) testing were used to evaluate the mechanical performance of each test strip as loading progressed or after completion. Additionally, the impact of accelerated truck loading on ECA heating performance was determined using the electrical power generation before and after HVS loading. The following conclusions were drawn based on the full-scale testing results and subsequent analysis:
Visual Inspection
o After the application of HVS loading, no visible cracks were identified along the wheel path of any of the test strips. This may indicate that both ECA and traditional HPTO asphalt mixtures have a similar cracking performance under truck traffic.
Permanent Deformation
o All the test strips exhibited rut depth values less than 2 mm after the application of HVS loading. This implies that both ECA and non-conductive asphalt mixtures have a strong resistance to permanent deformation at low ambient temperatures and under truck traffic.
Mechanistic responses from pavement test strips:
o Test strip III (ECA-HPTO) exhibited a relatively lower tensile strains throughout accelerated HVS loading compared to test strips I and II. This suggests that ECA-HPTO layer could be better at resisting fatigue cracking.
o Test strip III presented lower peak strain and recovery time data than those of test strips I and II by 50% and 66%, respectively. This may indicate that the ECA-HPTO has higher stiffness and better elastic properties compared to both conventional HPTO and the conductive asphalt mastic.
Structural Integrity:
o The presence of ECA mastic and steel electrodes influenced the structural behaviour of asphalt test strips under accelerated loading conditions. Test strip II, containing a thin ECA mastic layer, exhibited higher maximum deflections before HVS loading and a minimal change in deflection after loading, suggesting ability to maintain the structural stability even after HVS loading.
o Despite the higher dynamic modulus of ECA-HPTO mix in the laboratory, the back-calculated modulus of the ECA-HPTO layer of test strip III was upto 71% lower than the HPTO layer. This could be due to the presence of steel electrodes. Moreover, reducing the spacing between electrodes could lead to an increase in back-calculated moduli, highlighting the sensitivity of structural integrity of ECA pavements to electrode spacing.
o The comparison between predicted and measured tensile strains revealed discrepancies, especially in ECA test strips (II and III), indicating potential limitations in the back-calculation process (e.g. lateral confinement in asphalt layer due to presence of steel electrodes). Research is needed to investigate the influence of lateral confining effects from steel electrodes on tensile strain predictions at the bottom of ECA layers.
Heating ability of conductive test strips – before and after HVS loading:
o Following the application of HVS loading, the power generated by test strips II and III decreased by 4.7% and 3.2%, respectively. This shows that both ECA test strips II and III can maintain its heating capability under truck traffic.
Overall, the findings from this study suggests that by ECA pavements with ECA-HPTO mixture and steel electrodes could have a similar or better structural integrity, rutting and fatigue cracking resistance than the traditional pavement with non-conductive HPTO mixture. However, those with ECA mastic and steel electrodes could have a reduced structural integrity while maintaining a comparable rutting, and fatigue cracking resistance.
Disclosure statement
No potential conflict of interest was reported by the author(s).
Additional information
Funding
References
- Anderson, D. A., and Kennedy, T. W., 1993. Development of SHRP binder specification. Journal of the Association of Asphalt Paving Technologists, 62, 481-507.
- Bejarano, M. O., and Harvey, J. T., 2002. Accelerated pavement testing of drained and undrained pavements under wet base conditions. Transportation Research Record, 1816 (1), 137–147.
- Blanc, J., et al., 2019. Full-scale validation of bio-recycled asphalt mixtures for road pavements. Journal of Cleaner Production, 227, 1068–1078.
- Derwin, D., et al., 2003. Snowfree®, heated pavement system to eliminate icy runways. SAE Technical Paper, 0148-7191.
- Habibpour, M., et al., 2023. Full-scale evaluation of geosynthetic-reinforced hot mix asphalt. Transportation Research Record, 2677 (9), 713–729.
- Harvey, J., Bejarano, M., and Popescu, L., 2001. Accelerated pavement testing of rutting and cracking performance of asphalt-rubber and conventional asphalt concrete overlay strategies. Road Materials and Pavement Design, 2 (3), 229–262.
- Hasan, R., et al., 2021. Laboratory evaluation of electrically conductive asphalt mixtures for snow and ice removal applications. Transportation Research Record, 2675(8), 48–62.
- Huang, B., Chen, X., and Shu, X., 2009. Effects of electrically conductive additives on laboratory-measured properties of asphalt mixtures. Journal of Materials in Civil Engineering, 21 (10), 612–617.
- Liu, X., et al., 2008. Properties evaluation of asphalt-based composites with graphite and mine powders. Construction and Building Materials, 22 (3), 121–126.
- Liu, X., and Wu, S., 2011. Study on the graphite and carbon fiber modified asphalt concrete. Construction and Building Materials, 25 (4), 1807–1811.
- Louw, S., Jones, D., and Wu, R., 2020. Lessons learnt from accelerated pavement testing of full-depth recycled material stabilized with portland cement. ed. Accelerated Pavement Testing to Transport Infrastructure Innovation: Proceedings of 6th APT Conference, 309-318.
- Marath, A., et al., 2023a. Full-scale evaluation of electrically conductive asphalt pavements for deicing applications. Transportation Research Record. https://doi.org/10.1177/03611981231190636
- Marath, A., et al., 2023b. Laboratory evaluation of the electrical resistivity and mechanical performance of electrically conductive asphalt mixtures. Transportation Research Record, 2677 (12), 255–266.
- Minsk, L. D., 1971. Electrically conductive asphaltic concrete. Google Patents.
- Pan, P., et al., 2017. Effect of freezing-thawing and ageing on thermal characteristics and mechanical properties of conductive asphalt concrete. Construction and Building Materials, 140, 239–247.
- Pidwerbesky, B. D., 1995. Accelerated dynamic loading of flexible pavements at the Canterbury accelerated pavement testing indoor facility. Transportation Research Record, 1482, 79.
- Romanoschi, S. A., et al., 1999. Assessment of pavement life at first full-scale accelerated pavement test in Louisiana. Transportation Research Record, 1655 (1), 219–226.
- Saidi, A., et al., 2022. Field assessment of cold in-place recycled asphalt mixtures using accelerated pavement testing. Journal of Transportation Engineering, Part B: Pavements, 148 (3), 04022035.
- Thompson, M. R., and Carpenter, S. H., 2006. Considering hot-mix-asphalt fatigue endurance limit in full-depth mechanistic-empirical pavement design. ed. Proc., International Conference on Perpetual Pavement.
- Wang, H., et al., 2016. Electrical and mechanical properties of asphalt concrete containing conductive fibers and fillers. Construction and Building Materials, 122, 184–190.
- Wen, S., and Chung, D., 2004. Effects of carbon black on the thermal, mechanical and electrical properties of pitch-matrix composites. Carbon, 42 (12-13), 2393–2397.
- Wu, S. P., et al., 2008. Investigation of rheological properties of asphalt binders containing conductive fillers. Key Engineering Materials, 385, 753–756.
- Wu, J., et al., 2015. Strain response of a semi-rigid base asphalt pavement based on heavy-load full-scale accelerated pavement testing with fibre Bragg grating sensors. Road Materials and Pavement Design, 16 (2), 316–333.
- Wu, S., Zhang, Y., and Chen, M., 2010. Research on mechanical characteristics of conductive asphalt concrete by indirect tensile test. ed. Fourth International Conference on Experimental Mechanics, 1720-1727.