
Abstract
Phenomenon: Residency programs throughout the country each receive hundreds to thousands of applications every year. Holistic review of this many applications is challenging, and to-date, few tools exist to streamline or assist in the process for selecting candidates to interview and rank. Machine learning could assist programs in predicting which applicants are likely to be ranked, and among ranked applicants, which are likely to matriculate.
Approach: In the present study, we used the machine learning algorithm Random Forest (RF) to differentiate between ranked and unranked applicants as well as matriculants and ranked non-matriculants to an internal medicine residency program in northern New England over a three-year period. In total, 5,067 ERAS applications were received during the 2016-17, 2017-18, and 2018-19 application cycles. Of these, 4,256 (84.0%) were unranked applicants, 754 (14.9%) were ranked non-matriculants, and 57 (1.12%) were ranked matriculants.
Findings: For differentiating between ranked and unranked applicants, the RF algorithm achieved an area under the receiver operating characteristic (AUROC) curve of 0.925 (95% CI: 0.918-0.932) and area under the precision-recall curve (AUPRC) of 0.652 (0.611-0.685), while for differentiating between matriculants and ranked non-matriculants, the AUROC was 0.597 (95% CI: 0.516-0.680) and AUPRC was 0.114 (0.075-0.167). The ranks of matriculated applicants were significantly higher using the algorithmic rank list as compared with the actual rank list for the 2017-18 (median rank: 98 versus 204, p < .001) and 2018-19 cycles (74 versus 192, p = .006), but not the 2016-17 cycle (97 versus 144, p = .37).
Insights: The RF algorithm predicted which applicants among the overall applicant pool were ranked with impressive accuracy and identified matriculants among ranked candidates with modest but better-than-random accuracy. This approach could assist residency programs with triaging applicants based on the likelihood of a candidate being ranked and/or matriculating.
Introduction
The majority of graduates from allopathic and osteopathic medical schools in the U.S., along with numerous graduates from medical schools across the globe, pursue residency training with the aim of achieving licensure and the ability to practice medicine in the U.S. The bilateral selection process, whereby applicants attempt to identify a best-fit residency program while programs simultaneously attempt to identify an optimal pool of matriculants, is grueling and competitive for both parties. Fearful of not matching a full complement of matriculants, residency programs expend significant resources actively recruiting applicants through websites, online forums, expanded profiles on national platforms, as well as discounted travel, food, and care packages.Citation1–4 At the same time, applicants equally keen to ensure a match apply to increasing numbers of residency programs every year using a standardized application submitted via the Electronic Residency Application Service (ERAS).Citation5–9
As a result of the strategies used by both parties, individual residency programs may receive hundreds to thousands of applications, which often greatly exceeds of the number of available positions. Identifying the candidates most likely to both match and succeed in a program is a complex process, and residency programs must interpret data from a variety of sources (e.g., medical school transcripts, scores from standardized licensing exams, grade narrative summaries, research performance, letters of reference, self-disclosed hobbies and interests, Dean’s letter or Medical Student Performance Evaluation [MSPE], etc.) to evaluate and compare students as part of a holistic review of each applicant within their applicant pool.Citation10,Citation11
Holistic application review - the process of reviewing an application broadly with consideration of the applicant’s background, experiences, extracurricular activities, and academic metrics - is time-consuming and challenging. Indeed, recent data from the 2021 National Residency Matching Program (NRMP) Program Director Survey suggests that amongst internal medicine residency programs, only about 26% of applications receive holistic review, while 57% are rejected based on standardized screening.Citation12 The recent decision to eliminate score-reporting for the United States Medical Licensing Examination (USMLE) Step 1,Citation13 used by many programs as part of their screening metric to compare candidates across programs and institutions,Citation14–17 has led to consternation on the part of program directors about their ability to adequately and meaningfully review applications while continuing to effectively administer a residency program. Yet to-date, few tools exist to streamline or assist in the selection process.Citation17,Citation18 Application inflation and program over-invitation could both be resolved or reduced by an improved selection process that reduces the effort required to conduct a holistic review while maximizing results.
Machine learning (ML) describes a group of computationally intensive algorithms designed to identify patterns in complex, multivariate data. Myriad studies have been published evaluating various uses for ML within healthcare, including diagnostics, illness prognostication, and treatment planning.Citation19 In the present study, we sought to evaluate the usefulness of the ML algorithm Random Forest (RF) as an adjunct tool to assist residency programs in determining which applicants were most likely to be ranked and matriculate to their program, and identify which applicant characteristics were most predictive of these outcomes.
Methods
Our Institutional Review Board deemed this study (Study #: 2000828) as appropriate for exemption. In the present study, we included 5,067 applicants to an academic internal medicine residency program in northern New England during the 2016-17, 2017-18, and 2018-19 application cycles. We characterized study applicants as either unranked applicants (applied to the residency program but were not ranked), ranked non-matriculants (ranked by the program but matriculated elsewhere or did not match), or ranked matriculants (ranked by the program and matriculated to the program). The “unranked applicants” group comprised applicants who were invited to interview but who were not ranked subsequently. We made no changes with respect to the criteria used for inviting and/or ranking applicants across these three application cycles, and as such, we aggregated data from all three cycles for a subset of analyses.
The ERAS application provided all variables evaluated in the present study. We excluded other components of the residency application, including personal statements, MSPE letters, transcripts, letters of reference, and/or unofficial correspondences. In total, we extracted 72 unique variables from ERAS, and categorized them into four categories: 1) demographics (n = 14), 2) medical school characteristics (7), 3) applicant test scores, achievements, and other awards (15), 4) hobbies and interests (30), and 5) other applicant characteristics (6). We present a complete list of variables in the present analysis in Supplementary Table S1. We converted scores from the USMLE Step 1 and USMLE Step 2 CK, as well as those from the Comprehensive Osteopathic Medical Licensing Examination (COMLEX) Level 1 and COMLEX Level 2 CE, to percentile scores using freely accessible data provided by the National Board of Medical Examiners and National Board of Osteopathic Medical Examiners, respectively. For individuals who took both USMLE Step 1 and COMLEX Level 1, or USMLE Step 2 CK and COMLEX Level 2 CE, the higher percentile score was included. We identified “hobbies and interests” by manual curation of the data, and presented keywords used to define these categories in Supplementary Table S2.
Table 1. Characteristics of unranked applicants, ranked non-matriculants, and ranked matriculants.
Table 2. Actual versus algorithmic ranking of 2017-2019 match years.
The final data matrix consisting of 5,067 applicants and 72 variables included 11,864 missing values (3.3%) belonging to nine variables. We treated missing values in one of four ways. First, missing values from the binary variables of ‘Sigma Sigma Phi Recipient’ (n = 4,935), ‘Gold Humanism Recipient’ (3,218), ‘Alpha Omega Alpha Recipient’ (2,878), and ‘USMLE Step 2 CS/COMLEX 2 PE Pass/Fail’ (208) were treated equivalently to applicants who reported either being a non-recipient or having not received a passing score (e.g., 0 on a binary 0/1 scale). Second, we assigned missing values for the continuous variables of ‘USMLE Step 1/COMLEX Level 1%’ (23) or ‘USMLE Step 2/COMLEX Level 2′ (98) to the 0th percentile. Third, we imputed missing values for the continuous variable of ‘Age’ (14) using mean value imputation. Fourth, we assigned missing values for the categorical variables of ‘Ethnicity’ (483) and ‘Permanent State’ (7) to an ‘Other’ category consisting of applicants who either did not respond or for whom their response did not fit into one of the categories available for selection on the ERAS application.
We performed all statistical analyses using R version 4.0.4 (R Foundation for Statistical Computing, Vienna, Austria). We employed the ‘randomForest’ package to perform RF, which we used to distinguish between: 1) unranked applicants and ranked applicants (including both matriculants and non-matriculants), and 2) ranked non-matriculants and ranked matriculants.Citation20 The RF algorithm randomly chooses a subset of samples and builds a “decision tree” designed to separate samples from different classes (e.g., unranked applicants versus ranked applicants). It achieves this by creating numerous branchpoints (or “nodes”) in the tree that separate samples using values of a randomly selected subset of variables. It repeats this process numerous times to create a “forest” of trees, each one containing a unique combination of samples and nodes. We evaluated the algorithm performance by taking an “unknown” sample (i.e., a sample whose true class is known, but which was not used in the building of the forest) and determining whether it was correctly or incorrectly classified. The algorithm provides probabilities that the sample belongs to each of the two classes of interest, and these can be compared to the true class to which the sample belongs. For example, if a sample belonging to class “X” in the comparison of class “X” versus class “Y” is assigned a 0.85 probability of belonging to “X” and a 0.15 probability of belonging to “Y” then it would be considered correctly classified.
We used a three-fold cross-validation scheme, where we used 67% of study applicants to train the algorithm (the “training set”), and used 33% to evaluate the performance of the algorithm (the “test set”). We assigned study applicants into training and test sets completely random, and repeated the process 100 times, with the composition of the training and test sets differing with each iteration. Supplementary Table S3 includes a complete list of algorithm parameters. Outputs of interest from the RF algorithm include: variable importance (as defined by the mean decrease in accuracy) and class probabilities (defined as the probability, on a scale from 0 to 1, that a given study subject belongs to each of the classes being compared with one another). Mean decrease in accuracy describes the decrease in the accuracy of the statistical model when the values of a given variable are randomly selected, with a higher mean decrease in accuracy reflecting a more important variable with respect to distinguishing between the classes of interest. We compared class probabilities (a continuous variable on a scale of 0 to 1) with the true class to which a sample belonged (a binary variable consisting of either 0 or 1) to generate receiver operating characteristic (ROC) and precision-recall (PR) curves. ROC and PRC curves are means of quantifying the performance of a classifier by comparing true positive versus false positive rates (for ROC) or precision versus recall (for PRC) across a range of diagnostic cutoffs (in this case, the class probabilities generated from RF). We used the ‘precrec’ package to calculate the area under the ROC curve (AUROC) and area under the PRC curve (AUPRC) with confidence intervals estimated using bootstrap data, with 2,000 bootstrap iterations per estimate.
We created “algorithmic rank lists” by sorting ranked applicants based on their probability of matriculating, using probabilities generated from RF. We assigned the ranked applicant with the highest probability of matriculating to the first position on the rank list, and sorted the remainder of the list in order of descending probability. We compared the ranks of matriculants on the algorithmic rank list versus the actual rank list for 2016-17, 2017-18, and 2018-19 application cycles independently using the Mann-Whitney U-test. We defined rank-to-match ratio by dividing the rank of the last matriculant on the rank list with the total number of matriculants for that application cycle.
We used the Chi-squared test for the comparison of categorical variables. For the comparison of continuous variables, we used the Shapiro-Wilk test first to determine whether the variables were derived from normally-distributed data. We determined that none of the variables of interest were normally distributed, and as such, used the non-parametric Mann-Whitney U-test in the comparison of two groups, and the Kruskal-Wallis H-test in the comparison of three or more groups. A p-value of .05 was considered the threshold for statistical significance in all analyses.
Results
In total, this internal medicine residency program received 5,067 ERAS applications by during the 2016-17, 2017-18, and 2018-19 application cycles. Of these, 4,256 (84.0%) were unranked applicants, 754 (14.9%) were ranked non-matriculants, and 57 (1.12%) were ranked matriculants. Characteristics of these three groups are presented in . In the three-group comparison of unranked applicants, ranked non-matriculants, and ranked matriculants, there were significant differences between groups with respect to all of the variables evaluated (gender, age, ethnicity, permanent residence, medical school location, medical school type, and percentile scores on the USMLE Step 1/COMLEX-USA 1 and USMLE Step 2 CK/COMLEX-USA 2 CE). In the comparison of ranked non-matriculants and ranked matriculants, we noted significant differences with respect to medical school location (p = .03) and medical school type (p < .001).
The RF algorithm was used to predict which of the 5,067 applicants were likely to be ranked by the residency program. Using this algorithm, each applicant was assigned a probability of being ranked on a scale of 0 to 1. This probability was compared with the true binary outcome (i.e., ranked versus unranked) to generate receiver operating characteristic (ROC) curves. Among test set samples, the area under the ROC curve (AUROC) was 0.925 (95% CI: 0.918-0.932) for the aggregated data, 0.915 (0.906-0.933) for 2016-17, 0.948 (0.935-0.957) for 2017-18, and 0.911 (0.894-0.922) for 2018-19 (). Corresponding areas under the precision-recall curves (AUPRCs) for all years, 2016-17, 2017-18, and 2018-19 were 0.652 (0.611-0.685), 0.579 (0.525-0.662), 0.742 (0.664-0.789), and 0.648 (0.571-0.687), respectively.
Figure 1. Prediction of ranked applicants among all applicants using the RF algorithm. AUROCs for the aggregated data set as well as the individual application cycles (2016-17, 2017-18, and 2018-19) are presented in (top). The top 20 variables ranked by variable importance, as defined by the mean decrease in accuracy, are presented in (bottom).
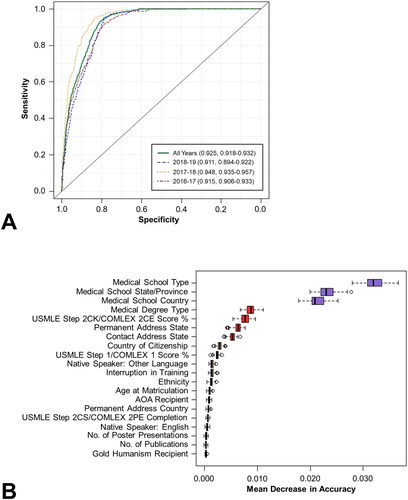
The mean decrease in accuracy coefficient was used as the measure of variable importance and was calculated for each of the 72 variables included in the model. The most important variables with respect to differentiating between ranked and unranked applicants, as defined using this metric, were medical school type, medical school state/province, medical school country, medical degree type, and USMLE Step 2 CK/COMLEX 2CE score % (). Among the top 20 variables, eight were related to demographics (permanent address state, contact address state, country of citizenship, native speaker of a non-English language, ethnicity, age at matriculation, permanent address country, native speaker of English), four to medical school characteristics (medical school type, medical school state/province, medical school country, medical degree type), seven to applicant test scores and achievements (USMLE Step 2CK/COMLEX 2CE score %, USMLE Step 1/COMLEX 1 score %, AOA recipient, USMLE Step 2 CS/COMLEX 2PE completion, number of poster presentations, number of publications, Gold Humanism recipient), and one to other (interruption in training). A complete list of all variables and their associated mean decrease in accuracy coefficients can be found in Supplementary Table S4.
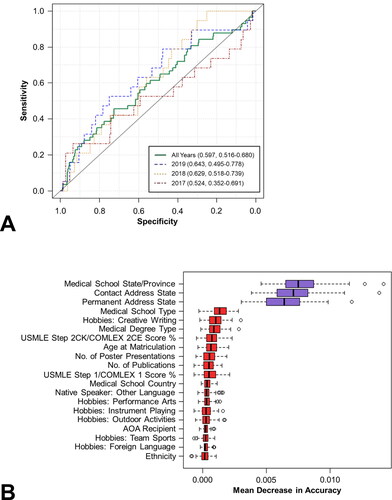
We employed the same methodology to differentiate between ranked non-matriculants (n = 754) and ranked matriculants (n = 57). The AUROC was 0.597 (95% CI: 0.516-0.680) for the aggregated data, 0.524 (0.352-0.691) for 2016-17, 0.629 (0.518-0.739) for 2017-18, and 0.643 (0.495-0.778) for 2018-19 (). Corresponding AUPRCs for all years, 2016-17, 2017-18, and 2018-19 were 0.112 (0.075-0.167), 0.129 (0.055-0.279), 0.101 (0.054-0.180), and 0.114 (0.056-0.230), respectively. The most important variables with respect to differentiating between ranked matriculants and ranked non-matriculants were medical school state/province, contact address state, permanent address state, medical school type, and hobbies: creative writing (). Among the top 20 variables, five were related to demographics (contact address state, permanent address state, age at matriculation, native speaker of a non-English language, and ethnicity), four were related to medical school characteristics (medical school state/province, medical school type, medical degree type, medical school country), five were related to applicant test scores and achievements (USMLE Step 2CK/COMLEX 2CE score %, number of poster presentations, number of publications, USMLE Step 1/COMLEX 1 score %, AOA recipient), and six were related to hobbies and interests (creative writing, performance arts, instrument playing, outdoor activities, team sports, and foreign languages). A complete list of all variables and their associated mean decrease in accuracy coefficients can be found in Supplementary Table S5.
Figure 2. Prediction of ranked matriculants versus ranked non-matriculants using the RF algorithm. AUROCs for the aggregated data set as well as the individual application cycles are presented in (top). The top 20 variables ranked by variable importance are presented in (bottom).
Finally, we generated algorithmic rank lists for the 2016-17, 2017-18, and 2018-19 application cycles using matriculation probabilities calculated from RF. These algorithmic rank lists were then compared with the actual rank list for the corresponding application cycle (). The ranks of matriculated applicants were significantly higher using the algorithmic rank list as compared with the actual rank list for both the 2017-18 cycle (median rank: 98 versus 204, p < .0001) and 2018-19 cycle (74 versus 192, p = .006), but not the 2016-17 cycle (97 versus 144, p = .37). The actual rank-to-match ratios (e.g., rank of final matriculated applicant divided by number of matriculants) for the 2016-17, 2017-18, and 2018-19 match years were 12.2, 13.5, and 14.5, respectively. In comparison, the rank-to-match ratios calculated for the algorithmic rank lists were 12.0, 10.4, and 14.3, respectively.
Discussion
In the present study, we demonstrate the application of a ML algorithm for the purpose of identifying both ranked applicants and matriculants to an internal medicine residency program in northern New England. To the best of our knowledge, this is the first published use of ML for this purpose. Our findings demonstrate that this approach can identify ranked candidates among the overall applicant pool with an impressive degree of accuracy (AUROC: 0.925, 95% CI: 0.918-0.932) and identify matriculants among ranked candidates with a degree of accuracy that is modest but superior to random probability (AUROC: 0.597, 95% CI: 0.516-0.680). In addition, algorithmic rank lists generated using probabilities from the RF algorithm performed statistically better than the actual rank lists for the 2017-18 and 2018-19 application cycles.
Notably, AUROCs were substantially higher than AUPRCs for all analyses included in the present study, driven largely by an imbalanced dataset in which 84% of applicants in the comparison of ranked versus unranked applicants belonged to the majority class (e.g., unranked), while 93% in the comparison of matriculants versus non-matriculants belonged to the majority class (e.g., non-matriculants). Of note, an AUROC of 0.5 indicates that the algorithm performs no better than random chance, and this is true irrespective of the underlying characteristics of the data with respect to the number of applicants in each class. In contrast, the AUPRC is sensitive to the relative proportion of applicants in the majority and minority classes, and thus AUPRCs lower than 0.5 may still indicate better-than-random performance.
For both analyses (ranked versus unranked applicants and matriculants versus non-matriculants), the categories of “demographics,” “medical school characteristics,” and “applicant test scores, achievements, and other awards” yielded variables with greater importance than the “hobbies and interests” category. Indeed, although “hobbies and interests” accounted for approximately 40% of all variables, none were among the top 20 variables with respect to distinguishing between ranked and unranked applicants, and only six (creative writing, performance arts, instrument playing, outdoor activities, team sports, and foreign language) were among the top 20 with respect to distinguishing between matriculants and non-matriculants. Notably, region- and environment-specific hobbies and interests had little predictive value with respect to identifying either ranked applicants or matriculants.
ML is a rapidly-growing field, with the number of PubMed-indexed manuscripts including the term “machine learning” increasing at an exponential pace from 588 in 2010 to 12,400 in 2020. ML algorithms (which for the purpose of this discussion include techniques sometimes described as “artificial intelligence”) have demonstrated potential utility in a wide range of clinical scenarios, including diagnostics (specifically within radiologyCitation21 and pathologyCitation22) illness prognostication,Citation23,Citation24 and treatment planning.Citation25 In addition, a smaller body of research exists evaluating the potential role of ML in admissions processesCitation26,Citation27 and physician competence.Citation28 Of note, the ‘Cortex’ platform from Thalamus purports to “optimize match probabilities for applicants and programs” using a proprietary “Match Assist Algorithm”, heralding the introduction of ML into the residency match process.Citation29 Based on the proprietary nature of this algorithm, however, it is unclear which applicant and program features contribute to the match prediction. In addition, a recent study by Burk-Rafel and colleagues demonstrated the utility of a machine learning algorithm for predicting interview offers for an internal medicine residency program, although this study did not evaluate the potential for machine learning to predict which interviewed applicants were likely to matriculate to the program.Citation30
In our opinion, selecting interviewees or generating a rank list using an algorithm in isolation is both unethical and wholly against the spirit of evaluating candidates holistically. However, this approach could potentially serve as an adjunct to the human review process, assisting programs with triaging applicants based on the likelihood of being ranked or matriculating. For example, applicants who might otherwise not receive an interview based on initial review of their application but who receive a high score with respect to the probability of being ranked and/or matriculating might trigger a second round of review by a different evaluator. Alternatively, if there are a large number of similarly competitive applicants competing for a relatively small number of interview positions, this approach could be used to help suggest which applicants to select to interview.
In addition, this approach could also alert programs to areas of implicit bias with respect to their processes for interviewing and ranking candidates, as we ourselves note important differences with respect to the compositions of the “unranked applicants,” “ranked non-matriculants,” and “ranked matriculants” populations. Specifically, we note differences between ranked and unranked applicants with respect to gender, age, ethnicity, permanent residence, medical school location, and medical school type. We suspect that many of these differences (specifically with respect to ethnicity, permanent residence, medical school location, and medical school type) are explained by the relative overrepresentation of graduates from medical schools outside of the U.S. and Canada among unranked applicants relative to ranked applicants, while differences with respect to age may be driven by a subset of applicants who reapply after an unsuccessful match in prior years. Reassuringly, there is greater homogeneity between ranked non-matriculants and ranked matriculants, suggesting that these demographic variables may be less important amongst the pool of candidates who receive an interview. Of note, while the algorithm presented here has not been incorporated into the residency interview and rank list generation process at our institution, it has alerted the authors to potential implicit bias with respect to the subset of applicants who are selected to interview, which will hopefully impact the process of selecting candidates to interview and rank in subsequent application cycles.
There are a number of study limitations that deserve mention. First, the present data analysis includes only those variables included within the ERAS application, and excludes content from the MSPE, letters of recommendation, personal statement, and/or unofficial communications between the applicant and program. It is unclear to what extent the inclusion of such variables could have improved model performance, but this could represent an area of future study. Indeed, results of the 2021 NRMP Program Director Survey indicate that other application components not encapsulated within the ERAS application are important with respect to selecting candidates to interview and/or rank (e.g., MSPE, clerkship grades, letters of reference).Citation12 We strongly suspect that these components would be reviewed more comprehensively than the “Hobbies & Interests” section of the ERAS application. Indeed, all the self-reported interests and hobbies incorporated into the current model come from a single, brief section of the ERAS application, and undoubtedly fail to capture critical attributes of the applicant that are better described in the personal statement, MSPE, and letters of reference. Second, because residency programs consider variables other than likelihood of matriculation when generating rank lists, the comparison between the actual rank lists and algorithmic rank lists (which considered only probability of matching) must be interpreted accordingly. Third, because each residency program has distinct program characteristics and offerings that appeal variably to different applicants, the external validity of this algorithm remains unknown. Fourth, while the algorithm performed well with respect to differentiating between ranked and unranked applicants, its performance was only modest with respect to distinguishing between matriculants and non-matriculants. If one envisions the RF algorithm as attempting to estimate how much a program and candidate “like” one another, it would ideally also consider the extent to which candidates like other programs as well, and how much those other programs, in turn, like that candidate, in order to generate optimal estimates. These data, unfortunately, are unavailable to us, and without those data, the algorithm is doomed to suffer from limitations with respect to predictive ability in a system where a candidate is only able to match to a single program. Finally, RF is only one among many potential algorithms that could be applied to this problem, selected in this case for a number of reasons, including its ability to tolerate both linear and non-linear predictors, its robustness in the face of outliers, and its relative interpretability as compared with other methods (e.g., neural networks). While the present study sought to demonstrate the utility of a machine learning algorithm to assist with the residency interviewing and selection process, future work could compare the performance of multiple algorithms to address the same problem.
Conclusions
In conclusion, we demonstrate the utility of a machine learning algorithm for differentiating between ranked and unranked applicants as well as matriculants and ranked non-matriculants, to an internal medicine residency program at an academic tertiary care center in northern New England. The algorithm had impressive accuracy for differentiating between ranked and unranked applicants, and a modest but better-than-random accuracy for differentiating between matriculants and ranked non-matriculants. The use of machine learning to assist with the residency interviewing and ranking process could paradoxically allow for a more holistic application review by considering one’s hobbies, interests, and background alongside their exam scores and academic awards. Future studies would ideally consider other application components beyond data contained within the ERAS application and establish external validity through the inclusion of prospective data from multiple residency programs across both institutions and specialties, and could also evaluate other outcomes of interest (e.g., achieving a passing score on the medicine board examination, the likelihood of withdrawing from residency, etc).
HTLM-2021-0597.R1_APPENDICES.SUPPLEMENTAL.CONTENT.ONLINE.ONLY.pdf
Download PDF (310.2 KB)Declaration of interests
The authors report that no conflicts of interest exist.
Funding
The author(s) reported there is no funding associated with the work featured in this article.
Data availability statement
De-identified applicant data is available from the authors at reasonable request.
References
- Angus SV, Williams CM, Stewart EA, Sweet M, Kisielewski M, Willett LL. Internal medicine residency program directors’ screening practices and perceptions about recruitment challenges. Acad Med. 2020;95(4):582–589. doi:10.1097/ACM.0000000000003086.
- Gliatto P, Karani R. Viewpoint from 2 undergraduate medical education deans the residency application process: working well, needs fixing, or broken beyond repair? J Grad Med Educ. 2016;8(3):307–310. doi:10.4300/JGME-D-16-00230.1.
- Nilsen K, Callaway P, Phillips J, Walling A. How much do family medicine residency programs spend on resident recruitment? A cera study. Fam Med. 2019;51(5):405–412. doi:10.22454/FamMed.2019.663971.
- Brummond A, Sefcik S, Halvorsen AJ, et al. Resident recruitment costs: a national survey of internal medicine program directors. Am J Med. 2013;126(7):646–653. doi:10.1016/j.amjmed.2013.03.018.
- Chang CWD, Erhardt BF. Rising residency applications: how high will it go? Otolaryngol Head Neck Surg. 2015;153(5):702–705. doi:10.1177/0194599815597216.
- Nasreddine AY, Gallo R. Applying to orthopaedic residency and matching rates: analysis and review of the past 25 years. J Bone Joint Surg. 2019;101(24):e134. doi:10.2106/JBJS.18.00371.
- Trikha R, Keswani A, Ishmael CR, Greig D, Kelley BV, Bernthal NM. Current trends in orthopaedic surgery residency applications and match rates. J Bone Joint Surg Am. 2020;102(6):e24 doi:10.2106/JBJS.19.00930.
- Malafa MM, Nagarkar PA, Janis JE. Insights from the San Francisco Match rank list data: how many interviews does it take to match? Ann Plast Surg. 2014;72(5):584–588. doi:10.1097/SAP.0000000000000185.
- Weissbart SJ, Kim SJ, Feinn RS, Stock JA. Relationship between the number of residency applications and the yearly match rate: time to start thinking about an application limit? J Grad Med Educ. 2015;7(1):81–85. doi:10.4300/JGME-D-14-00270.1.
- Lin GL, Nwora C, Warton L. Pass/fail score reporting for USMLE step 1: an opportunity to redefine the transition to residency together. Acad Med. 2020;95(9):1308–1311. doi:10.1097/ACM.0000000000003495.
- Naclerio RM, Pinto JM, Baroody FM. Drowning in applications for residency training: a program’s perspective and simple solutions. JAMA Otolaryngol Head Neck Surg. 2014;140(8):695–696. doi:10.1001/jamaoto.2014.1127.
- National Resident Matching Program. Results of the 2021 NRMP Program Director Survey. National Resident Matching Program; 2021. https://www.nrmp.org/wp-content/uploads/2021/11/2021-PD-Survey-Report-for-WWW.pdf
- U.S. Medical Licensing Examination | Invitational Conference on USMLE Scoring. https://www.usmle.org/incus/#decision. Accessed February 7, 2021.
- National Residency Matching Program. National Resident Matching Program, Data Release and Research Committee: Results of the 2020 NRMP Program Director Survey; 2020. https://www.nrmp.org/wp-content/uploads/2021/08/2020-PD-Survey.pdf
- Schiavone FM. A look back at NRMP 2020 and the road ahead. HCA Healthc J Med. 2020;1(2) doi:10.36518/2689-0216.1071.
- Katsufrakis PJ, Chaudhry HJ. Improving residency selection requires close study and better understanding of stakeholder needs. Acad Med. 2019;94(3):305–308. doi:10.1097/ACM.0000000000002559.
- Cohn MR, Bigach SD, Bernstein DN, et al. Resident selection in the wake of United States medical licensing examination step 1 transition to pass/fail scoring. J Am Acad Orthop Surg. 2020;28(21):865–873. doi:10.5435/JAAOS-D-20-00359.
- Katsufrakis PJ, Uhler TA, Jones LD. The residency application process: pursuing improved outcomes through better understanding of the issues. Acad Med. 2016;91(11):1483–1487. doi:10.1097/ACM.0000000000001411.
- Rajkomar A, Dean J, Kohane I. Machine learning in medicine. N Engl J Med. 2019;380(14):1347–1358. doi:10.1056/NEJMra1814259.
- Breiman L. Random forests. Mach Learn. 2001;45(1):5–32. doi:10.1023/A:1010933404324.
- Choy G, Khalilzadeh O, Michalski M, et al. Current applications and future impact of machine learning in radiology. Radiology. 2018;288(2):318–328. doi:10.1148/radiol.2018171820.
- Madabhushi A, Lee G. Image analysis and machine learning in digital pathology: Challenges and opportunities. Med Image Anal. 2016;33:170–175. doi:10.1016/j.media.2016.06.037.
- Kourou K, Exarchos TP, Exarchos KP, Karamouzis MV, Fotiadis DI. Machine learning applications in cancer prognosis and prediction. Comput Struct Biotechnol J. 2015;13:8–17. doi:10.1016/j.csbj.2014.11.005.
- Cruz JA, Wishart DS. Applications of machine learning in cancer prediction and prognosis. Cancer Inf. 2007;2:59–77.
- Wang C, Zhu X, Hong JC, Zheng D. Artificial intelligence in radiotherapy treatment planning: present and future. Technol Cancer Res Treat. 2019;18:1533033819873922 doi:10.1177/1533033819873922.
- Waters A, Miikkulainen R. GRADE: machine learning support for graduate admissions. AIMag. 2014;35(1):64–64. doi:10.1609/aimag.v35i1.2504.
- Lux T, Pittman R, Shende M, Shende A. Applications of supervised learning techniques on undergraduate admissions data In: Proceedings of the ACM International Conference on Computing Frontiers. CF ‘16. Association for Computing Machinery; 2016:412–417. doi:10.1145/2903150.2911717.
- Dias RD, Gupta A, Yule SJ. Using machine learning to assess physician competence: a systematic review. Acad Med. 2019;94(3):427–439. doi:10.1097/ACM.0000000000002414.
- Cortex: Powered by Thalamus. Data-driven GME recruitment engine optimizing matches for applicants & programs; 2020. https://cdn-prod.cortexgme.com/wp-content/uploads/2020/02/27210543/cortex-methodology.pdf.
- Burk-Rafel J, Reinstein I, Feng J, et al. Development and validation of a machine-learning-based decision support tool for residency applicant screening and review. Acad Med J Assoc Am Med Coll. 2021;96(11S):S54–S61. doi:10.1097/ACM.0000000000004317.