Abstract
Smearing damage was created on cylindrical roller bearings (CRBs) using a laboratory test protocol that required alternating the load zone direction according to a square wave function. The experimental goal was to compare the wear protection afforded by various surface treatments, including vibratory superfinishing (ES20), black oxide treatment, and special tungsten carbide–reinforced amorphous hydrocarbon roller body coatings (WC/a-C:H). The only bearing treatments that did not smear in these severe tests were the WC/a-C:H bearings. Black oxide and ES20 bearings experienced smearing with the same frequency as untreated bearings, albeit to different degrees of microscopic damage. The test rig was instrumented to measure cage slip, which provided insight about the roller–raceway slip dynamics during the tests via kinematic calculations. The CAGEDYN bearing dynamics model was used to simulate the experimental smearing test conditions, and it provided encouragement that accurate prediction of smearing risk may be possible in the future with further development.
Nomenclature
| Fr | = |
Applied radial load to the test bearing (kN) |
| P | = |
Mean Hertzian contact pressure (Pa) |
| P max | = |
Maximum Hertzian contact pressure (Pa) |
| Qo | = |
Contact load between a single roller and the outer ring raceway (kN) |
| Ra | = |
Arithmetic average roughness (nm) |
| r | = |
Roller radius (m) |
| ri | = |
Inner ring raceway radius (m) |
| ro | = |
Outer ring raceway radius (m) |
| SRRi | = |
Δui /uent,i = Slide-to-roll ratio at the roller body − inner raceway contact (%) |
| uent | = |
Lubricant entrainment velocity at inner (subscript i) or outer (subscript o) raceway contact (m/s) |
| Δu | = |
Sliding speed between the roller body and inner (subscript i) or outer (subscript o) raceway (m/s) |
| μ | = |
Friction coefficient |
| τ | = |
Mean shear stress due to friction = μ·P (Pa) |
| Φ | = |
Proposed smearing criterion = μ·P max·Δu (W·m−2) |
| ω c | = |
Cage speed (rad/s) |
| ω i | = |
Inner ring rotational speed (assuming fixed outer ring) (rad/s) |
| ω r | = |
Roller rotational speed about its own axis (rad/s) |
INTRODUCTION
In practice, rolling element bearing life is predicted by estimating the statistical likelihood of material fatigue while taking into account information about the bearing design and general operating conditions. For example, bearing manufacturer catalogs make load ratings available that can be entered into an equation along with other factor adjustments to estimate bearing operating life. This approach was adopted because the bearing designer often has limited information about the end user's application specifics, including transient conditions in the application loads, temperatures, lubrication interruptions, or misalignments. Statistics show that despite the mutual good intentions of both bearing manufacturers and end users, wear and damage can also limit rolling element bearing life. One example is the occurrence of smearing damage in wind turbine gearbox bearings, associated with operation of the gearbox at nominal application speeds and light loads. In particular, field reports claim that inadequate surface durability in planet bearings, intermediate shaft bearings, and high-speed shaft bearings has impaired overall gearbox reliability in the last decade (Musial, et al. ( Citation 1 )). The present study explores smearing damage in cylindrical bearings both experimentally and with simulations.
Rowe ( Citation 2 ) described smearing simply as adhesive wear that can occur between two bodies when they are rubbed against each other “severely.” In a rolling element bearing, this can occur when the rotation of rolling elements changes rapidly during operation. For example, roller body–raceway sliding can occur as spherical rollers accelerate upon entering the load zone in a radially loaded bearing (Rowe ( Citation 2 )). Smearing damage bands may be found on both raceways and roller bodies in these situations (e.g., cylindrical rollers; Rowe ( Citation 2 )). Cocks and Tallian ( Citation 3 ) further highlighted the role of rolling element sliding in the development of smearing damage. They noted that smearing is characterized by plastic deformation of the contact surfaces with accompanying material transfer. They acknowledged the debate at that time (1971) about the role of temperature and other factors in the scuffing/smearing mechanism and presented a parametric study of the factors that caused smearing on 1-in.-diameter test balls (Cocks and Tallian ( Citation 3 )). The results were inconclusive, but applied test load, rather than measured surface temperatures, was the only studied factor that correlated with the onset of smearing. Torrance and Cameron ( Citation 4 ) studied surface microstructural transformations accompanying smearing and recognized that white etching layers with a small grain size were formed in the surface material immediately beneath scuffing damage marks. They hypothesized that the white layers were formed by high surface shear and, to a lesser extent, frictional heating. Dyson ( Citation 5 ) acknowledged that an increase in measured friction always accompanies scuffing/smearing during tribotesting and that this type of damage can only be generated when slip is present between two surfaces. He then proposed that the quantity τ·Δu (or μ·P·Δu) could be referred to as the “friction power intensity” and argued that this is the most objective way to compare scuffing data from various sources. A similar concept was used by Bujoreanu, et al. ( Citation 6 ), who tested both μ·P·Δu and μ·P max·(Δu 0.8) and suggested a threshold value of about 1.5 × 10⁸ W·m−2 for both quantities correlated to the onset of smearing in an angular contact ball bearing and disk-on-disk test rig reported by Nelias ( Citation 7 ). The approach that was adopted for the present study was to calculate a “smearing criterion” Φ = μ·P max·Δu that also indicated a smearing threshold value of around 1.5 × 10⁸ W·m−2 for Nelias's disk-on-disk data set.
Though there are many published fundamental studies on scuffing using tribology test equipment and lab specimens, the literature on smearing in steel roller bearings is sparse. Hamer, et al. ( Citation 8 ) noted that smearing most often occurs in large, slow-moving roller bearings such as those found in manufacturing process and other heavy equipment. They conducted smearing experiments with a roller-on-roller contact rig designed to approximate the conditions of a roller accelerating upon entering the load zone. A finding was that the roller needed to be almost stationary or have minimal rotation about its own axis as it enters the load zone in order to achieve smearing. If the angular velocity of the rolling element was as much as 20% of the theoretical pure rolling angular velocity in the load zone upon entry, smearing damage would not occur. They postulated that heat conduction to the contact inlet and consequential film thinning during rapid acceleration at the load zone inlet is a potential cause for smearing. Pihlstrom and Strom ( Citation 9 ) performed smearing studies using spherical roller bearings to evaluate the effectiveness of various surface treatments in preventing damage. They first ran-in the test bearings and then incrementally increased the speed and applied load to accelerate the roller set. A specific surface energy was calculated to help interpret the results, which was the integral of the product of the frictional force and entrainment speed. Furthermore, the uncoated rollers had the greatest propensity for smearing, followed by those treated with black oxide (which only gave incremental improvement), and finally diamond-like carbon–coated rollers, which did not smear at all but exhibited a tendency for coating delamination (Pihlstrom and Strom ( Citation 9 )). Scherb and Zech ( Citation 10 ) noted that rolling element acceleration and fluctuations in slip conditions may contribute to smearing and that smearing most often occurs with new bearings early in their life cycle. Likewise, they calculated a frictional energy quantity to estimate risk of smearing in real applications and noted that smearing was only observed in full complement cylindrical roller bearings (CRBs) running at 60%+ of the limiting speed. Lastly, they concluded that roller slip had the greatest influence on smearing and recommended the use of black oxide for mitigating the damage mode. Black oxide treatment was explored further (Miailidis, et al. ( Citation 11 )) in twin-disk studies using ISO VG 32 oil without additives, with the conclusion that treated surfaces were superior to uncoated steel for delaying smearing. In that study (Miailidis, et al. ( Citation 11 )), the slide-to-roll ratio (SRR) was incrementally increased until smearing occurred. None of the above-noted studies described successful smearing tests using commercially available, unmodified, caged CRBs.
The objective of the present work was to conduct smearing tests using production CRBs and to evaluate the effectiveness of engineered surface treatments to mitigate the damage, similar to the goals of Pihlstrom and Strom ( Citation 9 ). Three types of surface treatments were tested for smearing protection: improved surface finishes/superfinishing, black oxide chemical conversion surface treatment, and a combination of improved finish and hard coatings deposited on roller bodies. In particular, the hard coatings evaluated were tungsten carbide–reinforced amorphous hydrocarbon thin film coatings (WC/a-C:H; Doll and Evans ( Citation 12 )). It is shown that smearing was only achieved by oscillating the load zone direction in diametrically opposite locations with time and that the hard coating treatments on roller bodies offered the best protection against smearing without evidence of coating delamination. In addition, the CAGEDYN bearing dynamics simulation tool (Houpert ( Citation 13 )–( Citation 15 )) was used to model the conditions generated using the test rig and to explore the effectiveness of using a smearing criterion Φ for predicting damage risk in real applications.
EXPERIMENTAL
Smearing Test
A Timken-developed four-spindle test rig (4-S rig) was used to generate smearing damage in full-scale CRBs by the controlled application of light radial loading. The 4-S rig has a large drive spindle upon which an overhanging bearing assembly can be mounted and rotated at speeds up to 377 rad/s (3,600 rpm). Specially designed tooling allows precise control of load direction during the testing; that is, the load cylinder can “push and pull” in the radial direction to provide the desired load level and location during the tests. The test bearing was lubricated by a circulating oil system with both controlled inlet temperature and flow rate capability; however, only the flow rate was controlled during the present experiments. Rig and bearing temperatures were measured with thermocouples, spindle torque was recorded using an in-line torque meter, and vibration was detected with accelerometers. Test bearing cage speed was measured using a Bentley Nevada 3300 XL 8 mm Proximity Transducer System. Tooling was designed to position the sensor to target the roller ends. Data were acquired using a National Instruments USB–6215 data acquisition module. A code was developed in LabVIEW 8.6.1 to collect and process the roller pass frequency to determine roller orbital speed and acceleration. shows a schematic of the test rig configuration.
Fig. 1 Illustration of the Timken 4-S test rig used for CRB smearing tests.
Four different bearing treatments were tested for smearing resistance as summarized in . Standard bearings with ground raceway and roller body finishes served as the baseline condition and are designated as ground. The influence of roller body roughness reduction via superfinishing was tested with the ES20 bearings, which also had honed inner and outer ring raceways. The ES20 process is a vibratory processing technique in which the components are immersed in a particulate ceramic media with wet chemicals added and vibrated to produce a nondirectional surface texture with reduced roughness (Hashimoto, et al. ( Citation 16 )). Test bearings with the black oxide treatment were identical to the ES20 bearings but with a standard black oxidizing chemical conversion process applied to both the honed rings and superfinished rollers. Lastly, WC/a-C:H treatments were similar to the ES20 bearings but had the addition of a unique WC/a-C:H coating deposited on the roller body surfaces (Timken ES302). The coating was a specially designed tungsten carbide–reinforced amorphous hydrocarbon film (WC/a-C:H) with thickness ∼1 μm that was deposited on the rollers using reactive sputtering physical vapor deposition. It was specially optimized for durability in rolling contacts (Doll and Evans ( Citation 12 )).
Table 1 Test Bearing Treatment Identification Names and Descriptions
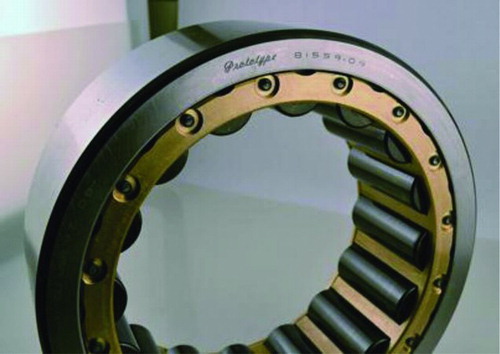
NU-type CRBs were selected as the test bearings, with an example shown in that underwent the WC/a-C:H treatment. NU CRBs are used to support heavy radial loads typically and have a flangeless floating inner ring that allows the bearing to accommodate axial shaft displacement. Each bearing was made of through-hardened AISI 52100 steel and contained 16 rollers with nominal dimensions of outer diameter = 290 mm, bore = 160 mm, and width = 98.425 mm. The inner diameter, outer diameter, and width of both inner and outer rings were verified with a universal measuring machine prior to final assembly and testing. The surface finishes for each of the components are given in . Average values of the arithmetic roughness, Ra , are given for each component of the test bearings. One measurement was collected from each of the inner ring raceway, outer ring raceway, and a roller body sample from each of the test bearings, with three test bearings measured per treatment. Data were collected using a Hommelwerke T8000 2D stylus profilometer with TurboWave V7.20 analysis software.
Table 2 Surface Finish Arithmetic Roughness (RA ) Data for the Test Bearings. Averages and Standard Deviations of Measurements from Three Test Bearings Reported
Fig. 2 Photograph of the outer ring–roller assembly from one group of WC/a-C:H test NU CRBs after a smearing test (color figure available online).
The development of a smearing test protocol was challenging. After the test tooling was developed to accommodate the test bearings on the 4-S rig, several tests were performed using ground bearings to determine whether smearing could be achieved. Rigorous test rig setup and bearing installation procedures were developed and followed to minimize the potential for misalignment-related error in the test results. Initially, steady-state operation at low loads (<5% C1 dynamic load rating) and various speeds were attempted for both short and long test durations with no success. Likewise, a monotonic load-level step-down test was attempted at constant speed with no success. The load level was oscillated with successively lower load step levels at constant speed. Load was oscillated between a constant low level and successively higher step load levels at constant speed. The load was stepped above and below a constant load level at constant speed. In some trials, the load level was fixed and the speed was dropped and then rapidly accelerated. Many other low-load/high-speed profiles were attempted, as well as different oil types, temperatures, and degrees of starvation, all without success. The need to impose intentional, uncommon dynamic conditions to achieve smearing in CRBs was anticipated from the literature as noted previously. For example, the work of Hamer, et al. ( Citation 8 ), Pihlstrom and Strom ( Citation 9 ), and Scherb and Zech ( Citation 10 ) required either specially designed test equipment and protocols or the use of full complement bearings to achieve smearing.
In the present study, generation of smearing damage on ground bearings was only achieved using a special two-part test protocol. Part 1 (t = 0 to 40 min) had an oscillating radial load direction that alternated between 12 o’clock and 6 o’clock twice per minute according to a square wave function. Part 2 (t = 40 to 100 min) held a steady, nominally “zero” load level, with a small imposed load to compensate for tooling and bearing weight.
summarizes the test conditions, including a mathematical description of the square wave function that utilizes a “floor function” in the exponent to switch the sign of load direction as a function of time. The applied radial load Fr = ±17.8 kN in part 1 corresponded to ∼1.5% of the C1 dynamic load rating for the bearing. The corresponding maximum contact pressure at the roller–inner raceway contact was ∼711 MPa and the maximum contact pressure at the roller–outer raceway contact was ∼623 MPa. For each test cycle, part 1 was performed and then immediately followed by part 2. The test rig tooling was disassembled and the inner ring raceway was inspected for smearing damage after each test cycle. If smearing was observed, the test was stopped. If smearing was not detected, the test rig was reassembled and another test cycle was started. If no smearing was detected after three cycles, the test was suspended. Three replicate tests were performed per bearing treatment, each with a different test bearing. The first cycle of each test was initiated with a new test bearing, and the test bearings were not run-in prior to starting each test.
The test lubricant was SAE 20 viscosity-grade polyalphaolefin base oil with rust and oxidation inhibitor additives only and no extreme pressure or antiwear additives. Samples of the new oil and the oil recovered after the completed run of smearing tests were evaluated for common physical property and chemical composition changes that may have occurred during testing. Density, kinematic viscosity, total acid number, and water results are given in . Fourier transform infrared spectroscopy measurements from the pre- and posttest measurements indicated that the used oil had the same spectrum as the new, with only the emergence of a small additional peak at ∼1740 cm−1 that indicates mild oxidation. Likewise, elemental analysis indicated that oil composition did not change appreciably during the test program. With all characterization data considered, the test oil experienced only minor oxidative wear during the entire smearing test program as expected. Any potential influences of test oil degradation on the smearing test results were neglected in the results analysis.
Table 3 Smearing Test Parameters
Table 4 Pre- and Postsmearing Test Lubricant Data for the SAE 20 PAO Test Oil
Fig. 3 (a) Cage speed and (b) torque data versus radial load for the first 3 min of the CRB smearing test 1, cycle 1 of 1 for the ground treatment. Load direction is indicated by the sign (+ or −), alternating between 12 and 6 o’clock load zone locations.
Scanning electron microscopy (SEM) analysis of smearing damaged areas on the inner ring raceways was performed with an Amray 3300 SEM in secondary electron mode with a 20 kV beam. To prepare samples for examination by optical metallography, sections from test rings were cut through the smear marks in both longitudinal and transverse planes. These samples were mounted, polished, and lightly etched with a Nital solution to allow for examination of surface/smear mark microstructural abnormalities or heat-affected zones using optical microscopy.
RESULTS AND DISCUSSION
Smearing Test Results
Smearing was accomplished by creating severe roller–raceway sliding conditions via load direction reversal. To illustrate the impact of load direction reversal on bearing dynamics, measured cage speed and torque were plotted for the first 3 min of test 1 using a ground bearing in . shows that during the period of load direction change, the cage speed dropped significantly from the theoretical speed of ∼79 rad/s (∼750 rpm) for a pure rolling condition. This drop, or cage slip, indicates an accompanying reduction in the roller orbital velocity and therefore a gross slip condition between the rollers and the raceways. For example, indicates that the cage speed dropped to as low as ∼18 rad/s (∼170 rpm) during an initial load zone direction change. Bearing kinematic relationships can be used to provide quick estimates of the roller–inner raceway SRR for the cage slip condition if one assumes pure rolling contact between the roller bodies and outer ring raceway. For a cage rotating frame of reference, the lubricant entrainment speeds between the roller–inner raceway uent,i and roller–outer raceway uent,o can be shown to be
where ω i is the inner raceway rotational speed, ω c is the cage speed, ω r is the roller rotational speed about its own axis, ri is the inner raceway radius, ro is the outer raceway radius, and r is the roller radius. The expressions describing slip Δu at the inner and outer raceway contacts, respectively, are
If pure rolling is a constraint at the roller–outer raceway contact, then Δuo = 0, and the following expression is true:
Using this approach, SRRi (expressed as a percentage) is calculated to be ∼149% when the measured cage speed ω c drops to ∼18 rad/s (∼170 rpm) during the load direction transition period as shown in . This estimate represents a minimum because the assumption of pure rolling between the outer ring raceway and the roller bodies during the period of significant cage slip is most likely false. Instead, the roller rotational speed ω r is probably slower than this simple calculation predicts, giving an even higher SRR between the roller bodies and the raceway to be overcome upon reengaging contact after the load direction change. The consequence of these large measured cage slip levels is that SRR > ∼149% must be overcome between the raceways and roller bodies as the cage speed accelerates rapidly back to the level expected for pure rolling under load. Both the test rig and test bearing experience torque instabilities during each load direction transition as well, as shown in .
Fig. 4 Example CRB smearing test data for the complete 100-min test duration for (a) ground, cage speed; (b) ground, torque; (c) WC/a-C:H, cage speed; and (d) WC/a-C:H, torque. Plots are labeled with the specific test and cycle designations.
Cage speed and torque data for the complete 100-min tests are shown in and for a ground bearing test and and for a WC/a-C:H test. Two cage speed trends distinguish the ground from the WC/a-C:H bearings. The minimum cage speed during load direction transition events increased more rapidly with increasing test time during part 1 for the ground case than it did for the WC/a-C:H case. Secondly, the cage speed stayed closer to the nominal ∼79 rad/s (∼750 rpm) level for pure rolling during the part 2 zero load case for the ground case, whereas it remained much lower indicating gross slip for the WC/a-C:H case. The cage speed trends for the WC/a-C:H bearings were generally consistent with the ES20 and black oxide cases that also had superfinished rollers with Ra ∼ 46 nm and honed raceways with Ra ∼ 125 nm (). By comparison, the higher roughness of the ground bearings with roller Ra ∼ 160 nm and raceway Ra ∼ 340 nm appeared to help maintain traction and resist cage slip, especially during the part 2 zero load condition. The torque performance of all bearing treatments followed the same general trends and converged to ∼20 N*m in part 2 of each test cycle. Test bearing housing vibration and temperature data were recorded during each test cycle as well but did not distinguish between bearing surface treatments or indicate the initiation of smearing damage. Fine particulate brass debris from cage wear were found at the conclusion of each test cycle around the test bearing cage and the oil drain. No evidence linking the presence of brass debris to bearing raceway damage was found.
Fig. 5 Smearing test results for various bearing surface treatments. Each of the first three treatments had visible smearing damage after the first test cycle, whereas the WC/a-C:H treatment had no smearing damage in any tests.
Fig. 6 Smear marks are denoted by arrows for (a) ground, (b) ES20, and (c) black oxide; (d) WC/a-C:H had a polished surface with no smear marks (color figure available online).
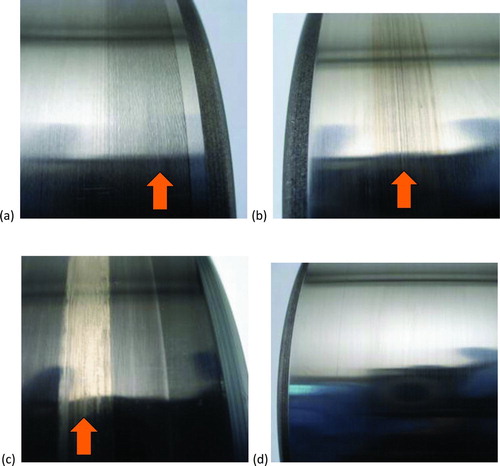
shows the results of the smearing tests. There was no variation in results within a treatment for each of the (three) replicate tests. That is, all of the ground tests were concluded after one cycle when smearing was observed, whereas all of the WC/a-C:H tests were suspended after three cycles with no smearing detected. When smearing was detected, the damage was located most prominently on the inner ring raceway.
to shows photographs of example inner ring smearing damage. Closer inspection indicated that each smear mark had a distinct length, but overlapping smear marks in the same location give the appearance of a smear band that wraps around the entire circumference of the inner ring. The rollers also indicated some smear banding to various degrees, with the location of the bands aligned with the inner raceway damage for the smeared bearings. Each roller had the same wear pattern within a bearing, and there was no variation in roller body wear from roller to roller. The black oxide surface treatment appeared to experience mild to severe wear across the inner ring raceway and roller body surfaces. This black oxide polishing was evident also in the posttest inner ring raceway roughness measurements in , where the average pretest black oxide inner ring Ra dropped from ∼124 to ∼92 nm. In contrast, the WC/a-C:H roller coating exhibited expected visual mild polishing wear in irregular thin bands around the roller body for the WC/a-C:H tests but with no coating delamination or loss of coating thickness as measured by X-ray fluorescence spectroscopy. The WC/a-C:H coating polished the honed inner ring raceways from an initial average Ra ∼ 115 nm to ∼99 nm after the test (); however, there was scatter in the measurement results for the posttest WC/a-C:H that weakened this distinction from before/after roughness. Although the approximate average magnitude of inner ring Ra reduction was similar for the black oxide and WC/a-C:H cases, the polishing mechanism was different. Inner ring Ra reduction in the black oxide case was attributed to visible loss of the black oxide surface layer thickness. On the other hand, the WC/a-C:H roller hard coating (∼11–12 GPa hardness for the coating vs. ∼8 GPa hardness for the raceway) gently polished the untreated inner ring raceway texture to the lower level. A similar reduction in inner ring Ra due to testing was not observed for the ES20 case without the presence of WC/a-C:H roller body coatings. As expected, the ground bearings started with a higher inner ring raceway Ra and were polished ∼80 nm on average during the single test cycle in which smearing occurred due to run-in.
Evaluation of the Smeared Inner Rings
The severity of smearing damage on the inner ring raceways was quantified by measuring the total smeared area as a percentage of total raceway area as shown in . The most severe smearing was observed for the ES20 treatment on average, whereas no smearing damage was observed on the bearings with WC/a-C:H treatment after three test cycles.
Fig. 7 Average smear damage area as a percentage of total inner ring raceway area for the three tests per treatment. Error bars represent plus or minus one standard deviation.
The tested inner ring raceways were inspected both inside and outside of the smear marks at higher magnification using SEM. Each of the images from the samples in was collected at the same magnification. Smearing for the ground bearings consisted of flattening and mild plastic flow of grind line asperity tips as shown in and . Smearing damage for the ES20 and black oxide cases in to show an additional component of adhesive wear, with the appearance of surface tearing or disruption and subsequent smashing or flattening of the removed material. Closer inspection of the severe smear areas for these examples in and revealed the formation of many small surface cracks that had the potential of initiating larger spalls with continued bearing operation. The tested inner ring raceway from the WC/a-C:H bearings in resembled a polished version of the ES20 raceway from a nonsmeared area in . In addition to promoting mild raceway polishing, the WC/a-C:H bearing roller coating was both durable and compositionally dissimilar to the inner ring raceway, thus defeating the adhesive component of the smearing mechanism in contrast with the ES20 and black oxide examples.
Fig. 8 SEM images from smear-tested inner rings for (a) ground, nonsmeared area; (b) ground, inside a smear mark; (c) ES20, nonsmeared area; (d) ES20, inside a smear mark; (e) black oxide, nonsmeared area; (f) black oxide, inside a smear mark; and (g) WC/a-C:H general area (no smear marks).
A test inner ring from each of the surface treatment types was sectioned through the smear damage mark for evaluation by optical metallography, with examples for ground and ES20 bearings shown in and , respectively. Surface hardness checks were made on a location from the inner ring end face, and it was confirmed that each ring measured 59–60 HRC, in agreement with specifications. Each smear mark was sectioned and mounted/observed along two planes, the transverse and longitudinal. The transverse plane sliced through the smear mark such that the rolling direction (circumferential direction with respect to the ring) is across the horizon of the image. The longitudinal plane was parallel to the axis of the ring, and so the rolling direction was normal to the image (into the page). The etched bulk microstructure for each ring had the expected appearance of tempered martensite with dispersed carbides, which had the appearance of white particles in the images. The near-surface microstructure in the smear damage scars was quite different, however, depending on the severity of the smearing. shows that no substantial surface microstructural damage was done in the ground surface as a result of smearing. This is consistent with the SEM results of and for the ground bearings, which only showed superficial plastic flow and asperity flattening within the smeared region. for the ES20 sample shows clear evidence of adhesive wear as observed in plan-view in the SEM results of to . The nearest surface material was converted to a white etching material, and dark etching below that white etch material indicates tempering due to exposure to high local temperatures. This white, etch-resistant layer with a darker etching region immediately below was observed by Cocks and Tallian ( Citation 3 ) as well in scuffing experiments under areas that experienced severe damage. The smeared surface regions were also markedly rougher on this length scale, as evidence of the patches of missing surface material that were transferred to the mating surface by adhesive wear. The microstructure analysis results for the black oxide case were nearly identical to those for the ES20 samples (). In agreement with the SEM results, the WC/a-C:H sample did not exhibit any evidence of adhesive wear or smearing damage, with microstructure images similar to those for the ground case ().
Fig. 9 Optical micrographs (1,000×) of mounted, polished, and Nital-etched metallographic sections through the smear mark on a ground inner raceway: (a) transverse section, rolling direction across horizon, and (b) longitudinal section, rolling direction normal to plane of image.
Fig. 10 Optical micrographs (1,000×) of mounted, polished, and Nital-etched metallographic sections through the smear mark on an ES20 inner raceway: (a) transverse section, rolling direction across horizon, and (b) longitudinal section, rolling direction normal to plane of image.
Comparison with Simulation
Experimental cage slip and simple kinematic calculations indicated that a high SRR between the roller bodies and raceways occurred during load direction shift events. Details about these high SRR conditions that are concurrent with smearing damage were explored in greater detail with CAGEDYN (Houpert ( Citation 13 )–( Citation 15 )) bearing dynamics simulations. In particular, the idea of calculating a single smearing risk factor or criterion using a dynamic simulation tool was tested. The criterion selected for study was Φ = μ·P max·Δu, which has the same general form as Dyson's ( Citation 5 )friction power intensity. Admittedly, assessment of smearing risk using a single criterion such as represents a simplified approach because the effects of additives, material properties, and coating properties are not considered directly in most dynamic simulation codes. However, the relative ease of evaluating all three parameters μ, Pmax, Δu for roller–raceway contacts at short time steps using a program such as CAGEDYN, with all assumptions recognized, makes the application of the Φ criterion desirable.
CAGEDYN simulations of the successful smearing test experimental conditions were conducted to explore individual bearing component motions and instantaneous conditions that may contribute to smearing damage. The model input conditions were selected to represent the experimental test conditions as well as possible, including the bearing component geometries, applied radial load direction shifting with Fr = ±17.8 kN (assuming ∼1 s transition times), SAE 20 test oil viscosity characteristics, test temperature ∼37.8°C, and ω i = 188.5 rad/s (1,800 rpm). shows the simulated cage speed ω c, sim. plotted versus time, including the 1-s period during which the radial load changes direction. Note that Qo , which indicates the contact load between a single simulated roller and the outer raceway, is plotted using the second y-axis to indicate the frequency of bearing revolutions. The experimentally measured cage speed for steady operation under load during the smearing tests was ω c, expt. ∼ 79 rad/s (∼750 rpm). The cage speed simulation result ω c, sim. ∼ 67 rad/s agrees to within ∼15% of the experimental. As the applied load direction on the bearing was shifted, the bearing completed several revolutions in an unloaded state as represented by the simulated time period ∼1.3–1.9 s (). As observed during the actual smearing experiments, the simulated cage speed decreased during this unloaded period to a level of ω c, sim. ∼ 22 rad/s, which is within ∼20% of the experimentally observed value ω c, expt. ∼ 18 rad/s.
Fig. 11 CAGEDYN dynamic simulation of the smearing test conditions before, during, and after a load direction reversal event. Simulated cage speed ω c ,sim. (solid line) and a single roller–outer ring contact load Qo (dashed line) are plotted versus time.
Fig. 12 CAGEDYN dynamic simulation of the smearing test conditions before, during, and after a load direction reversal event. Simulated roller SRR at the inner ring raceway (black solid line) and outer ring raceway (gray solid line) and a single roller–outer ring contact load Qo (dashed line) are plotted versus time.
Fig. 13 CAGEDYN dynamic simulation of the smearing test conditions before, during, and after a load direction reversal event. Simulated smearing criterion Φ values for the roller–inner ring raceway contact (black solid line) and roller–outer ring raceway contact (gray solid line) are plotted versus time.
Fig. 14 CAGEDYN dynamic simulation of the smearing test conditions upon load reengagement after a load direction reversal event. Simulated smearing criterion Φ values for the roller–inner ring raceway contact (black solid line) and roller–outer ring raceway contact (gray solid line) are plotted along with a single roller–outer ring contact load Qo (dashed line) versus time.
With the confidence of good accuracy between the experimentally measured and CAGEDYN-simulated cage speeds, other simulation results were explored in more detail. For example, another simulation output was the roller rotational speed about its own axis, ω r . Knowing the roller orbital speed and ω r , entrainment and sliding speeds can be calculated. gives the simulated SRR between a roller and the inner and outer raceways. The calculated inner ring contact SRR was higher than the outer ring contact SRR, and their values approached ∼200%. As expected, this was in excess of the ∼149% SRR from the simple kinematic calculations made using experimental cage slip data, which assumed pure rolling at the roller–outer ring contacts. However, directionally the agreement is encouraging and provides additional insight into the actual slip magnitudes that occur upon reengagement of the load zone after a directional shift.
and show the simulated smearing criterion Φ for a single roller as a function of time, with a zoom view conducted during the period of roller–raceway reengagement as the load moved from a negative to positive value (shown in ). Φ reached a maximum as the roller entered the load zone, with a larger simulated value for the inner raceway–roller contact than for the outer raceway. This was consistent with experimental observations that the smearing damage was located predominantly on the inner ring raceway. The fact that the highest Φ values were calculated as the roller entered the load zone after a load direction shift also lends credibility to its potential as a predictive parameter going forward because it is consistent with experimental observations and expectations from the literature. It was also apparent that the Φ ∼ 1.5 × 10⁸ W·m−2 threshold value for smearing as observed from calculations using Nelias's ( Citation 7 ) data did not apply to CRBs. CAGEDYN simulations indicated that although high degrees of sliding are possible in CRBs, these SRR conditions are transient and not necessarily comparable with the steady, sustained sliding conditions typically studied using disk-on-disk tests. Taking into account the CAGEDYN calculation results for all rollers in the bearing, the maximum Φ exceeded 2.6 × 10⁸ W·m−2 for the successful experimental smearing test conditions described in this report.
CONCLUSIONS
| • | High-slip conditions sufficient to produce smearing damage were achieved in CRBs using a two-part test with a period of repetitive load direction reversals (load ∼1.5% of the C1 dynamic load rating) followed by steady operation at a nominal zero-load condition. | ||||
| • | Bearings featuring the WC/a-C:H roller body coatings (Timken ES302) were the only treatment that prevented smearing in these tests. | ||||
| • | Black oxide treatment did not provide additional smearing protection over the vibratory superfinished-only (Timken ES20) case that had similar raceway and roller body roughness in these tests. | ||||
| • | Surface finish and roughness specifications must be carefully considered in applications that are susceptible to smearing. The damage severity for vibratory superfinished and black oxide treatments with smooth raceways was higher than that for ground bearings with rough raceways, with evidence of adhesive wear in addition to superficial plastic flow of asperities in the smear marks. On the other hand, superior smearing protection was achieved with smooth raceways in conjunction with WC/a-C:H roller coating technology. In practice, each application should be analyzed on a case-by-case basis. | ||||
| • | CAGEDYN-simulated smearing criterion values (similar to friction power intensity concepts) corresponding to the experimental smearing conditions were higher than those calculated for scuffing in disk-on-disk testing reported in the literature. However, promising agreement was found between CAGEDYN simulation results and other test features, thereby increasing optimism about the use of dynamic modeling to predict smearing criteria and risk in the future. | ||||
ACKNOWLEDGEMENTS
The authors acknowledge The Timken Company for supporting this work and permission to publish. D. R. Lucas, J. H. Rhodes, G. L. Doll, and M. N. Kotzalas from Timken are thanked for their support and contributions. T. M. Guess is acknowledged for performing the rig tests and J. S. Hypes for rig tooling design. R. A. Pendergrass is thanked for SEM analysis, and M. Petraroli is thanked for optical metallography sample preparation and microscopy.
REFERENCES
- Musial , W. , Butterfield , S. and McNiff , B. 2007 . “ Improving Wind Turbine Gearbox Reliability ” . In 2007 European Wind Energy Conference Milan , , Italy 7–10 May, 2007. Available at http://www.osti.gov/bridge
- Rowe , F. D. 1971 . Diagnosis of Rolling Contact Bearing Damage . Tribology , 4 : 137 – 149 .
- Cocks , M. and Tallian , T. E. 1971 . Sliding Contacts in Rolling Bearings . ASLE Transactions , 14 : 32 – 40 .
- Torrance , A. A. and Cameron , A. 1974 . Surface Transformations in Scuffing . Wear , 28 : 299 – 311 .
- Dyson , A. 1975 . Scuffing—A Review . Tribology International , 8 ( 2 ) : 77 – 87 .
- Bujoreanu , C. , Creţu , S. and Nelias , D. 2003 . “ Scuffing Behavior in Angular Contact Ball-Bearings ” . In Annals of University “Dunarea de Jos” of Galati Fascicle VIII, Tribology 33 – 39 .
- Nelias , D. 1997 . Etude Experimentale et Theorique du Micro Grippage dans les Contacts Elastohydrodynamiques [Experimental and Theoretical Study of Scuffing in Elastohydrodynamic Contacts] . Revue Générale De Thermique , 36 : 26 – 39 .
- Hamer , J. C. , Sayles , R. S. and Ioannides , E. 1991 . An Experimental Investigation into the Boundaries of Smearing Failure in Roller Bearings . Journal of Tribology , 113 : 102 – 109 .
- Pihlstrom , L. and Strom , E. 1998 . Smearing Protection and Smearing Physics , Goteborg , , Sweden : Master's Thesis, Chalmers University of Technology .
- Scherb , B. J. and Zech , J. 2001 . A Study on the Smearing and Slip Behavior of Radial Cylindrical Roller Bearings . Georg Simon Ohm Series, University of Applied Sciences Nuremberg ,
- Miailidis , A. , Salpistis , C. , Panagiotidis , K. , Sachanas , C. , Gatsios , S. , Hoffinger , C. and Bakolas , V. 2010 . Wear and Smearing Resistance of Black Iron Mixed Oxide Coated Steels . International Journal of Surface Science and Engineering , 4 ( 4–6 ) : 337 – 359 .
- Doll , G. L. and Evans , R. D. 2010 . “ Solving Wind Turbine Tribological Issues with Materials Science ” . In Materials Science and Technology (MS&T) 2010 Proceedings, Materials Science and Technology 2010 Houston , TX October 17–21
- Houpert , L. 2009 . CAGEDYN: A Contribution to Roller Bearing Dynamic Calculations Part I: Basic Tribology Concepts . Tribology Transactions , 53 ( 1 ) : 1 – 9 .
- Houpert , L. 2009 . CAGEDYN: A Contribution to Roller Bearing Dynamic Calculations Part II: Description of the Numerical Tool and Its Outputs . Tribology Transactions , 53 ( 1 ) : 10 – 21 .
- Houpert , L. 2010 . CAGEDYN: A Contribution to Roller Bearing Dynamic Calculations. Part III: Experimental Validation . Tribology Transactions , 53 ( 6 ) : 848 – 859 .
- Hashimoto , F. , Melkote , S. N. , Singh , R. and Kalil , R. 2009 . Effect of Finishing Methods on Surface Characteristics and Performance of Precision Components in Rolling/Sliding Contact . International Journal of Machining and Machinability of Materials , 6 ( 1–2 ) : 3 – 15 .