
 ?Mathematical formulae have been encoded as MathML and are displayed in this HTML version using MathJax in order to improve their display. Uncheck the box to turn MathJax off. This feature requires Javascript. Click on a formula to zoom.
Abstract
Lifetime prediction of polymer–polymer contacts is a major challenge. Current design methods stemming from metal contact surfaces lack accuracy because polymers behave differently, especially regarding temperature variations. Experiments were performed on a pin-on-disk setup alternating static and rotating elements. Common unfilled engineering polymers, viz. polyoxymethylene (POM), polypropylene (PP), polyamide 6.6 (PA6.6), and polycarbonate (PC) were tested at ambient and elevated temperatures. Material combinations were analyzed regarding the effects of load, velocity, temperature, and the product of contact pressure and sliding velocity (PV limit). The experimental results show that the PV limit is not predictive for polymer–polymer contacts; rather, each material combination has a critical factor that determines the wear and frictional values and thus the contact’s durability and lifetime. The critical factor is the value of contact pressure or sliding velocity or temperature at which there is sudden increase in wear rate. The experimental results also demonstrate that the application temperature in operation has an important influence on the lifetime. A temperature increase can either be beneficial or have a negative impact depending on the material combination. Resulting from the extensive experimental analysis, a new design method, based on the principle of deformation energy, is proposed. The new model is different from existing models because it includes thermal properties of the materials in contact and it makes use of the Péclet number. Because the proposed model requires only data sheet values and design parameters to predict wear volume, the model improves the support of engineers in designing durable polymer–polymer sliding contacts.
Introduction
For the design of products and systems with moving parts, the design of contacts in relative motion has a particular focus with respect to the (relative) accuracy of the moving parts and the product lifetime. The type of contact is important for the design; for example, sliding contacts have good damping properties and high stiffness, whereas rolling contacts have lower friction and stiction (Engel, et al. (Citation1)). Friction and wear behaviors of the materials in the contact region have a great influence on the performance.
Design methods for designing sliding contacts, which are commonly used in industry and taught in academia, are developed for metal–metal contacts or for the case where at least one metallic material is involved in the contact region (Van Beek (Citation2)). Having metal present in the contact region has a large influence on the performance, due to its relatively high thermal conductance. Therefore, the local peak temperature within the contact region is relatively low compared to situations in which less conductive materials, such as polymers, would be used. On the other hand, the reduction in residual vibrations is often an important aspect in the case of metal–metal contacts (Heisel and Klotz (Citation3)).
Polymers and engineering plastics are increasingly used in functional parts because they are easy to produce, lighter compared to metals, and possess other advantageous properties such as corrosion resistance and good electric and heat insulation. Finally, they can be produced in high volumes at a relatively low cost when injection molded, making them ideal for many applications, such as consumer products and household appliances and in the automotive industry. From a design and cost perspective, it is beneficial to integrate the sliding contact functionality directly into the part rather than having to assemble and align a separate bearing system later on during product assembly. However, designing a long-lasting polymer–polymer sliding contact is very challenging for design engineers because the parameters that influence the polymer sliding contacts are hard to predict. In 2009, Azeem Ashraf, et al. (Citation4) presented a numerical simulation to predict wear for a polymer–polymer sliding surface contact in dry conditions. However, their model requires averaged wear rates from experimental work, for which one material combination was examined.
Commonly, sliding contacts are designed based on experience, catalogs, and generic scientific data. These sources do not give comprehensive data for design, because the application conditions are usually different from the experimental testing conditions (De Baets, et al. (Citation5)). Commonly the product of contact pressure and sliding velocity (i.e., the PV limit) is used as a limiting factor. Sliding contacts that operate above the PV limit are prone to severe wear rates. Because the limit values are obtained experimentally and therefore subject to a prescribed set of testing conditions, extrapolation of these critical values may easily result in faulty designs (Lancaster (Citation6)). In this article, a new design method is presented for polymer–polymer sliding contacts, in which the material combination and heat effect are taken into account.
The outline of the article is as follows. First, common design methods for sliding contacts are discussed, setting the foundation of this work. Then, to improve the understanding of how polymer–polymer sliding contacts behave, the extensive experimental work that has been conducted is described. The experimental results in terms of friction and wear behavior are presented, after which the results are discussed, focusing on the effects of load, velocity, temperature, and the PV limit. Subsequently, the essence of this article is presented—a design method for polymer–polymer sliding contacts—and, finally, the conclusions of this article are summarized.
Common design methods for sliding contacts
Design methods for sliding contacts typically follow a stepwise procedure. In current approaches, the contact pressure is usually determined based on the geometry of the contact using Hertz equations (Mermoz, et al. (Citation7)). Thereafter, using the application conditions, the PV value is computed. The PV value is then used to preselect a set of material combinations by remaining below the critical PV limit as recommended by suppliers’ data sheets. Subsequently, the wear rate of the contact is predicted. A number of wear models are currently available (Van Beek (Citation2)), all of which use empirical wear factors from suppliers’ data sheets. The first empirical wear model was proposed by Archard (Citation8) in 1953 taking normal load, sliding distance, and the hardness of the softest material in contact into account. This model was thereafter further developed by Ratner, et al. (Citation9) and Lewis (Citation10) in 1964 into the following general form:
[1]
[1]
where V is the wear volume, k is the wear rate factor, FN is the normal load, v is the velocity, and t is the sliding time.
The wear rate factor k in EquationEq. [1][1]
[1] , defined as wear volume per unit load per unit sliding distance, is taken from suppliers’ data sheets and is based on empirical data. Based on this wear rate and the PV value, a redesign or a change in material combination can be considered to better suit the application and hence iteratively optimize the design. This approach works well for metal–metal and polymer–metal contacts, due the good availability of data sheets and empirical data. However, for polymer–polymer contacts, these data is not readily available or easily utilized with current empirical models.
For nonmetal contacts, utilizing the PV limit to design the sliding contact does not work effectively because the PV limit is related to the critical surface temperature (Chaudri, et al. (Citation11)). Because polymers have very different material properties with respect to thermal conductance and capacity, frictional heating plays an imperative role in the material behavior, which in turn plays a role in the wear and friction values.
Experimental methods and materials
To gather extensive behavioral data on polymer–polymer sliding contacts, tribotests have been carried out in which the contact was subjected to changes in load and velocity. The friction and wear behaviors of a number of materials were determined experimentally.
Tribotests were conducted using a pin-on-disk tribosystem, in which a stationary pin is pressed against a rotating disk. The equipment was placed in a temperature- and humidity-controlled environment. The equipment measured the frictional force through the generated torque using a flexure mechanism, as shown in . A specific normal load and sliding velocity were set as input variables, and the coefficient of friction, μ, was determined experimentally. A friction force acquisition rate of five readings per second (i.e., 5 Hz) was chosen because higher rates, producing larger data files, resulted in minute differences (less than 0.1%). Raw measurement data were processed by computing a statistical mean and standard deviation, and the coefficient of friction was plotted against time.
Figure 1. Pin-on-disk tribosystem used for experimental validation: (a) closeup of the setup and (b) system with a climate box.
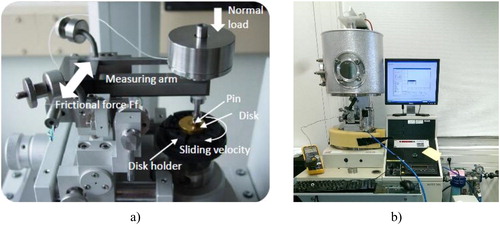
Through a design of experiments, a range of input settings was tested, as well as different material combinations. Most important, the individual contributions of load and velocity were assessed. Two material combinations were also measured at an elevated ambient temperature using a heated climate box (see ) to understand how these material combinations behave at higher temperatures.
The selected materials were polyoxymethylene (POM), polypropylene (PP), polyamide 6.6 (PA6.6), and polycarbonate (PC). These materials are common engineering polymers that are widely used in consumer and automotive products (Gedde (Citation12); Sinha and Briscoe (Citation13)). POM is a semicrystalline polymer used for precision parts requiring high stiffness and low friction. PP is also a semicrystalline polymer known for its thermal stability and strength. PA6.6 is a semicrystalline polymer, commonly known as nylon, and is used for its good mechanical and chemical properties. Finally, PC is an amorphous polymer that is widely used, known for withstanding high temperatures and for its impact resistance due to its toughness. The tested material combinations are listed in and their properties are listed in .
Table 1. Tested material combinations and input settings.
Table 2. Material properties of materials used for testing.
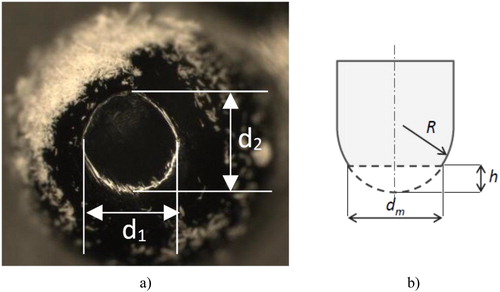
Pins and disks used for tribotesting were injection molded in-house. The pin geometry was ball shaped and had a diameter of 3 mm and the disk was rectangular shaped with dimensions of 40 × 30 mm2. The wear rate of the pin was determined by measuring the diameter of the worn-out pin using a toolmaker’s microscope. Based on the known pin geometry, the wear volume was computed. This approach is shown in ; shows an image of a worn-out pin and illustrates the geometric relations. The wear volume can be computed as
[2]
[2]
with
[3]
[3]
[4]
[4]
where h is worn-out height, d is the measured pin diameter at the worn-out location (see ), and R is the original radius of the pin.
Figure 2. Pin wear analysis using a toolmaker’s microscope: (a) photograph of a worn-out pin and (b) geometric relations for a ball-shaped pin.
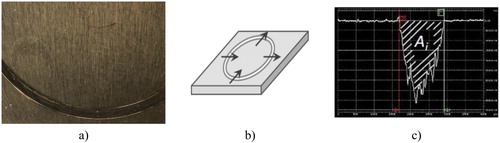
To determine the wear rate of the disks, the profile of the wear track was measured at four different locations using a surface profilometer. describes this approach. shows the wear track, shows the four measurement locations, and the results of one surface profile measurement are shown in . The four measurements were averaged to compute the wear volume of the disk as
[5]
[5]
with
[6]
[6]
[6]
where A is the cross section of the wear track (see ) and d is the wear track diameter.
Figure 3. Disk wear analysis using a profilometer: (a) photograph of the wear track in PA6.6, (b) measurement points, and (c) surface profile result.
Measurements of the wear volume of both the pin and disk were performed at regular time intervals, typically every 20 min, during the experiments. Following EquationEq. [1][1]
[1] , the wear rate factor of both parts was determined:
[7]
[7]
[8]
[8]
Finally, the total wear rate factor of the material combination is determined by the sum of both,
[9]
[9]
For both the normal load and sliding velocity, two settings were used, namely, 1 and 5 N and 0.2 and 0.5 m/s, respectively. These values are commonly used in tribotests for, for example consumer electronics, automotive mirrors, and automotive sunroofs and in the toy industry. In fact, the load settings correspond to initial contact pressures of 63.3 and 108.3 MPa, respectively, which is fairly high for consumer products. The load and velocity settings also corresponded with typical minimum and maximum values that are used in the consumer products’ tribology laboratory of the authors’ team. For the remainder of this article, these values are indicated as low load (LL), high load (HL), low velocity (LV), and high velocity (HV), respectively. For each setting, three measurements were conducted, in which a new pin and a new disk were used, to increase the reliability of the empirical data. All material combinations were measured at ambient temperature (21 °C). The material combinations of POM-PP and PC-PA6.6 were also tested at an elevated temperature of 40 °C. This temperature was chosen relative to the glass transition temperature of PA6.6, which is between 45 and 50 °C.
Experimental results
Frictional behavior
During the tribotests, the coefficient of friction was continuously measured with a frequency of 5 Hz. The time evolution of the friction values shows how the materials in contact behave during the lifetime. The results differ per material combination and are discussed one by one. All presented results are an average of three complete measurements per material combination.
For POM and PP as material pair, shows the complete set of results for a static POM pin rotating against a PP disk. Each graph presents three data sets that correspond with three measurement trials. The statistical mean is given by the dashed line, including error bars that indicate the standard deviation of the measurements. In all cases, a period of running in was observed during which the frictional values first increased and the reduced with time after a peak value was reached. In , POM-PP is compared as a material pair at ambient temperature. actually integrates the results of by showing the four statistical means in one graph. The standard deviation had a similar range for all measurements and is further omitted for clarity. The running-in phenomenon was visible for all loads and velocity settings.
Figure 4. Results for POM (pin) and PP (disk) at room temperature: (a) LL and LV, (b) LL and HV, (c) HL and LV, and (d) HL and HV.
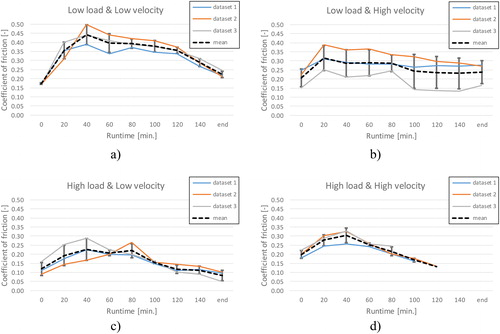
Figure 5. Time evolution of the coefficient of friction for POM-PP as a material pair: (a) POM pin and PP disk and (b) PP pin and POM disk.
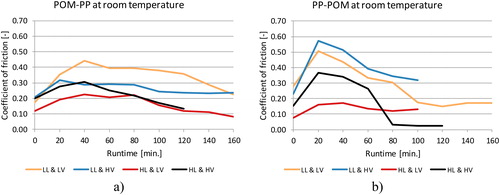
When POM was the static element sliding against a rotating PP disk (see ), at LL and LV the coefficient of friction increased during the first 40 min up to 0.44. Thereafter it remained almost constant for 80 min at 0.39, before starting to decrease to 0.22 before failure. At LL and HV, the coefficient of friction slightly increased at the beginning and remained around 0.29 for 80 min, after which it decreased to 0.23. At HL and LV, the coefficient of friction was the lowest, with an average of 0.16 throughout the run time. At HL and HV, the coefficient of friction followed the LL and HV curve until it reached a peak value at 40 min. Thereafter it dropped to the level of the HL and LV curve until premature failure after 120 min.
When PP was the static element sliding against a rotating POM disk (see ), the period of running in was most pronounced and distinctively shorter in all cases. In this case, the coefficients of friction reached their peak values after roughly 20 min. At LL and LV, the coefficient of friction reached a peak value of 0.50 in 20 min and then decreased to a minimum value of 0.15 after 120 min. Thereafter it remained relatively constant at 0.17 until failure. By increasing the load (HL and LV), the coefficient of friction diminished with a peak value of 0.17 failing after 100 min. This was compared to increasing the velocity (LL and HV), in which case the peak value first increased to 0.57 and then decreased to 0.32. Failure in both cases was premature after 100 min. At HL and HV, the coefficient of friction followed a similar trend; however, it reduced to 0.026 before failing prematurely after 120 min.
One commonality for this material combination was that before failure, the coefficients of friction were on a downward trend. In addition, the average coefficient of friction for the lowest PV value (LL and LV) was about 1.5 times higher than the average coefficient of friction for the highest PV value (HL and HV).
compares PA6.6 and PC as a material pair at ambient temperature, similar to the previous POM-PP material pair. In general, PA6.6 as a static element exhibited higher frictional values compared to PC as a static element.
Figure 6. Time evolution of the coefficient of friction for PA6.6-PC as a material pair: (a) PA6.6 pin and PC disk and (b) PC pin and PA6.6 disk.
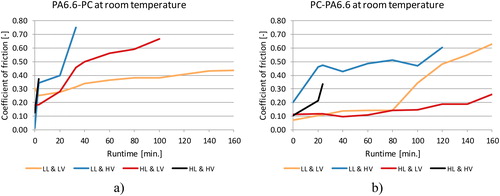
When PA6.6 was the static element sliding against a rotating PC disk (see ), at LL and LV the results showed a gradually increasing coefficient of friction from 0.30 to 0.43. Increasing the load (HL and LV) made the increase in coefficient of friction steeper from 0.18 to 0.67, failing prematurely after 100 min. Increasing the velocity (LL and HV) had a dramatic effect on the friction values; within 33 min the experiment was aborted due to high friction forces above a coefficient of friction of 0.75. Finally, at HL and HV, the PA6.6 pin failed after 3 min, showing excessive wear.
When PC was the static element sliding against a rotating PA6.6 disk (see ), at LL and LV the coefficient of friction remained relatively constant at 0.14 for 80 min. Thereafter the coefficient of friction increased almost linearly to about 0.63, after which the pin failed. Increasing the load (HL and LV) had very little effect on the friction value at first. Interestingly, after 80 min there was no significant increase in the coefficient of friction. However, when increasing the velocity (LL and HV), higher friction values were observed, similar to when PA6.6 was the static element, gradually increasing from 0.20 to 0.60, after which the pin failed prematurely. At HL and HV, the PC pin failed after 24 min.
When PC was the static element sliding against a rotating POM disk (see ), the friction values were comparable for all PV values and relatively constant between 0.22 and 0.33. However, as the load was increased (HL and LV), a sudden increase in friction values was observed just before failure after 140 min. This phenomenon was typical for all material combinations involving PC, which will be further elaborated upon in the Discussion section.
Figure 7. Time evolution of the coefficient of friction for a PC pin and POM disk.
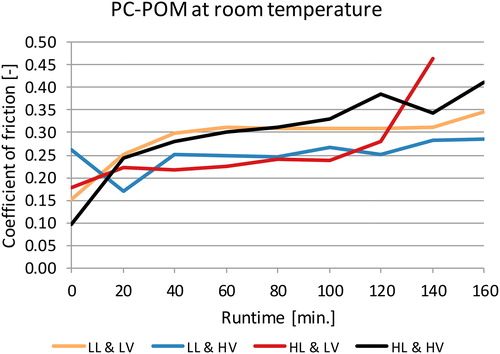
The average coefficients of friction that were measured at room temperature are listed in . It is interesting to note that in all cases, for a low PV value (LL and LV), the average coefficients were higher than those for a high PV value (HL and HV), except for the PC-POM case, in which case the coefficient actually remained fairly constant.
Table 3. Average coefficient of friction for tested material combinations at room temperature.
Wear behavior
Similar to the friction behavior, the wear behavior was also measured. However, as aforementioned, for polymer–polymer sliding contacts the relation between friction and wear is complex. Again, the material combinations are discussed one by one.
For POM and PP as the material pair, presents the results for both run time (min; line graph, left axis) and wear rates (m3/Nm; bar graph, right axis). Similar to the previous analysis of the friction behavior, the four load and velocity settings are presented. When POM was the static element sliding against a rotating PP disk (see ), the wear rates were relatively low and within one order of magnitude for all settings. At the lowest PV value, the wear rate was 9.9·10−15 m3/Nm running for 210 min. The wear rate reduced to 3.3·10−15 m3/Nm with a run time of 90 min for the highest PV value. When PP was the static element (see ), the wear rates were high for all settings and even unacceptable for functional components. At the lowest PV value, the wear rate was 4.8·10−14 m3/Nm, which reduced to 1.7·10−14 m3/Nm for the highest PV value. Similarly, the run time dropped from 150 to 120 min.
Figure 8. Run time and wear rate measurements for POM-PP as a material pair: (a) POM pin and PP disk and (b) PP pin and POM disk.
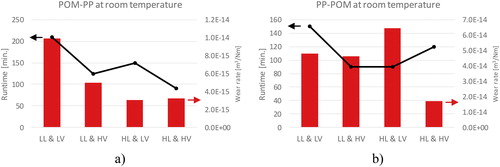
presents the run time and wear rates of PA6.6 and PC as the material pair at ambient temperature similar to the previous POM-PP material pair. When PA6.6 was the static element sliding against a rotating PC disk (see ), for either a higher load or velocity or a combination of both, wear rates were high and experiments failed quicker. At LL and LV, the material combination ran for 210 min with a wear rate as low as 1.7·10−16 m3/Nm. However, when increasing the load (HL and LV), failure was exhibited after 90 min with an increased wear rate of 5.6·10−15 m3/Nm. When increasing the velocity (LL and HV), the experiment failed even sooner (after 30 min), with a similar wear rate of 4.0·10−15 m3/Nm. At HL and HV, the conditions for this material pair were clearly unfitting. The experiment failed after 1.5 min with an excessive wear rate of 1.2·10−13 m3/Nm. Overall for this material combination, the run time appeared to be affected most by velocity.
Figure 9. Run time and wear rate measurements for PA6.6-PC as a material pair: (a) PA6.6 pin and PC disk and (b) PC pin and PA6.6 disk.
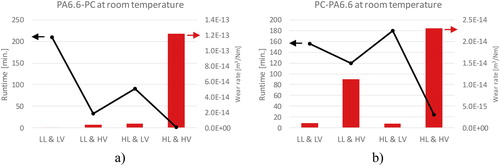
When PC was the static element sliding against a rotating PA6.6 disk (see ), at LL and LV the material combination failed prematurely after 155 min with a wear rate of 1.1·10−15 m3/Nm. By increasing the velocity (LL and HV), the run time was reduced to 120 min and the wear rate increased one order of magnitude to 1.1·10−14 m3/Nm. However, when the load was increased (HL and LV), the run time was actually prolonged to 180 min and the wear rate was reduced to 9.4·10−16 m3/Nm. This was the lowest wear rate for this material combination. At HL and HV, the wear rate surged to 2.3·10−14 m3/Nm and the experiment failed after 24 min.
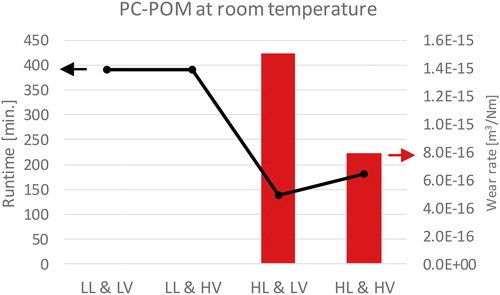
When PC was the static element sliding against a rotating POM disk at room temperature (see ), very different wear behavior was observed than for PC-PA6.6 as a material combination. At LL and LV, there was no observable wear, and increasing the velocity (LL and HV) had no effect on the wear rate or run time. In both cases, the run time was 390 min, after which the experiments were stopped manually. Increasing the load (HL and LV) reduced the run time by about 65% to 138 min. In this case, the wear rate increased to 1.5·10−15 m3/Nm. At HL and HV, this material combination exhibited the lowest wear rate of all tested combinations (7.9·10−16 m3/Nm), for a run time of 180 min.
Figure 10. Run time and wear rate measurements for a PC pin and POM disk.
Discussion
Effect of load
The experiments imply that for POM-PP combinations within the experimental range, the load had no significant impact on the friction behavior. In fact, the coefficient of friction reduced when the load was increased at LV. For PC-PA6.6 combinations when PC was the static element, the coefficient of friction was similar for LL and HL at LV. However, for PA6.6 as the static element, the coefficient of friction increased as the load was increased at LV. In addition, at LL and LV when PC was the static element, the coefficient of friction remained almost constant for 60 min, after which it suddenly increased. The latter phenomenon is likely due to an abrupt increase in temperature and subsequent material softening. Material combinations involving PC, an amorphous glassy polymer, have this tendency, as discussed by Briscoe and Sinha (Citation14).
At HV, PC-PA6.6 and PC-POM combinations showed an increase in the coefficient of friction when the load was increased; however, the opposite occurred for POM-PP. This reduction in the coefficient of friction is likely due to the formation of a thin transfer layer. Because POM and PP have different colors, the formation was visually observed during the experiments. In fact, this phenomenon is common for material combinations that involve POM, as shown by Odi-Owei and Schipper (Citation15) and Pogačnik and Kalin (Citation16). More generally, Bahadur (Citation17) discussed the development of transfer layers occurring from a polymer of low cohesive energy density to one of higher cohesive energy density.
For PC-PA6.6 at LV, as the load was increased the wear rate reduced. In addition, at HL, the material combination had a longer run time compared to that at LL. At HV, an increase in load resulted in a dramatic increase in the wear rate. For PA6.6-PC at LV and HV, as the load was increased the wear rate also increased and the run time was reduced. Because PA6.6 and PC have comparable hardnesses, the choice of static and rotating material has an impact on the wear rates. This demonstrates that for a sliding contact it is important to know which material is designed as the static and rotating element, respectively.
For POM-PP at both LV and HV, as the load was increased the wear rate also increased. For PP-POM at HV, the run time was higher at higher loads compared to that at lower loads. For PC-POM at LL, there was no observable wear. When the load was increased, the wear rate also increased and the run time was reduced by about 65%. Therefore, we can conclude that load is the critical factor for POM-PP and PC-POM combinations affecting the wear behavior of the contact.
Effect of velocity
For PC-PA6.6, within the experimental range, velocity is the critical factor for both friction and wear behavior. As the velocity was increased, the coefficient of friction increased dramatically, causing material failure. At HL and LV, PC-PA6.6 ran longer and had lower frictional values. When increasing the velocity, PC-PA6.6 failed within a few minutes due to enormous wear of the PC pin. Pogačnik and Kalin (Citation16) previously demonstrated that when materials of similar hardness slide against each other, the static element always wears out the most. This was also confirmed by all experiments in this study.
For POM-PP at both LL and HL, friction values increased as the velocity was increased. However, at LL the friction values were higher. This is likely due to the longer time it takes for the transfer layer to form. At HL conditions, ploughing of the softer PP material occurs faster and the transfer layer forms quicker, reducing frictional values. The wear of the softer PP was high and produced observable wear particles that resided within the sliding contact, causing the material to fail prematurely. For PP as static element, the wear rates were high for all load and velocity settings compared to other material combinations.
For PC-POM at LL, the velocity had little influence on the wear rate and friction values. Increasing the velocity at HL decreased the friction value by roughly 50%. No observable wear was detected even after running for 390 min. This shows that within the experimental range this material combination is highly wear resistant to changes in velocity.
Effect of ambient temperature
Elevating the temperature has an influence on the material properties of polymers. They tend to soften as the temperature increases and some polymers may even undergo phase transition. By comparing results at elevated temperature to results at ambient room temperature, it was concluded that the temperature had both positive and negative effects on friction and wear behavior, depending on the material combination, and on the load and velocity settings. In the time evolution of the coefficient of friction is presented for both the POM pin vs. PP disk combination as well as the PC pin vs. PA6.6 disk combination at elevated temperature. shows the run time and wear rates for the same material combinations at elevated temperature.
Figure 11. Time evolutions at elevated temperature: (a) POM pin and PP disk and (b) PC pin and PA6.6 disk.
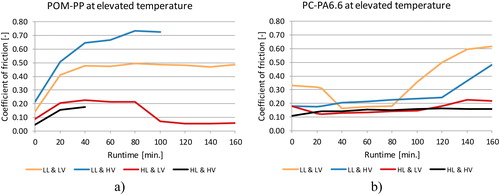
Figure 12. Run time and wear rate measurements at elevated temperature: (a) POM pin and PP disk and (b) PC pin and PA6.6 disk.
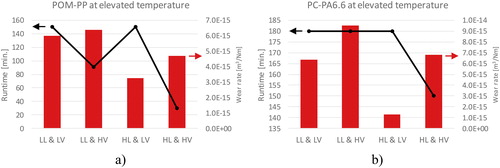
For POM-PP, comparing , increasing the temperature had both positive and negative effects on the friction and wear behavior. At LL conditions, the coefficient of friction increased as the temperature was increased. At LL and HV, the friction values doubled. This is likely due to the longer time required for the formation of the transfer layer. Comparing , the wear rates of POM-PP were of the same order of magnitude for both temperatures; however, the run time was reduced in all cases. This reduction is the opposite effect demonstrated by the PC-PA6.6 combination.
For PC-PA6.6, comparing , when the velocity was low, increasing the temperature had little effect on the friction and wear behavior. However, increasing the velocity at elevated temperature resulted in a lower friction coefficient (approximately 50%) and lower wear rate. Comparing , in all conditions, the run time was longer at elevated temperature. Moreover, at HL and HV, the run time was remarkably extended from 24 to 150 min. Hence, in practice, increasing the temperature within the application can actually reduce the effect of the critical factor—that is, velocity—for this material combination. This is in agreement with the findings of Yamaguchi (Citation18). The elevated temperature likely causes the PA6.6 to undergo phase transition because the glass temperature is between 45 and 50 °C. This reduces the ploughing effect and hence significantly lowers the coefficient of friction.
lists the average coefficients of friction that were measured at elevated temperature for both material combinations. Similar to the results at room temperature, it is interesting to note that for a low PV value (LL and LV), the average coefficients were in all cases higher than those for a high PV value (HL and HV).
Table 4. Average coefficient of friction for POM-PP and PC-PA6.6 at elevated temperature.
Effect of PV value
The measurements prove that there can be a critical value for either the contact pressure or sliding velocity or both. The critical value depends on the material combination and selection of the static and rotating elements.
For PA6.6-PC with PA6.6 as static element, wear rates continuously increased for increasing PV value. The run time to failure, however, showed a kind of zigzag motion, indicating a lifetime three times longer for the HL and LV setting, compared to a lower PV value (LL and HV). This goes against the design rule of a critical PV value and is a significant outcome of this study. This zigzag motion was also observed for PC-PA6.6 and POM-PP.
For PC-POM, the wear was negligible and the PV value had no significance. For POM-PP combinations, the disparity between the wear rates was very large depending on which material was the static element. Wear rates were reduced for higher PV values. The formation of a transfer layer determines the wear behavior, as also discussed by So (Citation19).
For PP-POM and PC-PA6.6, wear rates at the beginning of the experiment were opposite the wear rates at the end for various PV values. For PC-PA6.6, the temperature at the interface had a great influence, because PC is an amorphous polymer. Such polymers are known for abruptly softening once the temperature crosses a certain critical temperature, as discussed for the effect of load.
New design method for polymer–polymer sliding contacts
The experimental results and discussion demonstrate that the individual effects of load and velocity, static and rotating materials, and contact temperature have to be regarded for the design of a polymer–polymer sliding contact. Depending on the material combination at hand, in some cases the sliding velocity can be the critical factor, whereas in other cases the load may be the critical factor.
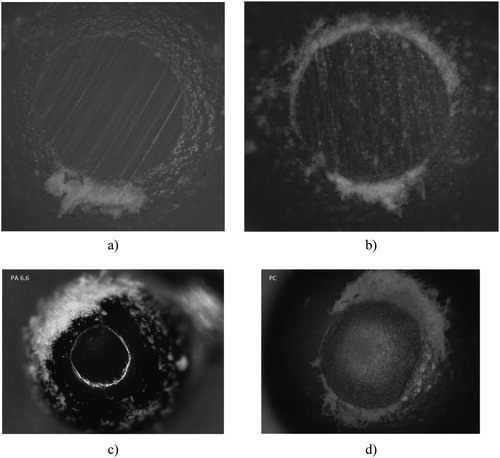
The experiments showed that material removal was in the form of powder with deep scratches on the wear tracks and pins; see . In , the pin shape after failure is shown for a POM pin sliding against a PP disk. The scratches were deep and distinct and were believed to be caused by minerals present in the PP disk. shows a PP pin that slid against a POM disk. The PP pin had traces of POM sticking to the worn pin surface. Finally, show a PA6.6 pin vs. a PC disk and vice versa, respectively. From these observations, it was concluded that ploughing was the dominant wear behavior, in which energy due to ploughing was converted into heat. Frictional heat at the contact surfaces affects the local material properties as the temperature rises. This is captured by the Péclet number, β, which relates advective and diffusive thermal rates. The Péclet number can be used to estimate the time required for heat to penetrate through the contact surfaces.
Figure 13. Analysis of material removal behavior of the pin after failure: (a) POM pin, (b) PP pin, (c) PA6.6 pin, and (d) PC pin.
The current design method presented earlier in this article is extended to also encompass frictional heating and contact temperature. Compared to traditional methods, parameters such as hardness and Young’s modulus of the materials in contact that are thermally affected during the sliding process are taken into account. By combining Archard’s and Ratner’s equations and including thermal and material properties, the following relation to predict the wear volume, V, can be formulated:
[10]
[10]
where q is the total heat generated per unit area of contact; E and H are the material’s Young’s modulus and hardness, respectively; which are readily available from manufacturer data sheets, and β is the Péclet number. The total generated heat per unit area of contact is defined as
[11]
[11]
where μ is the coefficient of friction, p is the contact pressure (N/mm2), and v is the sliding velocity (m/s).
EquationEquation [10][10]
[10] is constructed on the assumption that abrasive wear occurs between the two sliding surfaces and follows the concept that material properties of polymers change with respect to time and temperature. Viscoelastic material behavior is omitted, because this would require much more (empirical) material parameters to understand, for example, time-dependent effects. Currently, the parameters used in EquationEq. [10]
[10]
[10] are readily available from data sheets and hence enable a quick initial selection of materials. The experiments also showed that within the experimental range, an increase in time and load increased the wear volume, whereas an increase in velocity had little influence on the wear volume. In the case of EquationEq. [10]
[10]
[10] , the wear volume V predicts the wear volume of the static element.
Design steps of the proposed method
In the proposed design method, the contact pressure, PV value, and material preselection are determined similar to the original method. However, to better understand the durability and lifetime of the polymer–polymer contact, in a next step the contact or flash temperature of the sliding contact is estimated using a model proposed by Bos and Moes (Citation20). To avoid softening of the materials in contact, the contact temperature should be less than the glass transition (and melting) temperature. Unless the formation of a transfer layer is profitable, as was witnessed when POM, with a glass transition temperature of −30 °C, was used.
Thereafter, the Young’s modulus and hardness of the preselected material combinations are taken from material data sheets for the computed contact temperature. Because polymers lose their hardness and the Young’s modulus declines when the temperature increases, this must be tolerated by the application.
This approach reduces the set of viable material combinations and the contact temperature can be analyzed as a function of the PV values that may occur throughout the product lifetime. This is shown in , in which the flash temperatures are determined for both elastic and plastic deformation of the contact surfaces of various common material combinations. Most interesting from this analysis is that the temperature profile depends on the material combination and not necessarily increases for higher PV values. Hence, the durability of the contact may either improve or deteriorate for higher PV values depending on the material selection, as was also witnessed from the experimental results.
Figure 14. Flash temperature analysis for various PV values and commonly used material combinations for polymer–polymer sliding contacts.
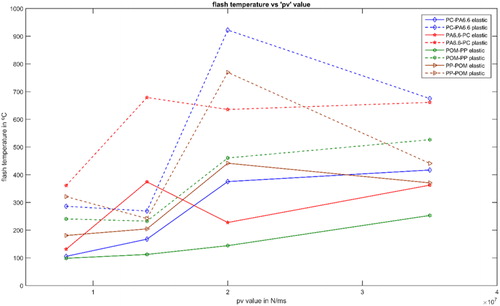
In addition, the critical factor (either pressure or velocity) for each material combination can be determined using this analysis. This is crucial, because for polymer–polymer contacts the product of PV alone is not insightful enough. From a design and application perspective, it is key to know the individual effects of load and velocity on the durability and lifetime of sliding contacts.
Finally, similar to the original method, the wear rate is predicted for the reduced set of preselected material combinations using the compiled experimental data of this study, and design iterations can be done until an optimal design is reached. This is demonstrated in for two material combinations, namely, POM-PP and PA6.6-PC. The figure shows that for low and high PV values, the predicted wear volume is relatively close to the measured wear volume. Overall the error is less than 20%, which is similar to that found in another study (Cenna, et al. (Citation21)). Similar to other methods, in this case the wear volume is also overestimated, due to the assumption that all parameters remain constant throughout the experimental runs. For instance, as the spherical pin wears out, the contact pressure decreases over time, which ideally should be compensated for by the model.
Figure 15. Predicted and measured wear volume as a function of the PV value. The predicted wear volume is based on Eq. [10].
![Figure 15. Predicted and measured wear volume as a function of the PV value. The predicted wear volume is based on Eq. [10].](/cms/asset/0d20b37a-aceb-4720-a08b-a463daeddfc5/utrb_a_1504153_f0015_c.jpg)
As demonstrated in , the wear volume does not depend solely on the PV value; for example, an increase in velocity results in a lower wear volume, compared to when the load is increased, similar to what was observed in the experiments. When observing , the deviation between the low and high PV values is apparent in both. The sudden and abrupt softening of amorphous polymers like PC makes it hard to predict the wear volume accurately. For semicrystalline polymers like PP and POM, the model gives more accurate results because material properties are more stable with temperature and hence easier to predict.
The advantages of this new approach is that the method and data take the behavior of the polymers in contact into account, especially regarding temperature variations, and are able to relate the individual contributions of load and velocity to the contact’s durability.
Conclusions
This article presented a new design method that considers the effect of temperature in polymer–polymer sliding contacts and the material combination. It was proven that for the design of polymer–polymer contacts, (Citation1) the conventionally used critical PV value is not insightful enough and (Citation2) the material selection of the static and rotating elements has an influence on the lifetime of the sliding contacts.
Experimental results for friction values and wear rates were presented for common engineering polymers. The experiments showed that material combinations in contact have a critical factor, of which the designer must be aware, not necessarily being the PV limit that determines the durability and lifetime of the contact. It was also demonstrated that the application temperature in operation has an important influence on the lifetime. A temperature increase can either be beneficial or have a negative impact on the sliding contact.
Finally, a new design method was presented in which a wear model is proposed that is based on the principle of deformation energy, because this energy leads to changing material properties. The proposed model is different from existing models because it includes thermal properties of the materials in contact through the use of the Péclet number. Moreover, through this method only data sheet values and design parameters are needed to predict the wear volume.
The new method helps to improve the design of durable polymer–polymer sliding contacts. The model can be further expanded by testing other materials combinations. Experimenting with various filler materials, as opposed to the unfilled virgin polymers used in this study, also introduces a completely new range of unchartered possibilities.
Additional information
Funding
Related Research Data
References
- Engel, T., Lechler, A., and Verl, A. (2016), “Sliding Bearing with Adjustable Friction Properties,” CIRP Annals - Manufacturing Technology, 65(1), pp 353–356.
- Van Beek, A. (2012), “Wear Mechanism of Machine Elements,” Advanced Engineering Design: Lifetime Performance and Reliability. TU Delft, Delft, The Netherlands.
- Heisel, U. and Klotz, D. (2003), “An Optimized Design of the Bearing in Machines for Ultrasonic Machining Processes,” CIRP Annals - Manufacturing Technology, 52(1), pp 307–310.
- Azeem Ashraf, M., Sobhi-Najafabadi, B., Göl, Ö., and Sugumar, D. (2009), “Numerical Simulation of Sliding Wear for a Polymer–Polymer Sliding Contact in an Automotive Application,” International Journal of Advanced Manufacturing Technology, 41(11), pp 1118–1129.
- De Baets, P., Glavatskih, S., Ost, W., and Sukumaran, J. (2014), “Polymers in Tribology: Challenges and Opportunities,” 1st International Conference on Polymer Tribology. 11-12 September 2014, Bled, Slovenia.
- Lancaster, J. K. (1971), “Estimation of the Limiting PV Relationships for Thermoplastic Bearing Materials,” Tribology, 4(2), pp 82–86.
- Mermoz, E., Fages, D., Zamponi, L., Linares, J.-M., and Sprauel, J.-M. (2016), “New Methodology to Define Roller Geometry on Power Bearings,” CIRP Annals - Manufacturing Technology, 65(1), pp 157–160.
- Archard, J. F. (1953), “Contact and Rubbing of Flat Surfaces,” Journal of Applied Physics, 24(8), pp 981–988.
- Ratner, S. B., Farberova, I. I., Radyukevich, O. V., and Lure, E. G. (1964), “Connection between Wear Resistance of Plastics and Other Mechanical Properties,” Soviet Plastics, 7, pp 37–45.
- Lewis, R. B. (1964), “Predicting the Wear of Sliding Plastic Surfaces,” Mechanical Engineering, 86(10), pp 32–35.
- Chaudri, A. M., Suvanto, M., and Pakkanen, T. T. (2015), “Non-Lubricated Friction of Polybutylene Terephthalate (PBT) Sliding against Polyoxymethylene (POM),” Wear, 342–343, pp 189–197.
- Gedde, U. W. (1999), “A Brief Introduction to Polymer Science,” Polymer Physics, pp1–18, Springer: Dordrecht, The Netherlands. Doi: 10.1007/978-94-011-0543-9_1
- Sinha, S. K. and Briscoe, B. J. (2006), “Surface Mechanical Damage and Wear of Polymers,” Encyclopedia of Polymer Science and Technology, Vol. 1, John Wiley & Sons. DOI: 10.1002/0471440264
- Briscoe, B. J. and Sinha, S. K. (2002), “Wear of Polymers,” Proceedings of the Institution of Mechanical Engineers - Part J: Journal of Engineering Tribology, 216(6), pp 401–413.
- Odi-Owei, S. and Schipper, D. J. (1991), “Tribological Behaviour of Unfilled and Composite Polyoxymethylene,” Wear, 148(2), pp 363–376.
- Pogačnik, A. and Kalin, M. (2012), “Parameters Influencing the Running-In and Long-Term Tribological Behaviour of Polyamide (PA) against Polyacetal (POM) and Steel,” Wear, 290–291, pp 140–148.
- Bahadur, S. (2000), “The Development of Transfer Layers and Their Role in Polymer Tribology,” Wear, 245(1), pp 92–99.
- Yamaguchi, Y. (1990), Tribology of Plastic Materials: Their Characteristics and Applications to Sliding Components, Elsevier Science. https://www.elseiver.com/books/tribology-of-plastic-materials/yamaguchi/978-0-444-87445-0
- So, H. (1996), “Characteristics of Wear Results Tested by Pin-on-Disc at Moderate to High Speeds,” Tribology International, 29(5), pp 415–423.
- Bos, J. and Moes, H. (1995), “Frictional Heating of Tribological Contacts,” Journal of Tribology, 117(1), pp 171–177.
- Cenna, A. A., Allen, S., Page, N. W., and Dastoor, P. (2003), “Modelling the Three-Body Abrasive Wear of UHMWPE Particle Reinforced Composites,” Wear, 254(5), pp 581–588.