
Abstract
A test to evaluate the tackiness of grease has been developed using a standard tribometer. There is currently no standard test of tackiness. A preliminary study determined the test parameters to use in the subsequent experiments. Twelve different greases were tested and the results showed how the developed test method was able to differentiate between different greases. The results were linked to the application of grease to a rail using a scaled wheel rig developed at the University of Sheffield. The developed test method showed the same relationship as the larger scale tests, leading to the conclusion that the developed method can be used to inform larger scale tests that are more costly and time consuming. The effect of “working” the grease prior to the test showed that the working had a significant effect on the tackiness of the grease. The test method was shown to be sensitive to small changes in the grease by adding small amounts of tackifier additive (0.1% increments) to the grease.
Keywords:
Introduction
Greases are widely used in many different applications to improve the performance of systems and protect components from failure. Understanding the properties of a grease and impacts of additives is vital to selecting the appropriate grease/additive to use.
This work uses the example of grease pickup in the railway industry to apply context and validate the developed test method of tackiness. Grease is applied to the gauge corner of rail in curves. This reduces the friction and forces in the wheel–rail contact to reduce wear and rolling contact fatigue, prolonging the life of the rail and wheels. The grease transfers to the wheel flange from lubricators, often placed next to the rail in a straight track. The wheel then carries it down the track, lubricating the rail in the subsequent curves. How much grease gets picked up and carried down the track is important to ensure adequate lubrication of the rail curves. The tackiness of the grease plays an important part in this transfer process, ensuring that enough grease is transferred from the lubricator to the wheel and then from the wheel to the rail.
There is a large body of published research on the effect of flange lubrication on the tribological performance of railways, such as rolling contact fatigue (Wang, et al. (Citation1); Hardwick, et al. (Citation2)), retentivity (Lewis, et al. (Citation3)), and friction and wear (Lewis, et al. (Citation3); Eadie, et al. (Citation4); Hardwick, et al. (Citation5); Gallardo-Hernandez and Lewis (Citation6); Beagley, et al. (Citation7); Sundh, et al. (Citation8); Alp, et al. (Citation9); Ishida, et al. (Citation10)). These tests predominantly use small-scale laboratory tests (either pin-on-disc or twin-disc). Few papers have studied the physical application of grease to the track. This is important because without understanding how much grease to apply or how far down the track the grease is carried, it is unknown whether the performance benefits seen in the laboratory actually take place during operation in the field. Grease pickup has been investigated at the University of Sheffield using a bespoke test rig (Clayton, et al. (Citation11); Jones (Citation12)). There have also been a few field studies of flange lubrication (Uddin, et al. (Citation14); Chen, et al. (Citation15)). Though studying the tribological performance and application of flange lubrication is vital, there is no mention in the literature of how the properties of grease (e.g., base oil viscosity/shear stability) or different components of grease (e.g., different additives or thickeners) affect the performance or application.
Currently there are no standard tests for grease tackiness and very few studies of tackiness in the literature. A standard lab test is required for tackiness for quality control purposes and for greases to be optimiszd for their specific application.
Aim
The aim of this work was to devise a test method to quantify tackiness of grease. This test would be able to be used in the future to link tackiness to performance benefits. Initial test parameters had to be determined that would produce consistent, reproducible results. To prove that the test method works, the effect of roughness on tackiness and different greases was tested. In addition, the effect of “working” the grease pretest was analysed. Finally, the effect of adding small amounts of tackifier additive on the tackiness was assessed.
Grease tackiness research
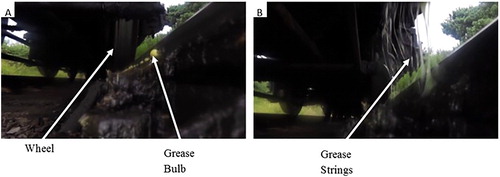
Tackiness is described as the ability of the grease to form strings or threads (Achanta, et al. (Citation16)). It is often confused with adhesion, which refers to the ability of the grease to stick to a surface. shows how a grease forms threads when a train wheel rolls through a grease applicator site. The grease is pumped through an applicator bar, forming bulbs of grease on the side of the rail. The wheel flange contacts these bulbs, transferring the grease onto the wheel. Tackiness is important in the wheel–rail contact because a tackier grease will form longer strings, enhancing grease pickup from the Grease Distribution Unit (GDU) to the wheel. More grease pickup on the wheel leads to better lubrication of the contact in curves, which improves the life of the rail and wheels. Tackiness performance of a grease can be improved by incorporating additives in it. Tackiness additives are often high-molecular-weight polymers, susceptible to breakdown by high shear rates (Rudnick (Citation17)).
Figure 1. Still images captured from a video camera (A) before contact between the first wheel of the train and the grease bulb and (B) after the first wheel has passed through the lubricator site but before the second wheel.
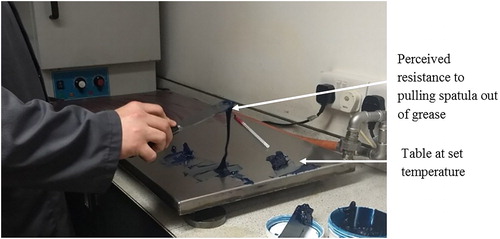
The simplest method of determining tackiness is a finger test. A blob of grease is squeezed between the finger and thumb and then this finger and thumb are pulled apart. A similar test using a spatula is shown in . This is currently used at the end of a manufacturing line during quality assurance to determine whether the grease has an acceptable tackiness. The results from this test are based on observation and “feel” and are qualitative. For quality assurance purposes, a more standardized and quantitative measurement would be extremely beneficial, also allowing comparison of different grease formulae.
Figure 2. Current tackiness test.
A more sophisticated method of measuring the tackiness is an open siphon technique described in detail in Rudnick (Citation17). This method measures the length of a formed string of grease; the longer the string, the tackier the grease is said to be. Another test method is an approach–retraction method (Achanta, et al. (Citation16)). This method has been validated with cone penetration tests by comparing the cohesiveness results and has shown good correlation between the two methods. It uses a measured force during retraction to calculate the energy required to break the grease strings as a measure of tackiness. The final test method found uses a capillary breakup extensional rheometer to measure the string formed during retraction of two discs (Steinhof and Kull (Citation18)). The diameter of the strand is measured via a laser as a function of time.
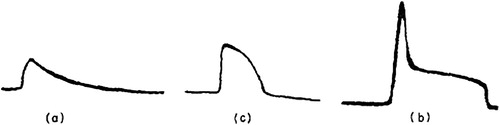
Work carried out by Strasburger (Citation19) showed different forms of separation according to the force trace produced during the test, as seen in . The results were obtained using an approach–retraction method. There were clear differences in the traces depending on the type of separation. Initially, the separation is characterized by the flow of the liquid where the force rises to a maximum and then decays to zero as seen in . After a threshold value, cavitation causes a rapid decrease in force after the maximum value before a sharp turn, decaying to zero, as seen in . shows a transitional period trace where there is both separation by cavitation and separation by flow. The reason given by Strasburger (Citation19) for cavitation causing the rapid decrease in force is that at peak force, the tension in the liquid is released by bubbles, which grow and join together to form a cavity. The expansion of this cavity causes a break in the fluid layer and the rate of decay of the force is related to how quickly this cavity expands. Cavitation causes a rapid break in any grease strings formed and therefore lowers the measured tackiness.
Figure 3. Typical force traces for approach–retraction experiment results: (a) trace typical of separation by flow between two surfaces, (c) trace typical of transition region between flow separation and cavitation separation, (b) trace typical of separation by cavitation (Strasburger (Citation19)).
The polymer chains in greases must have the capacity to expand for a substance to be tacky, and the important parameters governing tackiness are the molecular weight and flexibility of the chains of molecules (Rudnick (Citation17)).
There is currently no one method that is universally accepted as a measure of grease tackiness. The only published research found describes the test methods rather than research into tackiness itself and focuses on oils rather than greases (Rudnick (17)). Therefore, there is a need for development of the current available test methods for greases to ensure that they are reproducible and produce consistent results. The approach–retraction method will be used because an existing tribometer can be modified to carry out this form of testing.
Test equipment
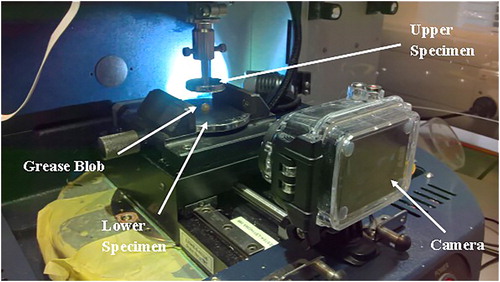
A tribometer was used in this work because its modular construction meant that it could be tailored to fit the requirements. A linear lower drive with a vice was used to hold the lower specimen in position. A 50 N load cell was used to provide a suitable level of resolution. A Bruker Universal Mechanical Tester is controlled by creating a test script, defining the parameters that the computer then implements when the script is run. shows a typical test setup. The upper specimen diameter is 29 mm and both specimens are machined from 316 stainless steel. A video camera was used to record the test. A syringe was used to apply grease to the lower specimen using a mass balance accurate to ±0.0005 g to measure the amount of grease. A nominal amount of grease was presmeared on both specimens prior to each test. The grease used was a standard multipurpose grease.
Figure 4. Typical test setup.
Test method
The method is an approach–retraction type experiment. This method was chosen due to its simplicity of implementation. All tests were carried out at room temperature with no temperature or humidity control.
All tests followed a standard procedure:
Specimens were presmeared with a nominal amount of grease.
A blob of grease was applied to the lower specimen via a syringe using mass balance.
A test script was run:
Lower the upper specimen until a set force is reached for 10 s.
Retract the upper specimen at a set speed until grease strings are broken.
Remove excess grease from the upper specimen.
Reweigh the lower specimen to measure the grease pickup onto the upper specimen.
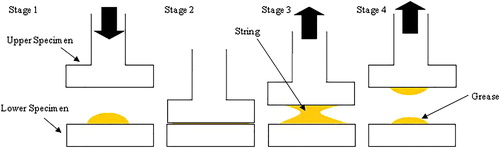
shows a schematic of the different stages of the test:
Stage 1: The upper specimen is lowered until a set force is reached.
Stage 2: The upper specimen is held in position at the set force for a set time.
Stage 3: The upper specimen is raised, pulling the grease upwards, forming a grease “string.”
Stage 4: The upper specimen continues to rise, the grease string is broken, and some of the grease is transferred to the upper specimen.
Figure 5. Schematic of the test.
Before carrying out testing, a number of parameters had to be determined:
Initial compressive force
Initial grease amount
Retraction speed
Repeatability of results.
Each parameter was varied in turn in a preliminary study to analyze its effect and to determine what setting to use in the main investigation. All of the parameters used in all of the tests are provided in .
Table 1. Summary of all test conditions.
Data analysis
The test rig outputs a text file with the time, distance the upper specimen moved, and force inside it. shows an example of a typical force–distance graph produced from data. This graph is just for the retraction period and not the loading period of the test. The force tends to zero as the grease strings break. This graph shape is typical for slow rates of separation caused by the grease flowing between the two test specimens (Strasburger (Citation19)). From work carried out by Achanta, et al. (Citation16), the three distinct regions represent different properties of the grease:
Figure 6. Example force response graph.
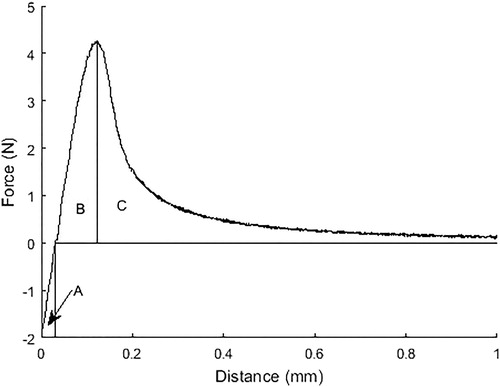
Region A: The work done against the grease resistance.
Region B: The work required to start separation.
Region C: The work required to break the grease strings. This region allows tackiness to be calculated.
The area in region C and the maximum force are calculated by implementing a MATLAB script.
Preliminary study results
shows the work done to break the grease strings for each of the preliminary tests. The ideal case is to maximize the work done to break the grease strings because this leads to a reduction in error overall. There is a clear linear correlation between initial grease amount () and work done to break the grease strings. At higher grease amounts, the relationship starts to change because some of the grease is squeezed outside the specimen circumference, therefore not affecting the results. There is also a linear correlation between retraction speed and work done (). In , there is a clear increase in work done as force increases with the work done, dropping once cavitation effects start occurring. Cavitation effects are more severe at higher compressive forces. shows that the method produces repeatable results.
Figure 7. Work done to break grease strings for (A) different compressive forces, (B) different retraction speeds, (C) different initial grease amounts, and (D) repeats of the same parameters.
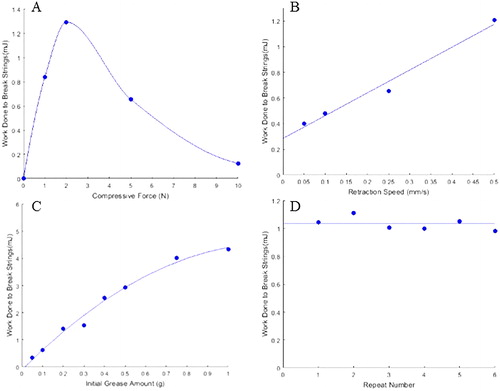
The force curve is influenced by cavitation effects; the parameters detailed in for use in further tests were chosen to avoid cavitation.
Table 2. Parameters chosen from preliminary study.
These parameters are not representative of wheel–rail contact because usually there is more grease present, there is a greater compressive force, the speed is much faster, and the wheel rolls over the grease, rather than a straight vertical retraction. However, the parameters chosen will allow repeatable, reproducible results so that comparisons can be made, and this method can be used to inform future tests in more realistic conditions.
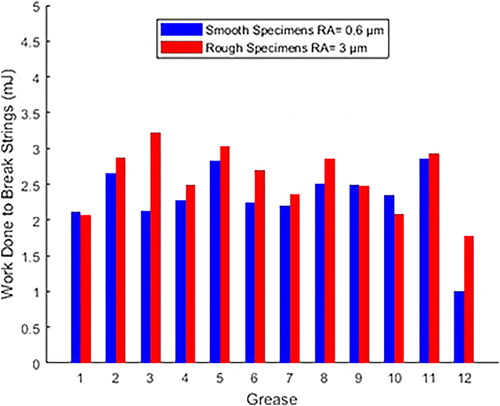
Effect of specimen roughness and different greases
To investigate the effect of specimen roughness on tackiness, two specimen pairs were made, one with an Ra of 3 µm and a smoother pair with a Ra of 0.6 µm. Twelve different greases were tested on both pairs of specimens using the standard test method described in Test Equipment section. Some of the greases are different formulations of the same grease.
Results
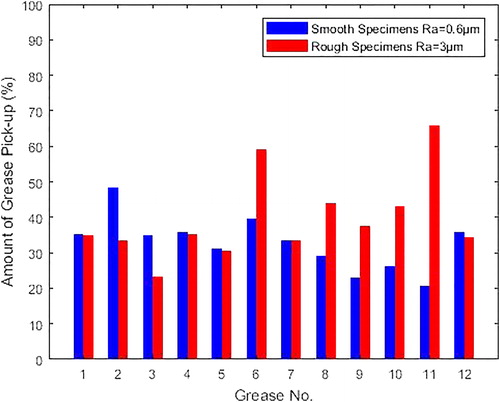
shows the results from the testing with different greases using the different roughness specimens. It clearly shows that the rough specimens require more work to break the grease strings, with a couple of exceptions. It is unclear why the roughness causes the tackiness to increase. It could be due to the rougher surface having larger asperities, which are a better shape for forming and holding onto the grease strings. This highlights the importance of the surface condition that is being lubricated because changes to the roughness change the work done to break the grease strings. The graph also shows that the test method is able to differentiate between different greases/different formulations of the same grease.
Figure 8. Effect of roughness on the work done to break grease strings.
shows the percentage of grease picked up on the upper specimen. There are no consistent conclusions that can be drawn from this graph. This is because the smooth specimens pick up more grease on some occasions and the rougher specimens pick up more grease on other occasions. This could be due to poor grease homogeneity because the greases were all manufactured on different dates and stored for different lengths of time.
Figure 9. Amount of grease pickup on upper specimen.
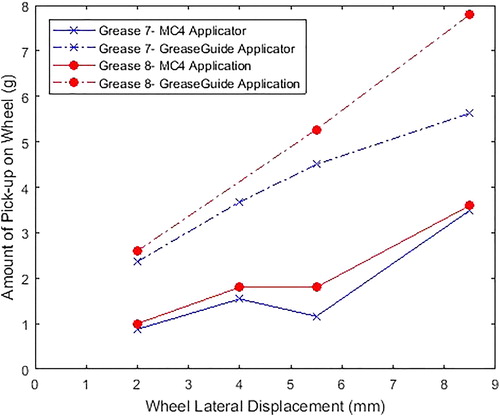
compares the pickup of two greases on a wheel from previous work done at the University of Sheffield (Temple (13)). The tests used a scaled wheel on a short section of rail with two different grease applicator bars tested. and support the hypothesis that the tackier the grease, the greater the pickup. This is because the tackiness will cause longer strings to form, which will cause more of the grease to transfer to the upper specimen. It is difficult to know why this hypothesis is not supported in . It is expected that this is because the contact conditions and motion are completely different between moving two conical plates vertically and rolling a wheel along a rail.
Figure 10. Comparison of grease pickup of on a wheel from a scaled wheel rig at the University of Sheffield for two different greases and two different grease applicator bars.
Observations
This section has shown that rougher specimens cause more work to be done to break the grease strings, which means that the grease is tackier. This has not translated to a higher pickup in the tribometer tests and it is unknown why this is. The tests have also been able to differentiate between many different greases and even between different formulations of the same grease. This has been further extended to a more realistic wheel–rail test rig where the grease with a higher tackiness has resulted in greater pickup of grease onto the wheel.
“Working” of grease
There has been anecdotal evidence that “working” of a grease prior to carrying out a tackiness test changes the tackiness of the grease. Working of the grease in this study means applying small amounts of compressive force to the grease before starting the separation test.
Modifications to test method
To investigate whether this does occur and to attempt to quantify the effect, a modification to the standard test script detailed in the Test Equipment section was made (changes to script are highlighted in bold text below). A working stage was included prior to carrying out the test stage
Specimens were presmeared with a nominal amount of grease.
A blob of grease was applied to the lower specimen via a syringe using mass balance.
A test script was run.
Working stage
Lower the upper specimen until a force of 2 N is reached for 2 s.
Retract the upper specimen at a set speed for a small distance as shown in .
Repeat the previous two steps a set number of times.
Test stage
Lower the upper specimen until a force of 2 N is reached for 2 s.
Retract the upper specimen at a set speed until the grease strings are broken.
Remove excess grease from the upper specimen.
Reweigh the lower specimen to measure the grease pickup onto the upper specimen.
Table 3. Parameters used during the working stage of the script.
There were two types of working investigated with the parameters detailed in :
Type A: Peak force is reached during the working stage but strings are not completely broken.
Type B: Peak force is not reached during the working stage.
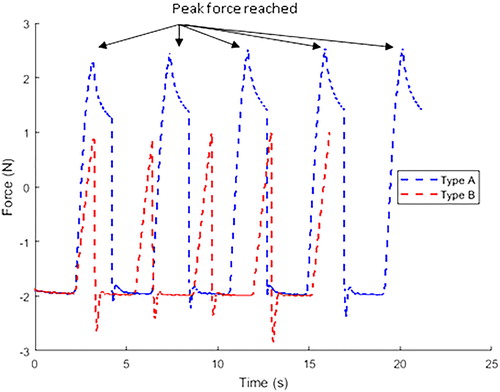
shows how the two types of working are different, because it can clearly be seen that in type A, the peak force has been reached before the grease is compressed again. There is a slight overshoot of force as the grease is compressed; however, it is not expected that this makes a difference to the results. The graph shows five working steps.
Figure 11. Force–time graph of five working stages.
Results
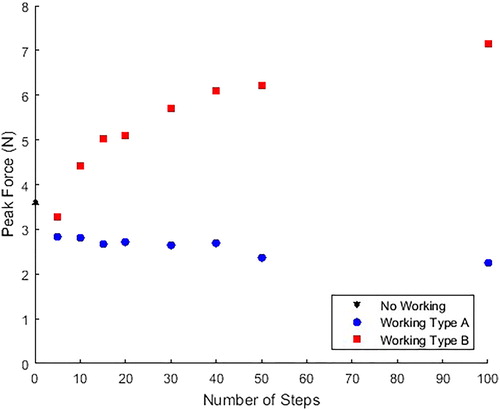
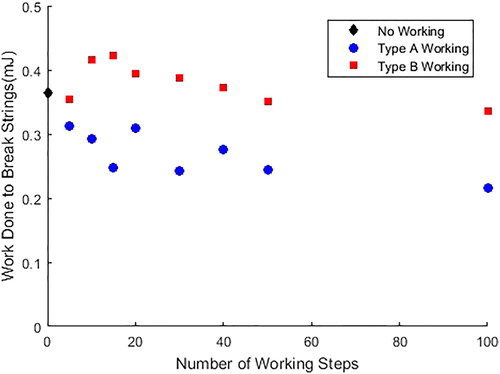
To show the effect of prior working of the grease, shows the peak pull-off force reached against the number of steps the grease was worked before the test was carried out. For type A working, the reduction in tackiness is linear as the number of working steps increases, whereas for type B working, the relationship increases for the number of working steps and is quadratic.
Figure 12. Peak force reached during the test for differing number of steps worked prior to test being carried out.
shows the work done to break the grease strings. Type B working required more energy than type A working to break the grease strings due to an increase in tackiness.
Figure 13. Work required to break grease strings for both types of working.
Discussion
and support each other. Both figures show a decrease in tackiness and adhesion for type A working and an increase in tackiness and adhesion for type B working. However, in there is a decrease in tackiness after 15 working steps. This is explained by understanding how the chains of molecules in the grease respond to the two different working types. For type A working, the maximum pull-off force is reached, which shears some of the long chains of molecules into smaller chains. This would happen at each working step, so the more steps, the smaller the chains of molecules, which need less force to cause separation when the upper specimen retracts fully. These shorter chains are also less elastic than longer chains, causing a reduction in tackiness. This explains the linear relationship seen in for type A working. For type B working, the maximum pull-off force is not reached and the working steps have the effect of aligning the chains of molecules in the grease. Therefore, when the upper specimen is retracted fully, more chains of the molecules share the load and extend elastically and, hence, more force is required to pull the specimens apart, with a corresponding increase in tackiness.
Two things working together cause the quadratic relationship seen in for type B working. First, the cavitation effect places an upper limit on the adhesion of the grease (Strasburger (Citation19)), and the more working steps that occur, the greater the cavitation effect. Secondly, the working of the grease is aligning the molecules, but they can only be aligned by a finite amount. Initially, the chains are aligned randomly. Once working of the grease starts, the chains become more aligned as the number of working steps increases. Therefore, once the majority of the molecules are aligned, further working of the grease has little effect. In , tackiness starts reducing after 15 working steps. This is caused by cavitation, which breaks the grease strings quicker. This shows that though increasing the number of working steps beyond a certain amount increases the adhesion of the grease, it reduces the tackiness.
Observations
This section has shown that working the grease prior to testing changes the response of the grease. If the maximum pull-off force is not reached during working, then the peak force seen increases with the number of steps the grease is worked for. If the maximum pull-off force is reached during working, the opposite occurs. This is due to changes in the arrangement and length of the chains of molecules in the grease. The work done to break the grease strings shows that if maximum pull-off force is not reached during working, the tackiness increases until cavitation effects occur and start to decrease the tackiness. If maximum pull-off force is reached during working of the grease, then tackiness is reduced.
Tackifier additive
To test how sensitive the test method is, small amounts of a tackifier additive were added to the grease in increments of 0.1% by weight starting at 0%.
Modifications to test method
The standard test method described in the Test Equipment section was used in these tests. The initial grease amount was 0.5 g, the retraction speed was 0.25 mm/s, and the initial force was 4 N. The samples were mixed using the following method:
Base grease was added to a mixing pot (∼70 g).
0.1% by weight tackier additive was added to a mixing pot.
The sample was mixed by hand for 3 min.
The sample was removed via syringe (4–6 g).
Previous steps were repeated to obtain all five samples.
Syringes were placed in dry ultrasonic bath for 10 min and heated to 40 °C.
Samples were prepared 48 h before testing.
Results
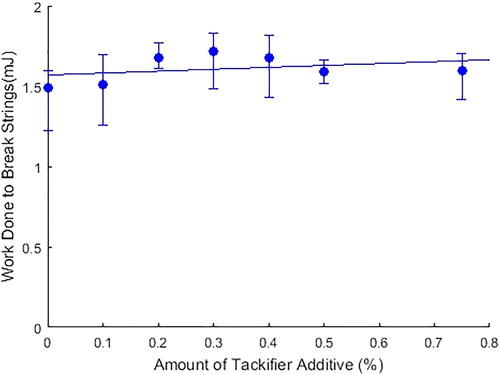
shows the effect of adding the tackifier additive on the tackiness of the grease. The overall trend is for an increase in tackiness, although there is a large amount of scatter in the results. The scatter comes from the difficulty in ensuring that each test sample has the exact ratio of additive to base grease due to the small quantities involved. This highlights the fact that careful preparation is required when adding additives or mixing greases together for this test. Otherwise, the effects of the additive can be lost in variability of the results.
Figure 14. Work done to break grease strings with different amounts of tackifier additive—improved grease mixing method used.
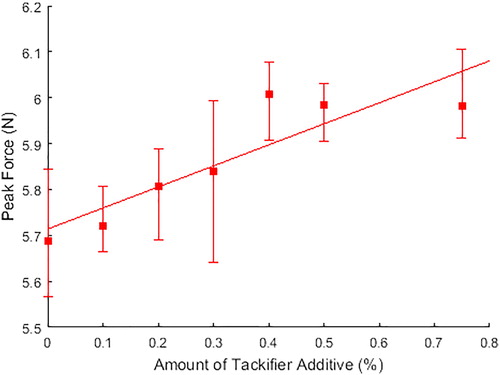
shows the mean peak force. It again shows an increased peak force for increasing tackifier additive. is an enlarged section of to show the results more clearly. It is important to note the y-axis scale.
Figure 15. Peak force vs. amount of tackifier additive for both mixing methods.
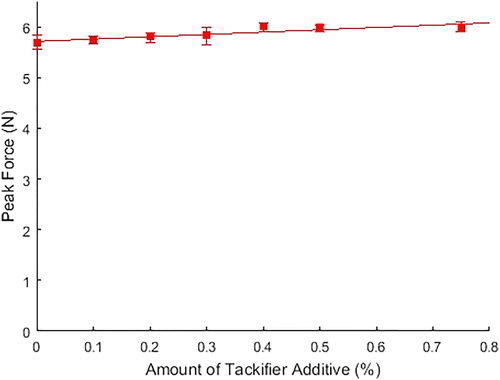
Figure 16. Zoomed-in peak force vs. tackifier additive.
Observations
This section has shown that the test method does detect small changes in the grease, but careful preparation of samples is important to ensure that any experimental error is not greater than the measured changes in tackiness.
Conclusions
A test method using a standard tribometer has been developed using an approach–retraction method. Initially, different test inputs were investigated to understand how the parameters affected the results. Parameters were chosen to limit the cavitation effects seen in the results. The test method has been shown to be able to differentiate between different greases and so can be used as a benchmarking method. The wide range of results seen shows that the test method can be used for a large range of products and applications, increasing the relevance of this test method. The effect of adding small amounts of a tackifier additive has shown that though it is difficult to get the right quantities of additive onto the test specimen, the effect of the additive can be seen in the maximum pull-off force results and tackiness of the grease. Working the grease prior to testing has an effect on the response of the grease and can be incorporated into the test method if required. This enables this test method to be modified to suit a particular application, further increasing the applicability of this method. The results from this tackiness test have been compared to a larger scale wheel–rail grease pickup test and have been shown to have the same relationship between greases for both test methods. This shows that this new test method can inform the results of larger, more complicated tests.
Further work
The test conditions can be expanded to cover different humidities/temperatures with the addition of an environmental chamber to the tribometer. The test could also be used with the conditions matched to a specific application. This would show whether a better performing grease using this test method relates to better performance in the real application.
Additional information
Funding
References
- Wang, W. J., Lewis, R., Evans, M. D., and Liu, Q. Y. (2017), “Influence of Different Application of Lubricants on Wear and Pre-Existing Rolling Contact Fatigue Cracks of Rail Materials,” Tribology Letters, 65(2), pp1–15.
- Hardwick, C., Lewis, R., Stock, R., and Foster, L. B. (2017), “The Effects of Friction Management Materials on Rail with Pre Existing RCF Surface Damage,” Wear, 384–385, pp 50–60.
- Lewis, S. R., Lewis, R., Evans, G., and Buckley-Johnstone, L. E. (2014), “Assessment of Railway Curve Lubricant Performance Using a Twin-Disc Tester,” Wear, 314(1–2), pp 205–212.
- Eadie, D. T., Oldknow, K., Santoro, M., Kwan, G., Yu, M., and Lu, X. (2012), “Wayside Gauge Face Lubrication: How Much Do We Really Understand?,” Proceedings of the Institution of Mechanical Engineers - Part F: Journal of Rail and Rapid Transit, 227(3), pp 245–253.
- Hardwick, C., Lewis, R., and Eadie, D. T. (2014), “Wheel and Rail Wear—Understanding the Effects of Water and Grease,” Wear, 314(1–2), pp 198–204.
- Gallardo-Hernandez E. A. and Lewis, R. (2008), “Twin Disc Assessment of Wheel/Rail Adhesion,” Wear, 265(9–10), pp 1309–1316.
- Beagley, T. M., McEwen, I. J., and Pritchard, C. (1975), “Wheel/Rail Adhesion—Boundary Lubrication by Oily Fluids,” Wear, 31(1), pp 77–88.
- Sundh, J., Olofsson, U., and Sundvall, K. (2008), “Seizure and Wear Rate Testing of Wheel–Rail Contacts under Lubricated Conditions Using Pin-on-Disc Methodology,” Wear, 265(9–10), pp 1425–1430.
- Alp, A., Erdemir, A., and Kumar, S. (1996), “Energy and Wear Analysis in Lubricated Sliding Contact,” Wear, 191(1–2), pp 261–264.
- Ishida, M., Ban, T., Iida, K., Ishida, H., and Aoki, F. (2008), “Effect of Moderating Friction of Wheel/Rail Interface on Vehicle/Track Dynamic Behaviour,” Wear, 265(9–10), pp 1497–1503.
- Clayton, P., Danks, D., and Steele, R. K. (1989), “Laboratory Assessment of Lubricants for Wheel/Rail Applications,” Lubrication Engineering, 45(8), pp501–506.
- Jones, D. (2014), Investigating Grease Pick-Up and Carry Down Using Laboratory and Field Measurements, MEng Thesis, University of Sheffield, Sheffield, UK.
- Temple, P., Harmon, M., Lewis, R., Burstow, M., Temple, B., and Jones, D. (2017), “Optimisation of Grease Application to Railway Tracks,” Proceedings of the Institution of Mechanical Engineers - Part F: Journal of Rail and Rapid Transit,232(5), pp 1514–1527.
- Uddin, M. G., Chattopadhyay, G., and Rasul, M. (2014), “Development of Effective Performance Measures for Wayside Rail Curve Lubrication in Heavy Haul Lines,” Proceedings of the Institution of Mechanical Engineers - Part F: Journal of Rail and Rapid Transit, 228(5), pp 481–495.
- Chen, H., Fukagai, S., Sone, Y., Ban, T., and Namura, A. (2014), “Assessment of Lubricant Applied to Wheel/Rail Interface in Curves,” Wear, 314(1–2), pp 228–235.
- Achanta, S., Jungk, M., and Drees, D. (2011), “Characterisation of Cohesion, Adhesion, and Tackiness of Lubricating Greases Using Approach–Retraction Experiments,” Tribology International, 44(10), pp 1127–1133.
- Rudnick, L. R. (2009), “Tackifiers and Antimisting Additives,” Lubricant Additives: Chemistry and Applications, 2nd ed., pp.357–377, CRC Press, Wilmington, Delaware.
- Steinhof, O. and Kull, A. (2014), “Extensional Flow Properties of Lubricating Grease and the Effect of Tackiness Additives,” Annual European Rheology Conference,Karlsruhe, Germany, April 8-11, 2014.
- Strasburger, H. (1958), “Tacky Adhesion,” Journal of Colloid Science, 13, pp 218–231.