
 ?Mathematical formulae have been encoded as MathML and are displayed in this HTML version using MathJax in order to improve their display. Uncheck the box to turn MathJax off. This feature requires Javascript. Click on a formula to zoom.
Abstract
This article evaluates the frictional performance of different bearing grease formulations in full rolling bearings and a ball-on-disc rig and subsequently assesses whether the ball-on-disc test results can be used to predict the grease performance in actual bearings. A selection of custom-made greases with systematically varied formulations as well as their base oils were tested. Bearing torque was measured in two different cylindrical roller thrust bearings and a thrust ball bearing. The same lubricants were tested with ball-on-disc tribometers, a mini traction machine (MTM) to measure friction and an optical elastohydrodynamic (EHD) rig to measure film thickness. Both lithium complex and diurea greases were observed to produce lower friction than their base oils within the low speed, low nominal lambda ratio region, whereas the greases and oils had the same friction at high nominal lambda ratio values. These relative trends were the same in full bearing and single-contact MTM tests. The reduction in friction was seen to be related to the level of film thickness enhancement provided by greases at lower speeds, which leads to an increase in the effective lambda ratio and hence reduced friction. By extracting the sliding torque component from the overall measured bearing torque, a plot of the friction coefficient against the effective lambda ratio was produced encompassing all bearing and single-contact tests and all lubricants and test conditions. This plot was seen to follow a general shape of a master Stribeck curve, indicating that the numerical values of the friction coefficient from ball-on-disc and full bearing tests overlap and can be related to each other using this approach over the range of conditions employed here. Thus, single-contact ball-on-disc tests can provide a fast and economical way of establishing the frictional performance of bearing greases in full bearings in terms of both relative performance rankings and quantitative values of bearing frictional power losses.
Introduction
Rolling element bearings are used in a vast range of mechanical systems and across all industrial sectors. It is reported that over 50 billion rolling element bearings are operating in the world at any one time (Lugt (Citation1)). Given their ubiquity, minimizing bearing frictional losses is one of the most pervasive ways of reducing energy consumption and CO2 emissions, with potential for a significant cumulative impact. Since over 80% of rolling bearings are lubricated with grease (Cen and Lugt (Citation2)), employing low-friction bearing greases is an effective approach to reducing bearing friction.
Grease lubrication has been studied in both real bearing tests and single-contact tribometers. The latter allow for better control of contact conditions and hence enable deeper insights into mechanisms at play but do not entirely replicate the conditions existing in real bearings. A number of authors have investigated grease friction using real bearing tests. Based on the experiments with cylindrical roller bearings, Wikström and Höglund concluded that there is no difference in the frictional performance of greases and their respective base oils at low temperatures (Wikström and Höglund (Citation3)) and that the base oil viscosity is the only parameter that has a direct effect on friction, with lower viscosity base oils giving lower friction (Wikström and Höglund (Citation4)). In contrast, Muennich and Gloeckner (Citation5) showed that frictional torque in a grease-lubricated thrust cylindrical roller bearing was strongly dependent on thickener type in both fully flooded and starved conditions. Wilson’s (Citation6) measurements of temperature on a double-row spherical roller bearing and a single-row cylindrical roller bearing suggested that a lithium grease generates lower torque than its corresponding base oil. Cousseau, et al.’s (Citation7)–(Citation10) tests with thrust bearings found that grease thickener can impact the overall rheological properties and frictional performance of a grease by influencing the viscosity of the bled oil, believed to be the active lubricant component participating in the lubrication process.
Full bearing tests are extremely valuable in establishing the grease performance in real applications but are not well suited to the investigation of the mechanisms at play due to the presence of several complicating factors and the inability to control conditions or measure film thickness in the element–raceway contacts, all of which are potential reasons for the apparent contradictions in trends observed in different studies using real bearing tests. To address these issues, several studies have used single-contact tribometers to investigate grease friction and film formation. Perhaps the most widely cited finding from such single contact tests is that most greases form much thicker films than their base oils in the low-speed region (Cann (Citation11); Cen, et al. (Citation12, Citation13); De Laurentis, et al. (Citation14, Citation15); Kanazawa, et al. (Citation16)), where their film thickness formation behavior does not follow the well-established theories of elastohydrodynamic lubrication (EHL). Although this fact has gained almost universal acceptance, there is only a limited explanation of the mechanisms of grease film build-up (Kanazawa, et al. (Citation16)) other than the long-standing recognition that the thick films at low entrainment speeds are due to thickener effects (Cen, et al. (Citation12); Hamrock and Dowson (Citation17); Gonçalves, et al. (Citation18)), whereas at high entrainment speeds the films are largely determined by the base oil properties. In line with these trends in film thickness, several authors have also showed that the thickener type has a strong influence on friction within this thickener-influenced region (De Laurentis, et al. (Citation14); Kanazawa, et al. (Citation16); Cann (Citation19)). By isolating a single variable of interest at a time, single-contact tests have also helped to better establish the effect of base oil viscosity (De Laurentis, et al. (Citation15); Kanazawa, et al. (Citation16)) and type (De Laurentis, et al. (Citation15)) as well as thickener type (Kanazawa, et al. (Citation16)) and concentration (Gonçalves, et al. (Citation20)) on grease friction and film forming behavior.
Despite these efforts, the mechanisms of grease film buildup and particularly grease friction are not yet fully understood, which hinders further progress in reducing frictional losses in rolling element bearings and extending bearing lives. Two primary factors are responsible for this lack of understanding: (Citation1) the complex multiphase nature of lubricating greases that consist of base oil, thickener, and additives and (Citation2) the difficulties in studying lubrication mechanisms and friction in operating bearings.
The single-contact tests were designed to address the latter of the two issues, and the observations thus obtained are commonly used to infer the impact of different grease composition on the operation of real bearings. However, although single-contact tests are indispensable in understanding the fundamentals of grease lubrication, there are multiple factors at play in real bearings that are not well represented by such tests. These mainly revolve around aspects that cause uncertainties in establishing the state of grease supply to the rolling element–raceway contact in an operating bearing, such as the shearing of grease during bearing operation, repetitive passage of rolling elements, potential effects of the bearing cage, etc. There appears to be very little published work providing direct and systematic comparison of friction measurements in real bearings to those in single-contact tribometers; therefore, it is unclear whether single-contact grease tests can be used to predict bearing performance. This article helps to address these knowledge gaps by
• Investigating the influence of grease composition on bearing friction torque using a set of model greases with systematically varying compositions designed to isolate the influence of thickener and base oil viscosity.
• Providing a direct comparison of measured bearing friction torques with the equivalent friction measurements in a ball-on-disc mini traction machine (MTM) tribometer using a new approach designed to assess whether single-contact test results can be used to quantify frictional performance of different greases in real bearings.
The results and analyses presented are intended to provide insight into the effects of grease composition on bearing friction and to help grease developers establish the most suitable and economical approach to test the frictional performance of bearing greases.
Test lubricants
The custom-made greases tested in this work and their main properties are listed in . All greases contain polyalphaolefin (PAO) as the base oil. The greases are identified as LL, LH, and UL; the first letter identifies the thickener type (U for urea and L for lithium complex), and the second letter identifies one of the two base oil viscosities used (L for low-viscosity and H for high-viscosity base oil). The diurea thickener was derived from the reaction between diisocyanate and amine, and the lithium complex thickener was obtained from the saponification of a mixture of hydroxystearic and azelaic acid with lithium hydroxide carried out in the base oil. These greases are additive free and were manufactured to have the same worked penetration. This excludes any potential effects of additives and consistency on their frictional performance so that the effects of thickener and base oil viscosity could be studied in isolation. The effect of thickener type on friction can be evaluated by comparing the test results obtained with LL and UL, formulated with the same base oil but different thickener types. The effect of base oil viscosity can be evaluated by comparing the performance of LL and LH, formulated with the same lithium complex thickener but oils of significantly different viscosities. The two base oils used in the formulation of these greases were also tested in this work for comparison. This work builds on the authors’ previous studies with the exact same set of greases and oils (Kanazawa, et al. (Citation16)), and the reader is referred to that publication for extensive results on the frictional and film thickness performance of these greases in ball-on-disc tests only.
Table 1. List of test lubricants and their properties.
Experimental equipment and procedure
Thrust rolling bearing tests
This section describes the details of the experiments performed with full rolling bearings. Three different bearings were used in these tests: two types of cylindrical roller thrust bearing, designations 81107 and 81105 (identified in this article as CRTB1 and CRTB2, respectively), and a thrust ball bearing, designation 51107 (identified in this article as TBB).
Thrust rolling bearing rig
Frictional torque measurements with lubricated thrust rolling bearings were conducted using a modified four-ball machine, where the four-ball arrangement was replaced by a rolling bearing assembly. The rig was initially developed by Cousseau, et al. (Citation21) and is shown in . The thrust load was applied through the bottom raceway (washer) of the bearing, and the top raceway was driven at the chosen speed by an external motor. The torque generated on the bearing housing was measured by a piezoelectric torque cell. For a full description of the rig, the reader is referred to Cousseau, et al. (Citation21). The main dimensions of the three types of bearings tested here (CRTB1, CRTB2, and TBB) are shown in . The measured average roughness Rq of each bearing is shown in .
Figure 1. Schematic of the thrust bearing friction rig (adapted from Cousseau,et al. (Citation21)).
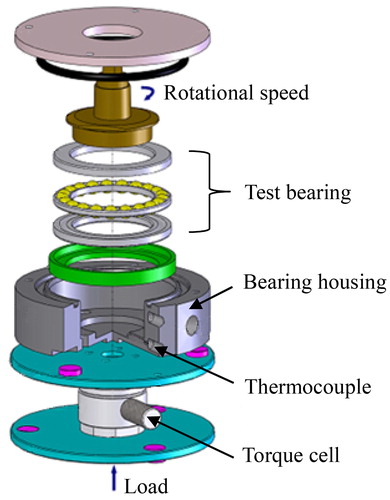
Table 2. Dimensions of three test bearing types.
Table 3. Surface roughness of rolling elements and washers of the test bearings.
Thrust bearing test procedure and conditions
Bearing friction torque measurements were done following two slightly different procedures: one where the test bearing temperature was allowed to increase continuously during the test as the bearing test speed was increased (procedure A) and another where the bearing temperature was controlled so that friction torque measurements at different speeds were performed at a fixed bearing temperature (procedure B).
Bearing tests conducted at self-induced temperatures (procedure A)
Test procedure A was followed to perform a series of tests using the TBB and the cylindrical roller thrust bearing (CRTB1). This procedure is in line with that described by Cousseau, et al. (Citation21), who originally utilized this experimental setup for bearing torque measurements. Prior to testing, all test bearings were ultrasonically cleaned in petroleum ether followed by isopropanol. The bearings were then filled with 4 ml of grease for each test, 2.0 ml on the bottom washer and 2.0 ml between the cage and the top washer. The 4 ml grease fill is in line with the recommendations provided in bearing manufacturer catalogues and was also confirmed to be a suitable amount in terms of ensuring a reasonable duration of the grease churning phase at start-up. A test load of 2,000 N was applied in all cases, corresponding to a maximum contact pressure in the rolling element–bearing washer contact of 1.49 GPa for TBB and 0.54 GPa for CRTB1. Prior to starting the actual test, greased bearings were run in for 4 h at the test load and speed of 800 rpm. This running-in period was designed to ensure that the initial grease churning phase was over so that the grease distribution at the start of torque measurements was representative of real bearing operation under these conditions. This was confirmed via continuous monitoring of bearing temperature and torque during the running-in phase, which showed that after 4 h of running under these conditions any significant fluctuations in the values of these parameters, which are indicative of the grease churning phase, were eliminated. The speed was then decreased to 200 rpm and a series of torque measurements was taken at gradually increasing speeds up to the maximum speed of 1,800 rpm. The speed range of 200–1,800 rpm corresponds to an entrainment speed [= 0.5(U1 + U2)] range of 228–2,050 mm s−1. Because the rig does not include any means of external cooling, the temperature of the test bearing naturally increased as the test speed increased. This complicated the interpretation of the results but is representative of real bearing operation. At each test speed, the bearing was run for about 1 h prior to taking the friction torque measurement in order to ensure that the equilibrium temperature was reached at each test speed. The test conditions used for procedure A are summarized in . Only the greases, and not their base oils, were tested under these conditions. With procedure A, 10 bearing torque measurements were performed at each test speed for each test lubricant. The results shown in this article at each speed are an average of these 10 measurements.
Table 4. Test conditions used for procedure A.
Bearing tests conducted at a constant temperature (procedure B)
A cylindrical roller thrust bearing (CRTB2) was employed for the second series of tests following procedure B. The test bearing conditions for these tests were chosen so that the resulting conditions in the element–washer contacts approximately matched those employed in the ball-on-disc friction tests previously published by us (Kanazawa, et al. (Citation16)). In these tests, the speed was decreased from 1,140 rpm down to 45 rpm, which is the lowest achievable speed of the bearing friction rig. This corresponds to the entrainment speed range of 1,000–40 mm s−1. This lower speed range than in procedure A above was deliberately chosen here in an attempt to make any differences in friction between different grease compositions, which are more likely to exist at lower speeds given the potential effects of thickener type, more apparent. It should be noted that this bearing speed range corresponds to relatively low values of bearing Ndm of about 40,000 and below (see ). A bearing load of 3,195 N was used, corresponding to a maximum Hertzian pressure in the roller–washer contacts of 0.80 GPa. The key difference between this test procedure and procedure A is that in this series of tests the bearing temperature was kept constant at 70 °C for all torque measurements. This was made possible by providing necessary heating to the housing through cartridge heaters as the test speed decreased from the maximum of 1,140 rpm down to the minimum of 45 rpm. The temperature was monitored by means of a thermocouple as shown in . The constant test temperature made it possible to directly compare the frictional performance of different test greases. As above, the bearings were ultrasonically cleaned in petroleum ether followed by isopropanol prior to testing and filled with 4.0 ml of grease in each case (2.0 ml on the bottom washer and 2.0 ml between the cage and the top washer) or a few drops of oil were applied directly to bearings in the case of base oil tests. Bearings were then mounted in the rig and the test load of 3,195 N was applied. As above, to ensure that the grease churning phase was over, the bearings were run in for a period of 4 h prior to starting the actual test procedure. The running-in was conducted at the load equal to the test load, speed of 1,140 rpm (the highest test speed employed), and temperature of 70 °C with heater power turned on as needed. The same running-in procedure was performed for oil tests. The bearing torque measurements were then carried out at a series of test speeds, starting with the highest speed of 1,140 rpm and then gradually decreasing speeds in logarithmic steps while keeping the test temperature constant at 70 °C. The test conditions used for procedure B are shown in . All greases in and their base oils were tested under these conditions. With procedure B, two separate test runs were performed with each lubricant. In each test run 10 bearing torque measurements were performed at every test speed. Each numerical value of torque shown in this article is an average of the 20 measurements thus obtained. The repeatability of the torque measurements was judged to be good, with the maximum relative standard deviation based on the 20 data points in each case being less than 10% for all lubricants tested.
Table 5. Test conditions used for procedure B.
Single-contact ball-on-disc tests (MTM and EHD rigs)
Ball-on-disc friction and film thickness measurements were carried out using the PCS Instruments MTM and elastohydrodynamic (EHD) rigs, respectively. These rigs are widely used in tribology and will not be described here in any great detail for the sake of brevity (the reader is referred to previous publications by the authors [De Laurentis, et al. (Citation14); Kanazawa, et al. (Citation16)] for a detailed description of the rigs as used in these studies). Both rigs employ a ball-on-disc setup with separate control of ball and disc speeds so that any slide–roll ratio can be reached. Test load, temperature, and entrainment speed are closely controlled. The MTM rig employs AISI 52100 steel ball and disc specimens and measures friction by means of a force transducer on the ball shaft, and the EHD rig employs a steel ball on a glass disc setup and uses the optical interferometry technique (Cann, et al. (Citation22)) to measure in-contact film thickness. In these tests, fully flooded conditions were enforced by employing the grease scoop, which channels the grease displaced by the overrolling action of the ball back into the rolling track. The test conditions for the ball-on-disc measurements are summarized in . Standard ¾-in. balls with Ra of ∼15 nm were used in both EHD and MTM tests, but three sets of discs with different roughness were used for the MTM friction tests, namely, ∼10, ∼100, and ∼200 nm Ra. The 100 nm Ra discs were close to the composite surface roughness of the tested CRTB bearings (see ). At low test speeds, and hence low EHL film thicknesses, there is obviously an increased potential for damage to the ball and disc surfaces during testing, particularly in the case of coated glass discs used in the EHD rig tests. To avoid any potential issues with this, both the MTM and EHD tests were conducted starting at the highest test speed and then gradually decreasing the speed to the lowest value tested.
Table 6. MTM friction and EHD film thickness test conditions.
Test results
Test results with TBB and CRTB1 (procedure A, self-induced bearing temperature)
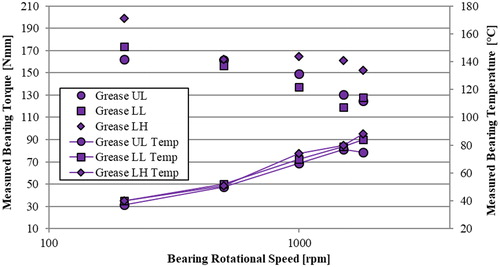
The measured bearing torque and bearing temperature obtained in tests with greases LL, UL, and LH following procedure A (self-induced temperature) are shown in for the TBB and in for CRTB1 as a function of bearing rotational speed. The bearing torque decreased and the temperature increased with increasing bearing speed with all greases and with both bearing types. It is evident that for a given bearing speed, tests performed with the TBB showed lower bearing torques, and consequently lower bearing temperatures, with all greases than the equivalent tests carried out with CRTB1. This is to be expected given the higher slide–roll ratios in the element–washer contacts existing in the CRTB1. The observed general trends in frictional behavior of different greases were consistent across the two bearing types. Namely, the greases with the low-viscosity base oil, LL and UL, showed lower bearing torques than the grease with the high viscosity oil, LH. Measured bearing temperatures were generally in line with this trend in that the measured temperatures for the greases that produced lower torque, LL and UL, were lower than those for the higher friction torque grease, LH, for a given set of test conditions.
Figure 2. Torque and temperature measurements with greases LL, UL, and LH obtained by following test procedure A with the TBB.
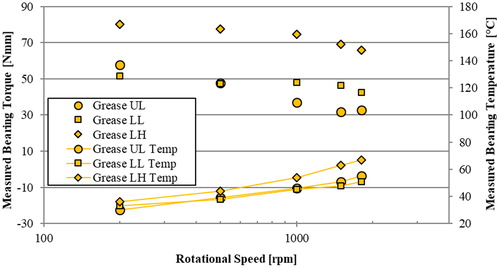
Figure 3. Torque and temperature measurements with greases LL, UL, and LH obtained by following test procedure A with CRTB1.
Test results with CRTB2 (procedure B, constant bearing temperature)
The results of bearing torque measurements obtained following procedure B (constant test temperature) with the cylindrical roller bearing CRTB2 are shown in . Both bearing rotational speed and the resulting entrainment speed for the roller–washer contact are shown in the plot. In general, bearing torque increased with decreasing rotational speed but distinct differences in behavior of the different lubricants were apparent.
Figure 4. Torque measurements with greases LL, UL, LH and their base oils L and H obtained by following test procedure B with CRTB2.
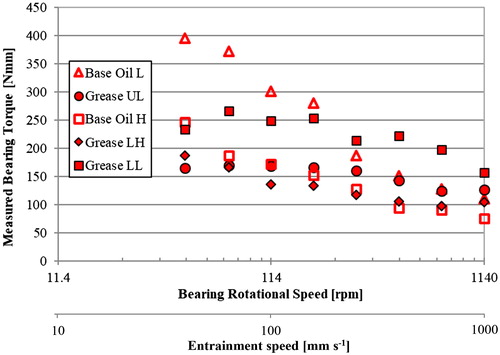
Considering the influence of base oil viscosity on the absolute value of grease friction, it is evident that under these test conditions the higher viscosity grease, LH, produces lower friction than the low-viscosity grease with the same thickener, LL. This difference was most apparent at lower speeds. Regarding the influence of thickener, the urea-thickened grease UL showed lower torque than the lithium complex–thickened grease LL at all speeds, despite the base oil L of these two greases being the same. This reduction was significant enough to bring the friction of urea-thickened low-viscosity grease to the level of the higher viscosity lithium complex–thickened grease within the low-speed region.
The high-viscosity grease LH showed frictional torque similar to that of its base oil H at all speeds tested here. Though low-viscosity greases LL and UL also showed friction similar to their base oil at higher speeds, their friction behavior clearly deviated from that of their base oil from about 100 rpm (∼100 mm s−1) and below. In this region, greases LL and UL showed much lower friction than that observed with their base oil L. The torque of these greases appeared to plateau at about 100 mm s−1 and even decreased slightly as speed was further reduced. Of course, it is possible that at even lower speeds or higher surface roughnesses the high-viscosity grease LH friction would also deviate from that of its base oil, but such conditions cannot be reached on the present rig and are perhaps of less practical significance in any case.
Test results with ball-on-disc single-contact experiments
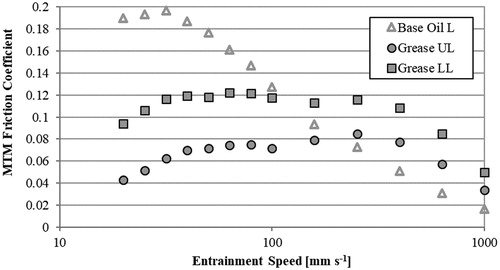
Results of the MTM friction tests and optical EHD film measurements with the current greases were previously reported in detail (Kanazawa, et al. (Citation16)). Therefore, only a selection of relevant results is presented here to allow for a direct comparison with the bearing tests. plots the MTM friction measurements of greases UL, LL and their base oil in tests where MTM disc Ra = 100 nm (i.e., composite roughness similar to that in the CRTB bearing tested above). Trends similar to those observed in the CRTB2 bearing torque results () are evident. Urea-thickened UL grease showed lower friction than the equivalent lithium complex–thickened LL grease at all speeds in the MTM tests, as was the case in the CRTB2 bearing tests. At speeds higher than about 100 mm s−1, both greases UL and LL displayed friction trends similar to those of their base oil, L, but below this speed their friction coefficient deviated from that of their base oil: it plateaued at around 100 mm s−1 and then decreased with decreasing speed from about 50 mm s−1 downwards, whereas the base oil friction continued to increase with decreasing speed in this region. It is interesting to note that this deviation in frictional behavior between the greases and their base oil occurred at around the same entrainment speed of 100 mm s−1 in the CRTB2 bearing tests as well (see ).
Figure 5. MTM friction measurements with greases UL, LL and their base oil L with disc Ra of 100 nm (maximum Hertzian contact pressure = 0.56 GPa, temperature = 70 °C, slide–roll ratio = 0.1).
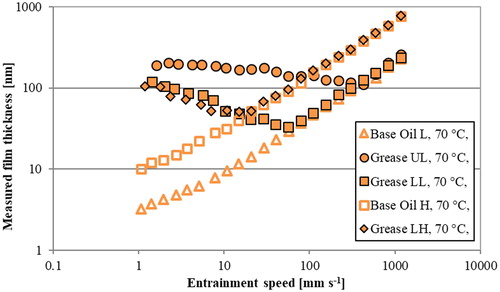
shows the film thickness measurements on the optical EHD rig with the low- and high-viscosity lithium complex greases (LL and LH, respectively), the low-viscosity urea grease (UL), and the two base oils (L and H). The film thickness of both oils is seen to fall on a straight line on this log–log plot and the higher viscosity oil produced thicker films than the lower viscosity oil, all of which may be expected from the EHD theory. However, it is immediately apparent that the film thickness with all greases deviated from this straight line so that at a certain value of film thickness the grease films did not decrease further with decreasing speed. The film thickness at which this deviation occurred was determined by the thickener type; for example, the lithium complex greases LH and LL both started to deviate from their respective base oil curves at a value of film thickness equal to about 30–50 nm, whereas the urea-thickened grease, UL, started to deviate from its base oil behavior at the film thickness of around 100 nm Furthermore, it is evident that this deviation of grease and oil behavior did not occur at a fixed speed as is often implied by the use of the term “transition speed” (Cen, et al. (Citation12, Citation13)) but at a fixed film thickness; that is, a “transition film thickness” is a much more appropriate term to describe this behavior, as suggested in Kanazawa, et al. (Citation16). This observation is in line with the mechanism of grease film buildup previously put forward by in Kanazawa, et al. (Citation16), which states that the transition from the thickener-dominated region to the oil-dominated region occurs when the film thickness that would be generated with pure base oil alone exceeds the characteristic size of the given thickener fibers and that such grease film behavior is analogous to that of colloidal suspensions (Kanazawa, et al. (Citation16); Chiñas-Castillo and Spikes (Citation23)). In addition, the absolute value of the film thickness to the left of the transition point was totally determined by the thickener and not influenced by the viscosity of the oil at all, as evidenced by the fact that the film thickness with high- and low-viscosity lithium complex greases (LL and LH, respectively) overlapped in this region. In contrast, to the right of the transition point, the film thickness was determined primarily by the base oil and the thickener had no obvious influence (greases UL and LL clearly had the same film thickness at all speeds to the right of the transition point). Finally, the urea grease, UL, produced much thicker films than the two lithium complex greases, LL and LH, within the said thickener-dominated region.
Figure 6. Film thickness results from the optical EHD rig with greases UL, LL, LH and their base oils, L and H (maximum contact pressure = 0.56 GPa, temperature = 70 °C, slide–roll ratio = 0.1).
Discussion
Influence of grease composition on bearing torque
All presented results show consistent trends in terms of the influence of grease composition on bearing friction. Low-viscosity diurea grease UL generally produced lower friction than the lithium complex grease formulated with the same base oil LL. This was apparent in the tests with procedure A (self-induced test temperature) with the TBB () and in tests with procedure B (controlled test temperature) with the cylindrical roller thrust bearing (). The UL friction was also lower than that recorded with its base oil alone (). The exact same trends were observed in the MTM friction tests (). This suggests that MTM friction results can be used for the relative ranking of bearing greases in terms of their expected friction performance in full bearings, at least for the grease types and test times applied here.
In , which shows results with the CRTB2 bearing under a controlled temperature of 70 °C, the friction recorded with the diurea grease UL was of a level similar to that recorded with the higher viscosity lithium complex grease, LH, throughout the speed range, whereas the low-viscosity lithium complex grease, LL, and the low-viscosity oil, L, produced much higher friction than both of these. These differences were clearly apparent at low bearing speeds but started to diminish as the speed increased so that at highest speeds the friction values measured with all greases and base oils were relatively close. This seems to suggest that the observed trends in friction performance may be related to the relative ability of these greases to form satisfactory films under low-speed conditions. The EHL film thickness measurements shown in indeed show that urea-based grease with low-viscosity oil UL produces thicker films than the equivalent lithium complex grease LL or its base oil L, which is the likely reason for its superior friction performance under conditions where the nominal lambda ratios (i.e., those based on EHL theory and base oil properties alone) would be expected to be low (such as those in ). In fact, the EHD film thickness measurements shown in indicate that at this test temperature the UL film thickness remained above 100 nm regardless of the test speed. Given that the CRTB2 Rq roughness was about 110 nm, this means that with UL grease the effective lambda ratio for CRTB2 tests shown in remained at 1 and above. Using the same logic, the minimum lambda for LL and LH greases was about 0.6 and 0.7 in the same CRTB2 tests, which may intuitively be expected to result in slightly higher friction. At very low entrainment speeds, LL and LH greases had the same film thickness so may be expected to have similar bearing torque under these conditions. Inspection of indeed shows that the friction torque curves of these two greases converged toward each other as the bearing speed decreased; the bearing test speeds employed in unfortunately did not go low enough, the lowest being about 45 rpm, to assess whether LL and LH friction torques eventually equalled each other exactly.
This qualitative comparison suggests that the single-contact friction and film measurements using the MTM and optical EHD rigs, respectively (results shown in ), may be representative of those found in real bearings, at least in terms of the relative behavior of different greases and for conditions employed here, namely, relatively low bearing Ndm and short duration of bearing operation (at significantly higher bearing speeds and/or longer bearing operation times, other effects such as grease degradation and/or differences in the actual grease distribution in the bearings may become more dominant). Following these observations in terms of the relative performance of greases, the next section will attempt to formalize this comparison by exploring whether the actual quantitative values of friction measured in ball-on-disc rigs can be used to predict the bearing torque for a given grease.
Quantitative comparison between friction coefficient in full bearings and ball-on-disc tribometer
The discussion above shows that the relative trends in the performance of different greases were the same in the single-contact MTM tests and the selection of bearings tested here. This is a useful finding because it confirms that the single-contact tests, which are relatively inexpensive and fast, can be used to rank greases in terms of their frictional performance in bearings. However, it does not show whether or not the actual quantitative values of friction measured in the single-contact MTM test bear any resemblance to bearing frictional torque. In order to assess whether this is the case, further analysis of the results is needed to ensure a like-for-like comparison.
The discussion above also suggests that the grease film thickness and friction were closely linked in both bearing and MTM tests. Therefore, it seems sensible to compare the results of all bearing tests and all MTM tests in terms of the friction coefficient plotted against specific film thickness. Such a comparison is possible because film thicknesses with the present greases and oils were already measured over a range of conditions (see and Kanazawa, et al. (Citation16)). Although ambitious, this approach provides an exhaustive comparison of the two sets of results because it encompasses all greases and tests and the whole range of operating conditions (including different surface roughnesses of bearings and MTM discs) so that some widely applicable conclusions may be drawn. To achieve this comparison, the following is needed: (Citation1) mapping of the film thickness values measured in the single-contact optical EHD rig onto the bearing operating conditions and (Citation2) calculation of the friction coefficients from measured bearing torque values so that these can be directly compared to the MTM-measured friction coefficients.
Estimating the film thickness in bearing tests from the optical EHD rig film measurements
The specific film thickness, or lambda value (λ), is the ratio of the lubricant central film thickness (hc) to composite Rq surface roughness as defined in Eq. [1]:
[1]
[1]
The Rq values for each bearing are known (), as are those for the MTM specimens.
The nominal central film thickness values for bearing tests can be estimated using the Hamrock-Dowson equation (Hamrock and Dowson (Citation17)) using the properties of the base oil, as is commonly done for grease-lubricated contacts. However, this is clearly erroneous because grease film thickness is known to deviate from EHD theory for oils at low speeds, as is clearly evident in and previously suggested by multiple authors (Cen, et al. (Citation12); De Laurentis, et al. (Citation14); Kanazawa, et al. (Citation16); Cann (Citation19)). However, because film thickness was measured with the current greases in the optical EHD rig over a range of conditions, these measured values can be used to determine the film thickness under bearing operating conditions more accurately. We have already shown (Kanazawa, et al. (Citation16)) that MTM grease friction does not follow the usual shape of the Stribeck curve when plotted against the nominal lambda ratio (i.e., when grease film thickness is predicted using the base oil properties) but does generally follow the accepted Stribeck curve shape when plotted against the actual lambda ratio (i.e., when measured grease film thickness values are used). The film thickness with greases was measured on the optical EHD rig, which employs a ¾-in. steel ball on a glass disc contact. Therefore, to estimate the film thickness in the MTM tests (¾-in. steel ball on steel disc) and different bearing tests (steel on steel with different geometry), appropriate conversion factors need to be applied to account for different relative radii of the contact, any difference in contact load, and different elastic properties of the materials. To derive these factors, Hamrock and Dowson’s EHL film thickness equation can be used. This equation states that
[2]
[2]
where C is a constant, hc is the central film thickness, E′ is the reduced Young’s modulus of the contact, w is the applied contact load, Rx is the relative radius of contact in the rolling direction, and k is the ratio of the relative radius in transverse and rolling directions (k = Ry/Rx).
Based on this equation, the conversion from the optical EHD rig film thickness to that on the MTM is straightforward because only the E′ values are different. Given the steel–glass contact in the EHD rig and the steel–steel contact on the MTM, one can derive that
[3]
[3]
The conversion to bearing conditions is somewhat more involved because it needs to additionally account for different contact geometry of the rolling element–washer contact as well as different contact loads. Substituting the appropriate values of these parameters for the CRTB2 bearing tests (see for bearing dimensions and for bearing operating conditions versus for EHD rig contact geometry and operating conditions) results in the following relationship:
[4]
[4]
These two equations make it possible to obtain estimates of the actual film thickness values for bearing and MTM tests using the film thickness values measured on the optical EHD rig for all tested greases and oils. It should be noted that the use of the measured film thickness values, as opposed to calculated films using EHD theory and base oil properties, is only necessary within the thickener-dominated region of lower speeds (see ); at higher speeds the grease and oil films are the same (), so both approaches give the same result. With this in mind, the film thickness for tests with bearings CRTB1 and TBB following procedure A, where all test speeds and temperatures are such that the contacts are operating within the high-speed region where grease and oil film thickness is the same, can simply be calculated using base oil properties at the actual test temperatures and bearing operating conditions. On the other hand, for bearing tests with CRTB2 in procedure B, which cover much lower speeds, it is necessary to apply the above film thickness conversion using EHD film thickness values measured at 70 °C (i.e. the same temperature as that used for the CRTB2 bearing tests)..
Deriving the friction coefficient from measured bearing torque
To provide the intended comparison between the ball-on-disc measurements and tests with full bearings, it is also necessary to convert the measured bearing torques to friction coefficients. Total bearing torque encompasses different sources of losses. Following the widely used SKF model of bearing friction torque (SKF (Citation24); Morales-Espejel (Citation25)), the total bearing torque Mtot can be broken down into a series of components as
[5]
[5]
where Msl is the sliding torque, Mrr is the rolling torque,
is the inlet shear heating reduction factor,
is the kinematic replenishment/starvation factor, Mseal is the frictional moment generated by the seal, and Mdrag is the contribution to the total torque produced by drag losses.
The bearings tested in this work do not have seals, so Mseal is not present at all. The model stipulates that Mdrag be ignored for grease lubrication and only considered for oil lubrication, but given the deliberately small amount of oil employed in the present tests Mdrag can be neglected here even for the tests with oil. Therefore, bearing torque in the present tests can be expressed as
[6]
[6]
As standard, the MTM rig measures the friction coefficient by taking two successive measurements at the set absolute value of the slide–roll ratio, one with the disc rotating faster than the ball and the other with the ball rotating faster than the disc. The recorded friction is then half the absolute difference between the two measurements. This approach improves the accuracy of friction measurements because it removes any potential offset in the force transducer attached to the ball drive shaft. It also cancels any contribution of rolling friction, although this is almost negligible under the current MTM test conditions (de Vicente, et al. (Citation26)). Because the churning friction is also negligible in the single-contact MTM tests, the grease friction obtained from the MTM ball-on-disc tribometer is equivalent to the sliding friction component in the bearing. Therefore, to make a valid comparison between the MTM and full bearing results, it is necessary to extract the sliding component of bearing torque from the overall measured torque. This can be done by following the approach of Cousseau, et al. (Citation10) through rearranging Eq. [6] so that
[7]
[7]
where Mtotm is the measured torque, Mrr is the rolling torque calculated from the torque model, and Mslr is the residual sliding torque. This residual sliding torque can then be converted to actual friction coefficient in the bearing by using a simple relationship:
[8]
[8]
where dm is the mean diameter of the bearing and Fa is the applied bearing load.
Master Stribeck curves including ball-on-disc and bearing tests
Using the values of film thickness and bearing friction coefficient calculated following the procedure outlined above, it is possible to make a direct comparison between measurements in full bearings and in the ball-on-disc MTM rig.
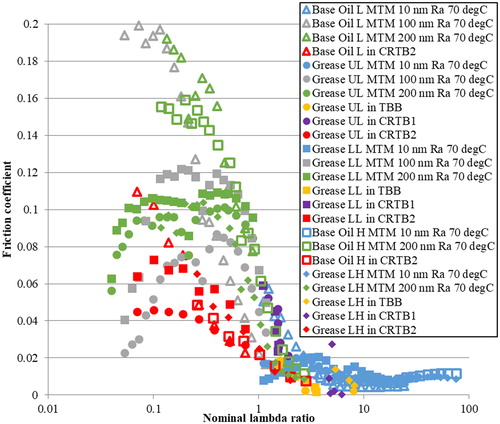
shows a plot of friction coefficient against the nominal lambda ratio (i.e., the lambda ratio calculated using EHL theory and base oil properties) encompassing all MTM and bearing tests and all lubricants employed here. The graph deliberately contains a large set of results to provide a comprehensive comparison. For ease of reference, the color of the markers indicates the test type (MTM, CRTB1, CRTB2, or TBB), and the shape of the markers indicates the lubricant. All MTM and CRTB2 tests plotted here were conducted at 70 °C; the test temperatures for CRTB1 and TBB data were those shown in and and the effect of this temperature on film thickness has been accounted for. It is immediately apparent that at low nominal lambda ratios, both lithium complex LL and urea UL greases deviate significantly from the standard Stribeck curve shape: not only do the values of friction coefficients for these greases fall below those of their base oils but the friction curves with different greases do not overlap either. This is true regardless of the test type, both MTM and bearing tests show a similar deviation. The trends are similar to those seen above for grease friction versus entrainment speed as may be expected given that the calculated lambda values scale with entrainment speed to power of about 0.7.
Figure 7. Friction coefficient plotted against the nominal lambda ratio; that is, the lambda ratio calculated using EHD theory and base oil properties. All bearing tests and MTM tests at 70 °C are included.
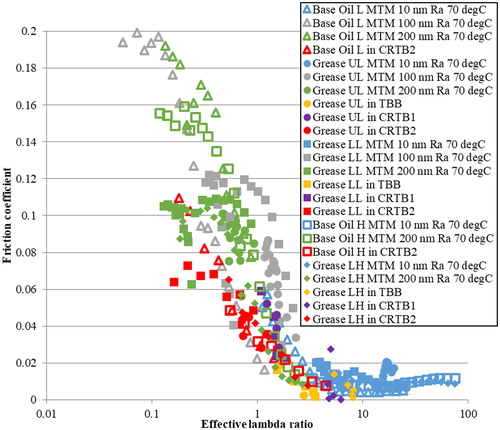
shows the same friction coefficient values but plotted against the effective lambda ratio; that is, the lambda ratio derived from measured grease film thicknesses using the mapping outlined above. The same scheme for marker color and shape employed in is used for ease of reference. In this case, results generally fall on the same ‘master Stribeck’ curve. Some deviations from the overall trend are apparent, the most significant of which appear to be that the friction with the low-viscosity lithium complex grease LL in the CRTB2 bearing and that in the MTM tests with disc Ra of 100 nm lie respectively slightly below and above of the general trend. However, given the large number of different lubricants, test types, and test conditions represented in this graph, the fact that the overall trend clearly follows the same curve is encouraging. This correlation indicates that grease friction measurements obtained in the ball-on-disc MTM tests are representative of friction in real bearings over a wide range of conditions and grease formulations, not only in terms of relative trends but also in terms of quantitative values. The observations are based on relatively short-term bearing operation, and other factors may come into play for extended bearing operation times, such as the actual distribution of grease in the bearing established over time and grease aging, but MTM ball-on-disc tests are not intended to simulate these long-term effects in any case, so the comparison should not be expected to account for their potential effects.
Figure 8. Friction coefficient plotted against the effective lambda ratio; that is, the lambda ratio based on measured grease film thicknesses. All bearing tests and MTM tests at 70 °C are included.
Conclusions
This work investigated the frictional behavior of different grease formulations in rolling bearings and single-contact ball-on-disc rigs and subsequently assessed whether the performance of greases in the ball-on-disc tests is representative of that in real bearings. The study employed custom-made greases with systematically varied formulations designed to isolate the effect of thickener (diurea and lithium complex) and base oil viscosity on grease frictional performance. Bearing torque was measured with all greases and their base oils in two different cylindrical roller thrust bearings and a thrust ball bearing. Friction was also measured in the MTM ball-on-disc rig and film thickness was measured using an optical EHD rig with the same greases and base oils. The main observations can be summarized as follows:
• The frictional behavior of both diurea and lithium complex greases deviates from that of their base oils at low nominal lambda ratios (i.e., lambda ratios calculated using EHD theory and base oil properties only); in this region greases produce lower friction than their base oils. At higher nominal lambda values, greases and oils have similar friction behavior and thus follow the trend of a classical Stribeck curve for an oil. These trends were the same in full bearing and single-contact ball-on-disc tests.
• The observed relative frictional performance of greases was shown to be related to their film-forming ability, specifically the level of film thickness enhancement at low nominal lambda ratios provided by different thickeners. Both lithium complex and particularly diurea greases were seen to form thicker films than their base oils in this region, resulting in higher effective lambda ratios (i.e., lambda ratios derived from measured grease film thickness values) and therefore lower friction coefficients.
• When plotted against the effective lambda ratio, the sliding friction coefficient values obtained in all bearing and all MTM tests and with all lubricants fall onto a ‘master Stribeck’ curve.
These observations suggest that through appropriate interpretation of results, the single-contact ball-on-disc friction tests can be used to assess the frictional performance of greases in full bearings at least over the range of bearing conditions employed here. This is true in terms of both the relative ranking of different grease compositions as well as the actual quantitative estimates of bearing friction torque. The ball-on-disc tests can therefore provide a fast and economical means for early development of low-friction bearing grease formulations.
Acknowledgement
Kyodo Yushi Co., Ltd. are gratefully acknowledged for supplying the test greases.
Additional information
Funding
References
- Lugt, P. M. (2013), Grease Lubrication in Rolling Bearings, John Wiley & Sons, Chichester, UK.
- Cen, H. and Lugt, P. M. (2019), “Film Thickness in a Grease Lubricated Ball Bearing,” Tribology International, 134, pp 26–35.
- Wikström, V. and Höglund, E. (1996), “Starting and Steady-State Friction Torque of Grease-Lubricated Rolling Element Bearings at Low Temperatures—Part I: A Parameter Study,” Tribology Transactions, 39(3), pp 517–526.
- Wikström, V. and Höglund, E. (1996), “Starting and Steady-State Friction Torque of Grease-Lubricated Rolling Element Bearings at Low Temperatures—Part II: Correlation with Less-Complex Test Methods,” Tribology Transactions, 39(3), pp 684–690.
- Muennich, H. C. and Gloeckner, H. J. R. (1980), “Elastohydrodynamic Lubrication of Grease-Lubricated Rolling Bearings,” A S L E Transactions, 23(1), pp 45–52.
- Wilson, A. R. (1979), “The Relative Thickness of Grease and Oil Films in Rolling Bearings,” Proceedings of the Institution of Mechanical Engineers, 193, pp 185–192.
- Cousseau, T., Graça, B., Campos, A., and Seabra, J. (2010), “Experimental Measuring Procedure for the Friction Torque in Rolling Bearings,” Lubrication Science, 22(4), pp 133–147.
- Cousseau, T., Graça, B., Campos, A., and Seabra, J. (2011), “Friction Torque in Grease Lubricated Thrust Ball Bearings.” Tribology International, 44(5), pp 523–531
- Cousseau, T., Graça, B. M., Campos, A. V., and Seabra, J. H. O. (2010), “Influence of Grease Formulation on Thrust Bearings Power Loss,” Proceedings of the Institution of Mechanical Engineers - Part J: Journal of Engineering Tribology, 224(9), pp 935–946.
- Cousseau, T., Graça, B. M., Campos, A. V., and Seabra, J. H. O. (2012), “Influence of Grease Rheology on Thrust Ball Bearings Friction Torque,” Tribology International, 46(1), pp 106–113.
- Cann, P. M. (1999), “Starved Grease Lubrication of Rolling Contacts,” Tribology Transactions, 42(4), pp 867–873.
- Cen, H., Lugt, P. M., and Morales-Espejel, G. (2014), “On the Film Thickness of Grease-Lubricated Contacts at Low Speeds,” Tribology Transactions, 57(4), pp 668–678.
- Cen, H., Lugt, P. M., and Morales-Espejel, G. (2014), “Film Thickness of Mechanically Worked Lubricating Grease at Very Low Speeds,” Tribology Transactions, 57(6), pp 1066–1071.
- De Laurentis, N., Kadiric, A., Lugt, P., and Cann, P. (2016), “The Influence of Bearing Grease Composition on Friction in Rolling/Sliding Concentrated Contacts,” Tribology International, 94, pp 624–632.
- De Laurentis, N., Cann, P., Lugt, P. M., and Kadiric, A. (2017), “The Influence of Base Oil Properties on the Friction Behaviour of Lithium Greases in Rolling/Sliding Concentrated Contacts,” Tribology Letters, 65(4), pp 128.
- Kanazawa, Y., Sayles, R. S., and Kadiric, A. (2017), “Film Formation and Friction in Grease Lubricated Rolling–Sliding Non-Conformal Contacts,” Tribology International, 109, pp 505–518.
- Hamrock, B. J. and Dowson, D. (1978), “Elastohydrodynamic Lubrication of Elliptical Contacts for Materials of Low Elastic Modulus I—Fully Flooded Conjunction,” Journal of Tribology, 100(2), pp 236–245.
- Gonçalves, D., Graça, B., Campos, A. V., Seabra, J., Leckner, J., and Westbroek, R. (2015), “On the Film Thickness Behaviour of Polymer Greases at Low and High Speeds,” Tribology International, 90, pp 435–444.
- Cann, P. M. (2007), “Grease Lubrication of Rolling Element Bearings—Role of the Grease Thickener,” Lubrication Science, 19(3), pp 183–196.
- Gonçalves, D., Graça, B., Campos, A. V., and Seabra, J. (2016), “On the Friction Behaviour of Polymer Greases,” Tribology International, 93(Part A), pp 399–410.
- Cousseau, T., Graça, B., Campos, A., and Seabra, J. (2010), “Experimental Measuring Procedure for the Friction Torque in Rolling Bearings,” Lubrication Science, 22(4), pp 133–147.
- Cann, P. M., Spikes, H. A., and Hutchinson, J. (1996), “The Development of a Spacer Layer Imaging Method (SLIM) for Mapping Elastohydrodynamic Contacts,” Tribology Transactions, 39(4), pp 915–921.
- Chiñas-Castillo, F. and Spikes, H. A. (2003), “Mechanism of Action of Colloidal Solid Dispersions,” Journal of Tribology, 125(3), pp 552–557.
- SKF. (2013), Rolling Bearings Catalogue 10000 EN, SKF Group, Sweden.
- Morales-Espejel, G. (2006), “Using a Friction Model as an Engineering Tool,” Evolution SKF, 6(2), pp 27–30.
- de Vicente, J., Stokes, J. R., and Spikes, H. A. (2005), “The Frictional Properties of Newtonian Fluids in Rolling–Sliding Soft-EHL Contact,” Tribology Letters, 20, pp 273–286.