
 ?Mathematical formulae have been encoded as MathML and are displayed in this HTML version using MathJax in order to improve their display. Uncheck the box to turn MathJax off. This feature requires Javascript. Click on a formula to zoom.
Abstract
To increase the efficiency of a gearbox, research on gear mesh loss is of importance. Britton et al. concluded that the surface finishing method affects the gear mesh efficiency. The efficiency benefits of superfinishing a surface and reducing the surface roughness have been reported by Kahraman. A novel method for calculating the bearing loss torque was proposed by Tu et al. Andersson et al. found that the efficiency can vary between 2 and 5% during repeated efficiency tests due to variations in the assembly process. This work investigates how the honing surface finishing process and DIN 3962 quality class affect the gear mesh efficiency by performing tests in an FZG back-to-back test rig. Two materials, a powder metal and a wrought steel, were tested. All gears were finished using a honing process and sorted according the measured quality class. Powder metal gears of class 6, 7, 8, and ≥9 and wrought steel gears of class 6, 7, and ≥9 were tested. The efficiency were calculated from measuring the torque required to maintain a constant velocity of the FZG test rig. The results from the efficiency tests showed no significant difference in efficiency between the wrought steel and powder metal steel gears. In addition, no obvious correlation between the DIN 3962 quality class and the gear mesh efficiency could be found. When examining the wrought steel material it was found that the reproducibility of the efficiency was comparable to the assembly error of the test rig, despite the variation in quality class.
Keywords:
Introduction
In a time when global warming poses imminent threat to humanity, every action to decrease the emission of greenhouse gasses is of importance. One way to decrease emissions is to use power transmissions more effectively. Gears are an effective way of transferring mechanical power but there are losses in the gear mesh contact. Multiple factors influence the gear mesh efficiency, such as material (Citation1) and surface roughness (Citation2).
A new and emerging field in gear manufacturing is gears made from powder metallurgy (PM) materials. This method of producing gears shows potential of reducing the cost and the number of processing steps (Citation3) compared to traditional gear manufacturing (Citation4). Powder metal gears can be made to near-net-shape by filling a gear-shaped cavity with metal powder, compacting the powder using a pressing stamp, and fusing the particles in a diffusion-based sintering process (Citation5).
In recent decades, advances in technology such as warm pressing (Citation5) and new alloying systems have reduced the performance gap between sintered and conventional wrought steel gears. Nevertheless, powder metal steel has limitations in highly loaded applications. This is mainly due to the inherent porosity of the material, as the pores reduce the mechanical properties of the material (Citation5). The pores degrade the mechanical properties in multiple ways. Pores are irregular in size and shape and can have sharp edges and could therefore be considered as material defects. Defects, especially those with sharp edges, can cause stress concentrations, which serves as crack initiation points inside the material (Citation6).
The relative density of the powder metal material will also influence several mechanical properties. The dynamic Young’s modulus, hardness, and tensile strength of powder metal steel are shown to have a roughly linear relation to the relative density (Citation7, Citation8).
A common way of assessing the dimensional tolerance of gears is by assigning a quality class. The DIN 3962 (Citation9) standard defines a range of parameters for the gear, gear tooth, and gear flank surface. A lower quality class indicates a higher geometric accuracy, thus increasing the tolerance requirements on secondary operations; for example, machining and surface finishing. There are a number of parameters in the DIN 3962 gear standard that determine a gears final quality class. According to the standard, the form deviations of the gear are measured on at least three teeth, evenly spaced around the gear. For each parameter measured there is a corresponding quality class range in the standard. In evaluation of the gear, the final quality class is simply determined by the parameter with the worst quality.
To be able to optimize the cost in relation to the gear mesh efficiency, the effect of the quality class needs to be evaluated. A good surface finish with tight tolerances is costly to achieve (Citation10). Previous studies on ground and superfinished gears have concluded that the surface finishing method affects the gear mesh efficiency (Citation11, Citation12). This article seeks to investigate whether the DIN 3962 quality class can be related to the gear mesh efficiency and whether there are any differences in the efficiency of honed powder metal and wrought steel gears.
Material and methods
Test equipment
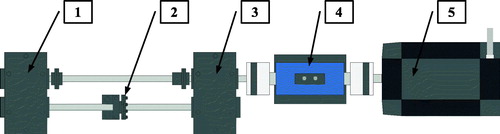
The efficiency measurements were performed on an FZG back-to-back gear test rig (Citation13) configured for measuring efficiency; see . The test rig consist of a test gearbox [1] and a slave gearbox [3], which are connected by two shafts. The gearboxes are identical in all regards except that the test gearbox has one less axle shaft seal than the slave gearbox. The gears are mounted on the first shaft and the pinions are mounted on the second. The pinion shaft is divided by a load coupling [2], enabling loading of the power loop. A motor [5] drives the power loop to the desired speed. As the power in the FZG rig is circulating, the motor only needs to supply the torque equal to the total losses in order to maintain the desired rotational speed. A torque sensor [4] is used to measure the torque applied by the motor. The load torque in the inner power loop is measured using a strain gauge on the pinion shaft. The reading from the strain gauge was used to verify that each test was loaded to the same specified torque.
Figure 1. Schematic of the FZG back-to-back test rig: 1, test gearbox; 2, load coupling; 3, slave gearbox; 4, torque sensor; 5, motor. Source: The figure is created by Edwin86bergstedt and is not altered. The figure is licensed under the Creative Commons Attribution-Share Alike 4.0 International license, https://creativecommons.org/licenses/by-sa/4.0/deed.en
For each test performed a new set of gears was used. This requires partial dismounting of the test rig. The motor and torque sensor were removed in order to change gears in the slave gearbox. The gears in the test and slave gearboxes were changed by removing the top and side panels of the gearboxes. After the gears were changed the test rig was reassembled. The test rig was disassembled and reassembled in the same order every time, because previous work by Andersson et al. (Citation14) showed that the rebuild of the FZG test rig can affect the efficiency measurements. Andersson et al. (Citation14) concluded that the reproducibility was between 2.42 and 5.04% in the speed range 0.5 to 20 m/s, where reproducibility is the standard deviation divided by the mean value. Therefore, any measured difference in efficiency among the samples in a group needs to be larger than the natural scatter of the assembly process in order to be deemed significant.
The gearboxes were filled with a polyalphaolefin lubricant up to the center of the shaft, corresponding to a volume of 1.5 L. The polyalphaolefin lubricant had a specified nominal viscosity of 64.1 mm2/s (cSt) at 40 °C and 11.8 mm2/s (cSt) at 100 °C.
Calculating the gear mesh efficiency
Because the FZG test rig is a circulating power loop, the losses in the FZG rig are assumed to be equal to the torque supplied by the motor to maintain a constant velocity. The losses in the closed power loop can be classified as either load dependent or load independent.
Load-dependent losses are losses that change with the load; that is, bearing losses and losses in the gear mesh. Load-independent losses are losses that occur independent of the applied load, such as oil churning losses and losses related to the bearing seals. The total loss is equal to the sum of the load-dependent and the load-independent loss torque, shown in EquationEq. [1][1]
[1] :
[1]
[1]
To obtain the load-dependent gear mesh losses, the bearing losses and the load-independent losses have to be subtracted from the total loss. The load-independent losses were obtained for each tested speed by running the FZG rig with no applied torque inside the power loop.
EquationEquation [2][2]
[2] was used to calculate the efficiency of one gearbox. The measured torque loss was divided by the product of the gear ratio (u) and the nominal torque transferred by the pinion (T1); to obtain the efficiency for one gearbox the ratio is multiplied by 0.5. The value for T1 was given by the applied load in the inner power loop, and the load was assumed to remain constant during the experiment.
[2]
[2]
There are many available models for estimating the bearing losses. SKF Industries (Citation15) has developed one commonly used model for the NJ 406 cylindrical roller bearings used in the FZG rig. In this work, the STA bearing model (Citation16) developed at KTH was used, shown in EquationEq. [3][3]
[3] , where n is the rotational speed and the parameters A, B, and C are determined experimentally and depend on load, temperature, lubricant, and bearing type. The parameters for A, B, and C used in this study are provided in .
[3]
[3]
Table 1. Constants for A, B, and C in dip lubrication.
The bearing torque loss are calculated using EquationEq. [4][4]
[4] , where ω1,2 is the ingoing angular speed of the pinion and gear shafts:
[4]
[4]
By subtracting the bearing torque loss from the load-dependent losses, the gear mesh loss torque is obtained as shown in EquationEq. [5][5]
[5] .
[5]
[5]
The gear mesh efficiency is calculated using EquationEq. [6][6]
[6] .
[6]
[6]
Test specimens
In this test the gears were produced from two types of materials, a wrought steel material commonly used for gears and a commercial powder metal material. The wrought steel used is 16MnCr5, and the composition of the wrought steel and powder metal steel are provided in .
Table 2. Chemical composition of the wrought steel and powder metal materials.
The gears from the wrought steel material were generated in a traditional manner through various machining operations. The powder metal material, on the other hand, was produced to near-net-shape by compacting and sintering metal powder. All gears were case hardened to a surface hardness of 800 Hv0.1. The heat during the hardening process distorts the surface; therefore, to obtain the desired form and surface roughness a finishing operation was performed.
For this study, all gears were first ground and later finalized using a honing process. The geometry of the gears is a standard FZG PT-C gear with the inclusion of a tip relief of 20 μm, starting at a diameter of 80.3 and 115.9 mm for the pinion and gear, respectively. Complete specification of the gear parameters was published by Sjöberg et al. (Citation12).
Test plan and procedure
The test plan was designed in accordance with the available gears. Ideally three sets of gears are tested for each material and quality class. The quality class of the available gears posed a limitation; the number of tests per material and quality class is provided in . There were no wrought steel gears available with quality class 8. One test per material was performed using gears of the worst quality class available, denoted in as quality class ≥9. These two tests were made to obtain data for gears with extremely poor geometrical tolerances.
Table 3. Number of gears tested and the quality class for the wrought steel and powder metal materials.
The efficiency test procedure is the same as used previously by Li et al. (Citation1). The running-in procedure was performed by running the gears for four hours at a pitch line velocity of 0.5 m/s. The pitch line torque in relation to the pinion shaft was set to 94 Nm during running-in. This was done to be compliant with previous work using running-in loads of either 94 or 302 Nm (Citation17).
The oil temperature in the gearboxes was held at 90 °C (+4 to −1 °C). During running-in, the speed, outside loss torque, and temperature data for the gearboxes were recorded at a sample rate of 1 Hz.
The efficiency test procedure was repeated four times with applied pitch line torques of 0, 61, 94, and 183 Nm. For each load, the efficiency tests were performed in 5-min sequences, one for each of the eight pitch line velocities tested: 0.5, 1, 2, 3.2, 8.3, 10, 15, and 20 m/s. Each efficiency test was repeated three times using new gears in both gearboxes when possible.
Surface characterization
The tooth profile was measured in situ using a stylus profilometer, using a stylus with a tip radius of 2 μm see . The in situ methodology was developed by Sosa et al. (Citation18). A mounting bracket was bolted to the test gearbox, were two 3-mm guiding pins ensured an accurate positioning. The instrument was placed and secured to the bracket using straps. The bracket featured a positioning system that allowed adjustment in the width direction of the gear tooth with an accuracy of ±5 µm. Hence, the position of the measurements on the gear tooth can be determined with good accuracy.
Figure 2. Overview of the in situ setup for measuring the gear flank.
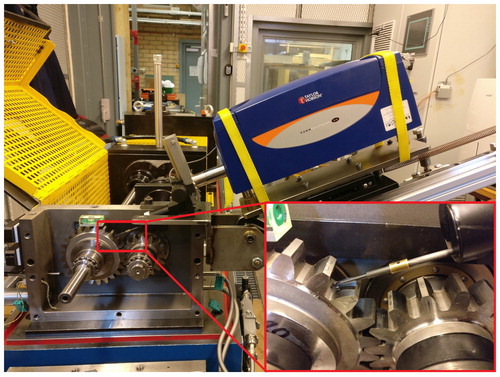
All of the measurements were performed on the same tooth. By using a spirit level, the angular position of the gear could be maintained with an accuracy of ±15 min of arc throughout all measurements. The involute profile was measured initially and after the efficiency measurement. The six involute profiles were measured in the middle of the tooth width using a measurement length of 6 mm, and the profiles were spaced 0.1 mm apart.
To obtain the surface roughness from the measured profile, the form of the involute was removed by fitting a sixth-degree polynomial to the profile. The remainder is the surface topography, which is a combination of waviness, roughness, surface lay, and other flaws (Citation19). To separate the surface roughness from the waviness, a Gaussian filter was used with a cutoff length of 0.8 mm. From the obtained filtered surface profile, the Ra and Rz surface parameters were calculated.
Surface samples from the tooth flanks of all quality classes of the powder metal and wrought steel were studied before and after the efficiency test. The analyses were performed with a scanning electron microscope (SEM) equipped with an energy-dispersive spectrometer. The surface was also analyzed using a vertical scanning interferometry instrument.
Results
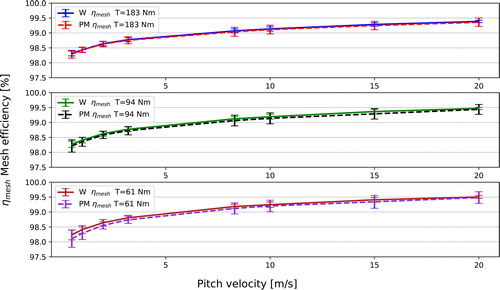
The results from the efficiency measurements are shown in . The largest difference in efficiency between the torque levels was 0.18%. Because there was no apparent difference between the tested torque except the magnitude of the losses, only the highest torque tested is included in the discussion. This was done to improve readability and reduce the clutter in the plots.
Figure 3. Gear mesh efficiency for the wrought steel (W) and PM for all speeds at three tested torque levels (61, 94, and 183 Nm).
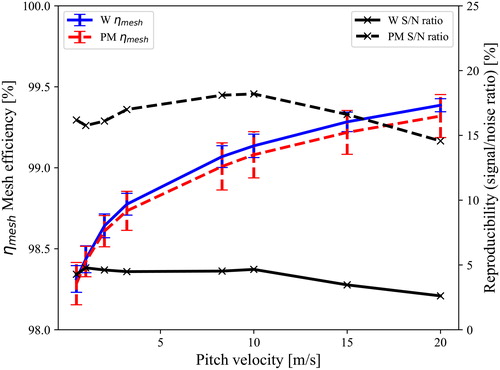
shows the efficiency at 183 Nm and the reproducibility for the measured torque loss, where the reproducibility is the standard deviation divided by the mean efficiency value at each tested speed.
Figure 4. Gear mesh efficiency and reproducibility for wrought steel (W) and PM for all speeds at the highest torque tested (183 Nm).
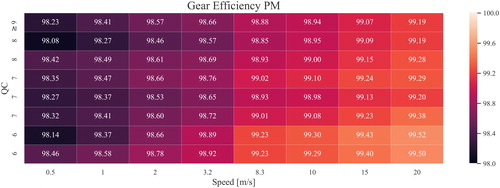
The efficiency measurements for each test for the wrought and powder metal materials are given in and , respectively. These figures show the numerical values for the efficiency. Each cell is colored according to the corresponding value, where higher efficiency values are depicted in lighter color.
Figure 5. Gear mesh efficiency values for each speed and quality class (QC) for the wrought steel (W) with an applied torque of 183 Nm. Each cell is colored according to the corresponding value, where higher efficiency values are depicted in lighter color.
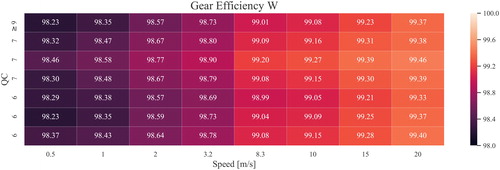
Figure 6. Gear mesh efficiency values for each speed and quality class (QC) for the PM steel with an applied torque of 183 Nm. Each cell is colored according to the corresponding value, where higher efficiency values are depicted in lighter color.
The initial surface profile was measured six times on each gear, and the surface roughness was obtained from an average of the six measurements. The results are shown in and . The table contain the average Ra and Rz surface parameters, as well as their corresponding standard deviation and DIN 3962 quality class.
Table 4. Average Ra and Rz surface roughness parameters with corresponding standard deviation and DIN 3962 quality class of the wrought (W) steel surface before and after efficiency testing.
Table 5. Average Ra and Rz surface roughness parameters and corresponding standard deviation and DIN 3962 quality class of the PM steel surface before and after efficiency testing.
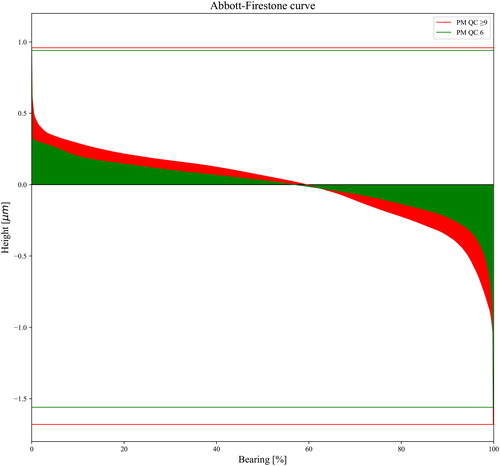
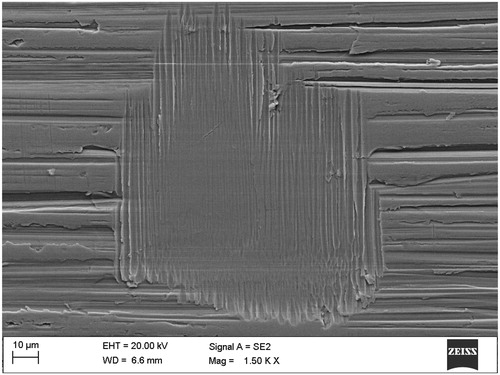
shows SEM images of the surface after the efficiency test; the figure shows that there are no apparent differences in surface structure between quality classes 6 and 7 or between the PM and wrought steel. Quality class ≥9 exhibits a rougher surface, with higher asperities and deeper valleys from the honing process. presents the Abbott-Firestone bearing curves for PM with quality classes 6 and ≥9 derived from the vertical scanning interferometry measurements. In the figure it can be seen that quality class ≥9 has a steeper slope than quality class 6, meaning that the load bearing surface area is smaller for quality class ≥9.
Figure 7. SEM images of representative surfaces after efficiency testing for the best and worst quality classes for both the PM and wrought steel material.
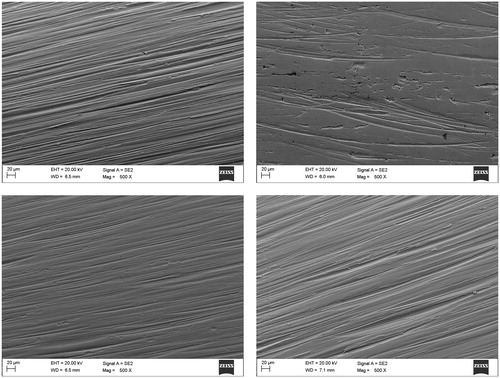
Figure 8. Abbott-Firestone bearing curves for PM with quality classes 6 and ≥9 measured after the efficiency test.
After the efficiency test, no apparent difference in terms of damage was seen on the surfaces of the PM and wrought steel or between the different quality classes.
Sliding wear defects in the form of asperities deformed in the direction of sliding are seen on all surfaces, especially where the slide-to-roll ratio is high; see . Deformed asperities can also be seen at the pitch line where pure rolling occurs. Another type of sliding wear can be observed in the form of closely packed dents, forming what appears to be shallow pits (see ).
Figure 9. SEM image of PM with quality class 7; deformed asperities can be seen, as well as a region with closely packed dents forming a shallow pit.
This type of sliding wear is localized and sparsely found on parts of the surface. Asperities with missing fragments are also found on the entire surface for all quality classes; however, they appear more frequent on quality class ≥9 (see ). Despite the finding of asperities with missing fragments, no actual wear particles were observed anywhere on the surface.
Discussion
The gear mesh efficiency data presented in show that there is no significant difference in mean efficiency between the wrought and powder metal steel gears when including all quality classes. By examining the efficiency data per quality class in and one can observe that the difference is small among the individual tests and no clear trend can be seen between the quality class and the measured gear mesh efficiency.
From the reproducibility given in , it is clear that the wrought steel gears tend to exhibit a more robust behavior throughout the experiments than the powder metal gears. It is worth noting that the reproducibility of the wrought steel material is in the same range as the FZG rig assembly error (2.42–5.04%) shown by Andersson et al. (Citation14).
By inspecting the efficiency measurements shown in and , there are no apparent indications that the efficiency is affected by the DIN 3962 quality class. Therefore, the DIN 3962 quality class cannot solely be used to ensure a high efficiency in the gears mesh contact. According to the DIN 3962 classification, the parameter with the largest deviation determines the final quality class of the gear. Thus, some of the form parameters might have a large impact on the gear mesh efficiency and others will have limited influence. Further studies are needed to clarify the importance of the different form parameters used in the DIN 3962 standard in regards to the gear mesh efficiency.
Previous studies have investigated the efficiency of ground and superfinished surfaces of quality class 5 for the same materials used in this study (Citation1, Citation12, Citation17). Although there are large variations in quality class for honed wrought steel gears, the reproducibility is still within the range of the assembly error. Hence, in this test the difference in quality class seems to be of less importance to the gear mesh efficiency than the surface finishing method.
With the previous studies in mind, one can conclude that honed wrought steel gears tend to be less efficient than ground and superfinished gears. The honed powder metal gears were less efficient than gears with ground surfaces but roughly equivalent to the superfinished gears, although the comparison is slightly unfair because the geometrical tolerances of the ground and superfinished gears were better for quality class 5.
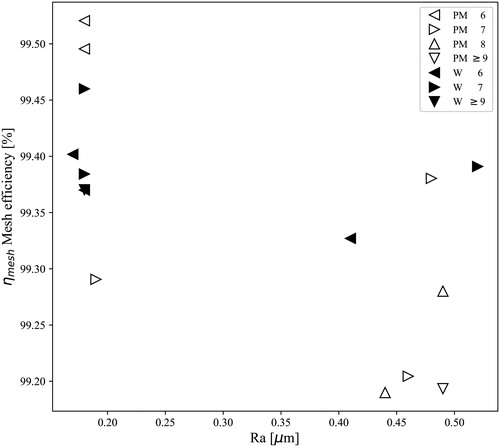
shows the initial surface roughness parameter Ra ( and ) plotted against the gear mesh efficiency from and . By inspecting the figure, it is clear that the wrought steel gears were smoother than the powder metal material. also shows that the test samples’ surface roughness is divided into two discrete levels, one fine and one slightly courser level. The differences in surface roughness cannot be linked directly to the quality class of the gears. However, one can observe that gears with a low Ra value are more likely to have higher gear mesh efficiency.
Figure 10. Gear mesh efficiency and initial Ra surface roughness for wrought steel (W) and PM at the highest torque and speed tested (183 Nm and 20 m/s).
Several studies on both ball-on-disc machines and gear test rigs have shown that a decrease in surface roughness can reduce friction losses in a sliding and rolling contact (Citation2, Citation20, Citation21). A polished surface reduces the asperity peak height, thus limiting the effects of sliding interaction between asperities. The surface roughness is included in the specific film thickness equation according to ISO 6336-22. A decrease in surface roughness increases the specific film thickness. This provides a larger separation between the surfaces, further reducing the friction.
The lubrication regime can be estimated using the Stribeck curve and film thickness parameter. Andersson et al. (Citation17) calculated the Hersey number and specific film thickness using the same experimental setup as used in this article. Because the oil and velocity are the same in both studies, the difference lies in the surface roughness and friction losses. The surface roughness of the ground gears tested by Andersson et al. (Citation17) is in between the two discrete levels of surface roughness for the honed gears. Therefore, along with the measured losses, it is assumed that the lubrication regime is in the same vicinity as for the ground gears tested by Andersson et al. (Citation17); that is, mainly the mixed lubrication regime and borderline to elastohydrodynamic lubrication at the highest speeds.
Surfaces of samples with quality class ≥9 are rougher than those of the other quality classes. This could possibly be due to the higher geometrical tolerances that come with a higher quality class. The bearing curves shown in implies that the surface of quality class ≥9 will distribute the applied load over a smaller area, giving higher surface pressures at the point of contact. This should in theory result in larger initial deformations of the surface of the samples with quality class ≥9.
No obvious difference in the amount and type of wear between quality classes and material is found on the surfaces after testing. The type of wear found arises mainly from the relative sliding between the surfaces and appears in the same way on both the PM and wrought steel materials.
Conclusions
Honed gears made from powder metal and wrought steel materials were manufactured. The gears were measured in accordance with DIN 3962 and awarded a quality class. After efficiency tests in an FZG gear test rig, the following conclusions were drawn:
There are no significant differences in efficiency for honed powder metal and wrought steel gears.
There was no obvious correlation when comparing the gear mesh efficiency with the DIN 3962 quality class.
Even with large variation in quality class, the reproducibility for the wrought steel gears was shown to be in the same range as the FZG rig assembly error.
The honed wrought steel gears tested in this study were less efficient compared to gears with ground and superfinished surfaces previously tested. The honed powder metal gears were less efficient than the ground gears but roughly equivalent to the superfinished powder metal gears.
No obvious difference in the amount and type of wear between quality classes and material is found on the surfaces after testing. The type of wear found arises mainly from the relative sliding between the surfaces and appears in the same way on both the PM and wrought steel materials.
Acknowledgement
Special thanks to Dr. Michael Andersson, Höganäs AB, for his guidance and knowledge of powder metal materials.
Additional information
Funding
References
- Li, X., Sosa, M., Andersson, M., and Olofsson, U. (2016), “A Study of the Efficiency of Spur Gears Made of Powder Metallurgy Materials—Ground versus Super-Finished Surfaces,” Tribology International, 95(1), pp 211–220. doi:10.1016/j.triboint.2015.11.021
- Petry-Johnson, T. T., Kahraman, A., Anderson, N. E., and Chase, D. R. (2008), “An Experimental Investigation of Spur Gear Efficiency,” Journal of Mechanical Design, 130(6), pp 062601. Available at: http://mechanicaldesign.asmedigitalcollection.asme.org/article.aspx?articleid=1449772.
- Levina, D. A., Chernyshev, L. I., and Mikhaylovskaya, N. V. (2005), “Powder Metallurgy Overcomes Economic Difficulties,” Powder Metallurgy and Metal Ceramics, 44(1), pp 97–103. doi:10.1007/s11106-005-0064-8
- Jelaska, D. T. (2012), Gears and Gear Drives, Wiley: Hoboken, NJ.
- Capus, J. M. (2005), Metal Powders, 4th Ed., pp 57–120, Elsevier Science: Oxford, UK. Available at: http://www.sciencedirect.com/science/article/pii/B9781856174794500065.
- Fischer-Cripps, A. C. (2007), Introduction to Contact Mechanics, 2nd Ed., Springer US: Boston.
- Danninger, H. and Gierl-Mayer, C. (2013), “Advances in Powder Metallurgy,” Properties, Processing and Applications, Chang, I. and Zhao, Y. (Eds.), pp 149–201, Woodhead Publishing, Cambridge, UK. Available at: http://www.sciencedirect.com/science/article/pii/B9780857094209500076.
- Buch, A. and Goldschmidt, S. (1970), “Influence of Porosity on Elastic Moduli of Sintered Materials,” Materials Science and Engineering, 5(2), pp 111–118. Available from: http://www.sciencedirect.com/science/article/pii/0025541670900406. doi:10.1016/0025-5416(70)90040-6
- DIN 3962-1:1978-08. (1978), “Tolerances for Cylindrical Gear Teeth; Tolerances for Deviations of Individual Parameters.” Available at: https://www.beuth.de/en/standard/din-3962-1/722996.
- Gupta, K., Jain, N. K., and Laubscher, R., (Eds.) (2017), “Conventional and Advanced Finishing of Gears,” Advanced Gear Manufacturing and Finishing, 1st Ed., pp 127–165. Academic Press, London, UK. Available at: http://www.sciencedirect.com/science/article/pii/B9780128044605000055.
- Britton, R. D., Elcoate, C. D., Alanou, M. P., Evans, H. P., and Snidle, R. W. (2000), “Effect of Surface Finish on Gear Tooth Friction,” Journal of Tribology, 122(1), pp 354–360. doi:10.1115/1.555367
- Sjöberg, S., Sosa, M., Andersson, M., and Olofsson, U. (2016), “Analysis of Efficiency of Spur Ground Gears and the Influence of Running-In,” Tribology International, 93, pp 172–181. doi:10.1016/j.triboint.2015.08.045
- Winter, H. and Michaelis, K. (1985), “FZG Gear Test Rig — Description and Possibilities,” Coordinate European Council Second International Symposium on the Performance Evaluation of Automotive Fuels and Lubricants, pp 29–42.
- Andersson, M., Sosa, M., Sjöberg, S., and Olofsson, U. (2014), “Effect of Assembly Errors in Back-to-Back Gear Efficiency Testing,” International Gear Conference, 26th–28th August 2014, Lyon, pp 784–793.
- SKF Group. (2005), SKF General Catalogue 6000, AB SKF: Gothenburg, Sweden.
- Tu, M., Sosa, M., Andersson, M., and Olofsson, U. (2017), “Modelling Power Losses of Cylindrical Roller Bearings in an FZG Gear Test Rig,” Bearing World Journal, 2, pp 51–59.
- Andersson, M., Sosa, M., and Olofsson, U. (2016), “The Effect of Running-In on the Efficiency of Superfinished Gears,” Tribology International, 93, pp 71–77. Available at: http://www.sciencedirect.com/science/article/pii/S0301679X15003527. doi:10.1016/j.triboint.2015.08.010
- Sosa, M., Björklund, S., Sellgren, U., and Olofsson, U. (2014), “In Situ Surface Characterization of Running-In of Involute Gears,” Wear, 340–341, pp 41–46.
- Bhushan, B. (2013), Introduction to Tribology, 2nd Ed., John Wiley & Sons, New York.
- Björling, M., Larsson, R., Marklund, P., and Kassfeldt, E. (2011), “Elastohydrodynamic Lubrication Friction Mapping—The Influence of Lubricant, Roughness, Speed, and Slide-to-Roll Ratio,” Proceedings of the Institution of Mechanical Engineers - Part J: Journal of Engineering Tribology, 225(7), pp 671–681. doi:10.1177/1350650111403363
- Kahraman, A. (2013), “Impact of NiB Coating on the Efficiency, Scuffing, and Wear of Gear Contacts,” ADA583849, Defence Technical Information Center, Virginia.