
Abstract
Measures of near-shore physical habitat structure have only recently been employed in large-scale assessments of lake ecological condition. We outline and evaluate a rapid approach for quantifying lake physical habitat structure and disturbance that was piloted in the Northeast United States by the US Environmental Protection Agency in its Environmental Monitoring and Assessment Program (EMAP-NE), then improved and applied in the 2007 National Lakes Assessment (NLA). This approach measures littoral habitat complexity, fish cover, substrate, aquatic macrophytes, riparian vegetation, and human disturbances. Of 46 NLA physical habitat metrics, 34 had repeat-visit standard deviations <10% of their potential ranges, indicating repeatability sufficient to distinguish 4 to 5 levels of habitat condition within that range. For 23 metrics, the signal to noise ratio (S/N) of among-lake to same-year repeat-visit variance was moderate to high (3–10), indicating that noise variance was a relatively small confounding factor in their interpretation. Most NLA metrics were 30–40% more precise than those of EMAP-NE, largely because NLA used a greater number of habitat percent cover classes. We conclude that the metrics and indices derived from the NLA physical habitat field approach are precise enough to quantify near-shore habitat structure for contributing to national, state, and ecoregional assessments of lake condition.
Over the past 60 years much residential and commercial development has focused on lake shores. For example, Hart (Citation1984) reported that cottage and resort developments increased 5-fold between 1940 and 1980 in the northern counties of Michigan, Minnesota, and Wisconsin, with much of the rural-residential development around or near lakes. Such development fundamentally alters riparian and lakeshore environments and has led to a growing recognition of the importance of near-shore physical habitat structure for understanding differences in lake biotic assemblages (Allen et al. Citation1999, Whittier et al. Citation2002, USEPA Citation2009).
The lack of attention to near-shore physical habitat in lake monitoring contrasts with its long recognition as a major issue in monitoring streams (e.g., Platts et al. Citation1983, MacDonald et al. Citation1991). Lake surveys typically include water quality samples, temperature and dissolved oxygen profiles, lake area, depth, shoreline geometric complexity, and, increasingly, aquatic macrophytes (Hutchinson Citation1957, Thomas et al. Citation1990, Wetzel and Likens Citation1991). Methods for monitoring lake water quality and profiles of temperature and dissolved oxygen are well developed, and much is known about their precision (Hutchinson Citation1957, Wetzel and Likens Citation1991).
More recent efforts have gone beyond basic lake morphometry, focusing on the structure and complexity of physical habitat in the nearshore environment (Kaufmann and Whittier Citation1997, Jennings et al. Citation1999, Schindler and Scheuerelle Citation2002, Sass et al. Citation2006, USEPA Citation2009). To date, however, the precision of those methods has not been systematically quantified, nor has their adequacy for application in monitoring programs been formally evaluated. Kaufmann and Whittier (Citation1997) developed a rapid, semiquantitative approach for evaluating near-shore human disturbances and physical habitat structure in regional and national surveys of lakes. Their approach addressed cover and complexity in littoral and riparian habitats, providing information concerning 7 dimensions of lake physical habitat in the near-shore zone of lakes: (1) water depth and surface characteristics, (2) substrate size and type, (3) aquatic macrophyte cover and structure, (4) littoral cover for biota, (5) riparian vegetation cover and structure, (6) near-shore human land-use and disturbances, and (7) bank characteristics that indicate water level fluctuations and terrestrial–aquatic interaction (Paulsen et al. Citation1991, Kaufmann Citation1993).
Note that we refer to regions as parts of the landscape where assessments of lake condition are desired, but where statistical sampling and relatively rapid field methods must be implemented because the number of lakes is too large to census or study in great detail. Regions in this context vary from large (e.g., the Western US) to relatively small (e.g., the Upper Peninsula of Michigan), and may refer to ecoregions (e.g., the Southern Appalachians).
Developing methods that have adequate precision for regional assessments and trend detection has been a great challenge in the evolution of physical habitat methods for regional and national surveys because those methods must be rapid, inexpensive, practical, and they must produce informative, repeatable results. It is important to quantify the precision and adequacy of these methods because the measured values of any variable obtained at each individual lake in a regional survey reflect not only real (persistent) differences among lakes that are of interest, but also measurement imprecision and short-term temporal variability, or “noise” variance (Larsen et al. Citation2001).
In a regional assessment, differences among lakes are the signal of interest, but real differences can be obscured by noise variance (Paulsen et al. Citation1991, Kaufmann et al. Citation1999). Therefore, our objectives were to (1) describe the field methods used by the National Lakes Assessment (NLA) to quantify near-shore lake physical habitat structure, and (2) quantify the precision of these methods. We based our analyses on data from the Environmental Monitoring and Assessment Program–Northeast Lakes (EMAP-NE) and the NLA.
Study sites and methods
Both the EMAP-NE and NLA surveys were based on spatially balanced probability samples of lakes selected from defined sampling frames, and their physical habitat field methods were similar. The EMAP-NE was a pilot survey, and its physical habitat methods were modified over its 3-year duration to improve the precision of measurements. The NLA was conducted at the national scale in 2007 (USEPA Citation2009), applying the same design for locating field observation plots at each lake but incorporating additional minor modifications in data collection methods to further improve precision (USEPA Citation2007). In both surveys repeat sampling was conducted within the summer sampling period, allowing us to estimate and contrast the precision of physical habitat metrics within and between surveys.
EMAP-NE
The population of interest for the EMAP-NE pilot survey was all lakes in the Northeast United States with an open-water surface area of 1–10,000 ha (0.01–100 km2) and a depth ≥1 m. The sampling frame for the survey was the Digital Line Graph (DLG) version of the US Geological Survey (USGS) 1:100,000 map series. During 3 years of summer sampling, we obtained data on physical habitat from a spatially balanced probability sample of 185 lakes from this frame (Larsen and Christie Citation1993, Larsen et al. Citation1994). Field crews surveyed 50, 79, and 71 lakes between July and mid-September of 1992, 1993, and 1994, respectively; 15 of those 200 lakes were repeat visits in different years, and 179 had a complete suite of biological, physical, and chemical data ().
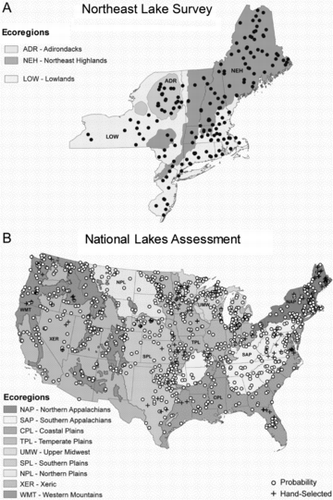
Surveyed water bodies included natural lakes without anthropogenic modifications, ponded wetlands, human-constructed lakes, and run-of-the-river reservoirs. Crews made repeat visits to random subsets of 19, 15, and 16 lakes, respectively, from the lakes sampled in the 3 years between 1992 and 1994. These summer-season sampling visits were 1–8 weeks apart. We report findings for the Northeast region as a whole and for 2 subregions: the NE Lowlands and the NE Highlands (). The NE Highlands is an aggregation of the Adirondack Mountains and the Omernik (Citation1987) NE Highlands Level III Ecoregions.
NLA
Field crews sampled 1157 lakes across the 48 conterminous US states for the NLA during summer 2007 (). The NLA did not sample Alaska and Hawaii completely, so data from these states were excluded from the national assessment. Of the 1157 lakes, 1033 were selected as a probability sample from the USGS/Environmental Protection Agency (EPA) National Hydrography Dataset (NHD) with a spatially balanced, randomized systematic design that excluded the Great Lakes and Great Salt Lake (Peck et al. Citation2013). The sample lakes represent the population of lakes with >4 ha surface area and ≥1 m maximum depth in the conterminous United States. An additional 124 hand-picked lakes were sampled with the intent of augmenting the number of minimally disturbed (i.e., reference) lakes. Physical habitat was not assessed in lakes with surface areas >5000 ha, leaving a probability sample of 981 lakes and 120 hand-selected lakes with physical habitat data. A random subsample of 95 probability sample lakes was revisited during the same field season.
Our analysis of physical habitat precision was based on the 90 repeat-visit lakes for which physical habitat measurements were made (i.e., those with surface areas <5000 ha). We report findings nationally by 3 regions (Eastern Highlands, Plains and Lowlands, and the West) and by 9 regions defined by aggregating Omernik (Citation1987) Level III Ecoregions as described by Stoddard et al. (Citation2005a) and Paulsen et al. (Citation2008): the Northern Appalachians, Southern Appalachians, Coastal Plains, Temperate Plains, Upper Midwest, Southern Plains, Northern Plains, Xeric West, and Western Mountains ().
Physical habitat observations and metric definitions
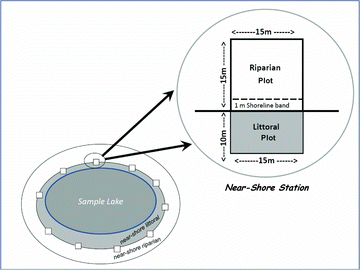
In both the NLA and EMAP-NE surveys, field crews characterized littoral and riparian physical habitat (Kaufmann and Whittier Citation1997, USEPA Citation2007) by collecting data at a randomized set of 10 near-shore stations spaced equidistant around each lake (). At each station, crews recorded data within 10 × 15 m littoral plots, 15 × 15 m riparian plots, and a 1 m-wide shoreline band. Field forms were designed for rapid recording of data; thus, measurements and observations at each station required approximately 5 minutes. Including transit time between stations, the physical habitat component of lake sampling required 1.5–3.5 h on lakes ranging from 7 to 560 ha. Lake-wide summary metrics were calculated by combining data from the 10 near-shore stations at each lake ().
Table 1 Definitions and descriptions of 46 selected National Lakes Assessment (NLA) metrics and 5 composite indices (evaluated in Tables 3–5). All metrics are lake mean values or proportion of shoreline with presence of named features. The 10 metrics marked with an asterisk (*) were not included in cross-survey comparisons in Table 5.
Shoreline human disturbances
At each near-shore station, crews recorded the presence or absence of 12 predefined types of human disturbance: commercial, buildings, roads/railroads, row crops, orchards, pastures, landfill/trash, lawns, developed parks, utility lines, bulkheads/revetments, and docks/boats. Starting in 1993, crews also identified the same set of human disturbances outside but adjacent to the plots. In both surveys, crews tallied disturbances behind the plots. In the NLA, however, we defined adjacent disturbances more explicitly as those ≤10 m left or right of the littoral or riparian plots.
We calculated 2 types of summary metrics by combining various types of human disturbance observations. First, we calculated the extent of near-shore disturbance around the lakeshore as the proportion of stations at which crews observed one or more types of human disturbances (i.e., hifpAny, hifpAnyCirca). Second, we calculated an index of the intensity of near-shore disturbance as the observed number of types of human disturbance averaged over the 10 near-shore stations (hiiAll). In the disturbance intensity index, we weighted the presence of each type of disturbance by a proximity factor before averaging over the 10 stations and then summed the proximity-weighted averages for the various types of disturbance to compute the proximity-weighted disturbance intensity (see Kaufmann et al. Citation1999 for proximity-weighting procedures).
In the EMAP-NE, weightings were 1.0 for disturbances observed within the riparian sample plots and were reduced to 0.33 for those behind or adjacent to the plots because of their presumed lesser influence on biota observed within the plots. In the NLA, we increased weightings to 0.5 for disturbances adjacent to the sample plots, which also made them more similar to weights used by Kaufmann et al. (Citation1999) for US EPA assessments in streams and rivers. We also calculated combined types of disturbances by summing metrics for subsets of related types of disturbances (i.e., all agricultural types = sum of 3 separate proximity-weighted metrics for row crop, orchard, and pasture = hiiAg).
Lake riparian vegetation
Within each riparian plot (), field crews visually estimated the vegetation type and areal cover for each of 3 layers: canopy (>5 m high), mid-layer (0.5–5 m high), and ground cover (<0.5 m high). Crews estimated large (diameter at breast height [DBH] > 0.3 m) and small (DBH < 0.3 m) diameter tree cover separately in the canopy and mid-layer, distinguished woody from herbaceous vegetation in the mid-layer and ground cover, and distinguished barren ground from vegetation inundated by water in the ground layer. In the first year of the EMAP-NE, crews estimated 4 cover classes: absent (0), sparse (0–10%), moderate (10–40%), and heavy (>40%). In all subsequent years of EMAP-NE and in the NLA, crews estimated 5 cover classes: absent (0), sparse (0–10%), moderate (10–40%), heavy (40–75%) and very heavy (>75%). We calculated whole-lake metrics for each single type of vegetation within each layer by assigning the respective cover class arithmetic midpoint values (0%, 5%, 25%, 57.5%, and 87.5%) to each station's observations and then computing the mean values or presence across all 10 stations. We also calculated aggregated summary metrics for each lake (e.g., rviWoody) by summing whole-lake mean areal covers or presence–absence tallies for various types or layers of riparian vegetation (Kaufmann et al. Citation1999).
Near-shore littoral aquatic macrophytes
Field crews visually estimated areal cover for emergent, floating, and submerged aquatic macrophytes within each of the 10 littoral plots () using percent cover classes identical to those for riparian vegetation. The aquatic macrophyte cover class refinements made over the 3 years of the EMAP-NE surveys and the NLA were also identical to those for riparian vegetation. We calculated single vegetation type (i.e., amfcSubmergent, amfcEmergent, amfcFloating) and aggregated aquatic macrophyte type metrics (e.g., amfcAll) for each lake in the same fashion as for riparian vegetation.
Littoral habitat cover
The EMAP-NE and NLA surveys both made observations of 8 littoral cover types within each littoral plot: rock ledges, boulders, brush, inundated live trees, snags, overhanging vegetation, aquatic macrophytes, and human structures. In 1992, EMAP-NE field crews merely recorded the presence or absence of each type of feature, but preliminary evaluations suggested that estimates of areal cover of these features would be required for distinguishing lakes having little littoral cover from those having considerable cover. In 1993 and 1994, field crews recorded cover in 3 classes: (0, 0–10%, >10% cover).
For the NLA, we further refined the cover classes to match those for riparian vegetation and aquatic macrophytes: absent (0), sparse (0–10%), moderate (10–40%), heavy (40–75%) and very heavy (>75%). From the 1992 EMAP-NE data, we were only able to calculate metrics quantifying the proportion of littoral stations with each particular type of cover present. From this presence–absence data, we calculated aggregate metrics defined as the mean number of littoral cover types per station. In the 1993–1994 EMAP-NE data, we attempted to better discriminate small amounts of cover from no cover or substantial amounts of cover by assigning cover quality values of 0, 0.2, and 1.0, respectively, to the 0%, 0–10%, and >10% cover observations in the calculation of both mean cover for single types of fish cover and the sums of multiple fish cover types. For the NLA, we assigned arithmetic midpoint areal cover values to each of the 5 cover percent classes when calculating mean cover estimates, as we did for riparian vegetation and aquatic macrophytes.
Shoreline and littoral bottom substrates
Field crews visually estimated the percent areal cover of 8 substrate types (bedrock, boulder, cobble, gravel, sand, silt/clay/muck, woody debris, and organic detritus) at each of the 10 near-shore stations (). These estimates were made separately for the 1 m shoreline band above the lake margin and for the lake bottom within the littoral plot. In cases where the bottom substrate could not be observed directly, crews viewed the bottom through a viewing tube, felt the substrate with a 3 m PVC sounding tube, or observed sediments adhering to the boat anchor as it was retrieved from the bottom. Cover classes were the same as for riparian vegetation, changing from 4 cover classes in 1992 to 5 classes in 1993–1994 and the NLA in 2007.
We calculated metrics describing the lake-wide mean cover of near-shore littoral and shoreline substrate in each size category by averaging the cover estimates at each station, based on the cover class midpoint approach described above. For the EMAP-NE we quantified the central tendency and variety of substrate size by calculating an areal cover-weighted mean substrate size index (Bain et al. Citation1985, Kaufmann et al. Citation1999) and its standard deviation. We first ranked the substrate classes by size from 1 to 6, (silt to bedrock), multiplied by the mean cover of each class across the 10 plots, and then averaged the scored cover and computed the variance across size classes.
For the NLA, we adapted the approach of Faustini and Kaufmann (Citation2007) and Kaufmann et al. (Citation2009) for estimating geometric mean and variance of substrate diameters from systematic pebble-counts. In this approach, we assigned the geometric mean between the upper and lower diameter bound of each size class for each cover observation before calculating the cover-weighted mean size index. We calculated the geometric mean diameters (Dgm) of littoral and shoreline substrate (bsxLdia and ssxLdia) as follows:
(1)
where Pi = areal cover proportion for diameter class i; Diu = diameter (mm) at upper limit of diameter class i; Dil = diameter (mm) at lower limit of diameter class i; Sumi = summation across diameter classes. Nominal size class midpoint diameters of 5660 and 0.0077 mm were set, respectively, for the largest (bedrock and hardpan) and smallest (silt, clay, and muck) diameter classes.
Our calculations are identical to those of Faustini and Kaufmann (Citation2007), except that here the percent cover estimates used to weight diameters were the mean values of 10 visual cover estimates rather than areal streambed cover determinations derived from the pebble-count percentages for individual particles in each diameter class.
Littoral depth, bank characteristics, and other observations
Field crews measured littoral depth, estimated bank heights and water level fluctuations, and observed water surface and bottom sediment color and odor at each of the 10 near-shore stations (). SONAR, sounding lines, or sounding tubes were used to measure lake depth 10 m offshore. Crews recorded the presence of surface films or scums, algal mats, oil slicks, and sediment color and odor. They visually estimated the bank angle in the 1 m-wide shoreline band and the vertical and lateral range in lake level fluctuations, based on high and low water marks.
Field methods for littoral depth, bank characteristics, surface scums, and sediment color and odor were the same from 1992 through 2007, except that NLA field crews used hand-held levels, survey rods, and laser rangefinders (rather than unaided visual estimates) to measure vertical and lateral lake level fluctuation. We calculated whole-lake metrics for littoral depth and water level fluctuations as arithmetic averages and standard deviations of the measured values at the 10 stations. For bank angle classes and qualitative observations of water surface condition and sediment color and odor, we calculated the proportion of stations having observations in each class.
Composite habitat quality indices
We calculated 5 composite habitat indices as described in detail by CitationKaufmann et al. (2014b). (1) The near-shore human disturbance index incorporated measures of the extent and intensity of the 12 types of human activities (listed earlier in the shoreline human disturbances subsection) scaled from 0 (absence of any human disturbance) to 1 (extremely high disturbance). (2) The index of riparian vegetation cover structure characterized the cover and structural complexity of the 3-layer (canopy, mid, and ground) lakeshore riparian vegetation, including inundated upland or wetland vegetation. The metrics used and their weights differ among the 9 NLA Ecoregions because of differing potential natural vegetation and lake types. The metrics in each index were scaled and combined so that each metric and the combined indices varied from 0 to 1 (CitationKaufmann et al. 2014b). (3) The littoral cover complexity index characterized the cover and variety of the 8 littoral fish cover elements and 3 aquatic macrophyte cover types (listed earlier in the littoral habitat cover and near-shore littoral aquatic macrophytes subsections). The littoral metrics employed and their weights varied regionally, as with the riparian metrics. The component metrics and the indices were scaled to vary from 0 to 1. We indexed both the amount of cover and the variety of cover types because both can influence aquatic biota. (4) The littoral–riparian cover complexity index was calculated by averaging the riparian and littoral habitat complexity indices. (5) Finally, the overall lakeshore habitat quality index was calculated by averaging the 3 primary indices: riparian complexity, littoral complexity, and [lack of] human disturbance.
Precision analysis
Measures of variance between repeat visits within the sampling season of the same year provide accurate estimates of the variances in individual lake habitat metrics that would be encountered in a spatially extensive survey carried out over a typical summer field season. Repeat visit variance includes the combined effects of within-season habitat variation, measurement variation, changes in the locations of sampling plots between visits to individual lakes, and variation in estimates obtained by different field crews. We employed variance components analysis to estimate repeat-visit variance (σ2rep) and the signal:noise ratio (S/N = σ2lake/σ2rep), which is one expression of the relative precision of habitat metrics (Kaufmann et al. Citation1999). We used the general random-effects model of Kincaid et al. (Citation2004) to model the sources of variation in any habitat variable, Y, as
(2)
where Yijk is the measured metric value for the kth visit to lake i within the jth year; the grand mean value is μ; and L and T are random lake and year effects, respectively.
For the NLA, data came from a single year, so the year (T) and lake:year interaction (LT) terms in Equationequation 1(1) are zero, and the model simplifies to Yik = μ + Li + Eik. The residual error (Eik) of the simplified model represents within-year variation at any single lake, which we estimated from a subset of the lakes that was resampled the same summer. We assumed that Li and Eik are normally distributed random effects, with variances of σ2lake and σ2rep, respectively. The combined dataset containing samples from different lakes, as well as revisits to same lakes, enabled estimation of both among-lake variance (σ2lake) and repeat-visit variance (σ2rep) using restricted maximum likelihood (Littell et al. Citation2006).
In our synoptic survey context, σ2lake is the signal of interest, and σ2rep is noise variance; we define their ratio as S/N. The advantage of S/N as a precision measure is its relevance to many types of statistical analysis and detecting differences in subpopulation means (Zar Citation1999). High noise in habitat descriptions relative to the signal (i.e., low S/N) diminishes statistical power to detect differences among lakes or groups of lakes. Imprecise data limit the ability to detect temporal trends (Larsen et al. Citation2001, Citation2004). Noise variance also limits the maximum amount of variance that can be explained by models such as multiple linear regression (Van Sickle et al. Citation2005, Kaufmann and Hughes Citation2006). By reducing the ability to quantify associations between variables (Allen et al. Citation1999, Kaufmann et al. Citation1999), imprecision compromises the usefulness of habitat data for discerning likely controls on biota and diagnosing probable causes of impairment. The adverse effects of noise variance on these types of analysis are negligible when S/N >10, becoming minor as S/N decreases to 6, increasing to moderate as S/N decreases to 2, and finally becoming severely limiting as S/N approaches 0 (Paulsen et al. Citation1991, Kaufmann et al. Citation1999). At S/N = 0, all the metric variance observed among lakes in the survey can be attributed to measurement “noise.”
The square-root (σrep) of repeat-visit variance (σ2rep) that we derived from the variance components model (and termed noise) is an absolute measure of precision. In our data, noise is equal to the standard deviation of observations in repeat visits to individual lakes within a given sample year, averaged over all the lakes and years in which within-season repeat observations were made. The precision measure σrep by itself provides useful comparisons of precision for a single metric determined using different field methods within the same region; however, ranges typically differ among metrics (e.g., aquatic macrophytes vs. riparian trees, or riparian canopy cover vs. the sum of riparian canopy in 3 layers of vegetation). Similarly the range of the same metric can differ among regions. To facilitate comparisons among metrics, regions, or surveys, it is therefore advantageous to scale or standardize σrep, ideally by some ecologically meaningful range of variation (e.g., very poor to very good habitat condition, or very low to very high habitat complexity). We standardized the estimated value of σrep for each metric by dividing by the potential maximum range Rgpot. The metric Rgpot was determined in most cases by the metric definition (e.g., mean presence among 10 lake stations can only vary from 0 to 1). We had already formulated most of the habitat metrics to limit their ranges from 0 to 1, and the observed ranges (Rgobs) of most metrics were nearly identical to their potential range (only 9 of 46 metrics we examined had Rgobs <80% of Rgpot) and did not vary substantially between regions.
The S/N ratio may not always be a good measure of the potential of a given metric to discern ecologically important differences among sites. For example, a metric may easily discriminate between sparse and abundant littoral cover for fish, but S/N for the metric would be low in a region where littoral cover does not vary greatly among lakes. In cases where the signal variance (σ2lake) observed in a regional survey reflects a large range of habitat alteration or a large range in natural habitat conditions, S/N would be a good measure of the precision of a metric relative to what we want it to measure. In random surveys or in relatively homogeneous regions, however, σ2lake, and consequently S/N, may be less than would be calculated for a set of sites specifically chosen to span the full range of habitat conditions occurring in a region. To evaluate the potential usefulness of metrics, an alternate measure of relative precision, σrep/Rgpot, offers additional insight.
To help interpret values of σrep/Rgpot, we calculated the magnitude of σrep required to detect a specified minimum difference (Dmin) between metric values in 2 lakes based on a single sample (n = 1) from each lake (or between metric values for a single lake measured at 2 different times). We assume that σrep is a preexisting estimate of the within-lake standard deviation, common to all lakes, and regard the single observation from each lake as an estimate of the mean metric value for that lake. Then the minimum detectable difference in means between the 2 lakes (or between 2 times) is given by Dmin = 1.96σrep(2n)1/2 = 2.77σrep, using a 2-sided Z-test with α = 0.05 (Zar Citation1999). Thus, to detect any specified difference between 2 lakes in a metric relative to its potential range (Dmin/ Rgpot), the standardized within-lake standard deviation, σrep/Rgpot, cannot exceed 2.77(Dmin/ Rgpot).
We associated various levels of standardized minimum detectable differences (Dmin/Rgpot) with subjective classes of high, moderate, or low precision (). For example, we considered precision to be high if σrep/Rgpot ≤ 0.052, allowing metric values based on a single visit to each of 2 lakes to significantly discriminate differences that were ≤1/7 of that metric's potential range. That is, all 8 or more values spread evenly over Rgpot would be statistically distinct (p < 0.05). Similarly, a σrep/Rgpot value ≥0.15 indicates low precision because single-visit metric values could only distinguish (p < 0.05) lakes if they differed by ≥0.42 of the potential range of the metric. In that case, they cannot discern among high, medium, and low metric values. A σrep/Rgpot value of ≥0.36 indicates extremely low precision because metric values based on a single visit to each of 2 lakes have such low repeatability that they could not be considered significantly different (p < 0.05), even if they were at the high and low extremes of the potential range.
Table 2 Calculated levels of relative precision (σrep/Rgpot) required to detect (p < 0.05) specified minimum differences between mean metric values in 2 lakes, based on a single sample from each lake (or between metric values measured in one lake at 2 different times), as described in the precision analysis section of Methods. Column 1 is the desired standardized, minimum detectable difference (Dmin/Rgpot), and Column 4 is the maximum standardized value of σrep required to detect this difference. Column 2 is the precision class.
Table 3 Precision of 46 selected National Lakes Assessment (NLA) metrics expressed as: (1) the pooled standard deviation of repeat visits (σrep), (2) precision relative to the potential range (σrep/Rgpot), and (3) the signal:noise ratio, where signal is among-lakes variance and noise is within-lake variance during the same year and season (S/N = σ2lake/σ2rep). Values of σrep/Rgpot listed in italics were calculated using observed range Rgobs because their potential ranges Rgpot were undeterminable or highly unlikely (e.g., 12 land use types simultaneously at every lake station). Columns 3 and 4 each show the lower and upper bounds of their respective ranges. Analysis was based on NLA field measurements on a summer 2007 probability sample of 981 lakes in the 48 conterminous US states, with repeat sampling on a random subset of 90 of those lakes during that summer. All metrics are lake mean values or proportion of shoreline with presence of named features. The 10 metrics marked with an asterisk (*) were not included in cross-survey comparisons in Table 5.
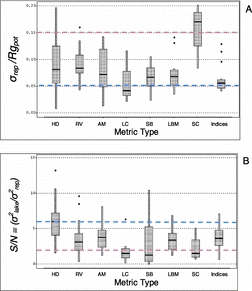
Table 4 Precision of the composite indices used as the primary physical habitat condition measures in the NLA, computed by aggregated Ecoregions: the Eastern Highlands (EHIGH), the Plains and Lowlands (PLNLOW), and the mountains and xeric Ecoregions of the West (WEST). Precision expressed as: (1) the pooled standard deviation of repeat visits (σrep), (2) precision relative to the potential range (σrep/Rgpot), and (3) the signal:noise ratio, where signal is among-lakes variance and noise is within-lake variance during the same year and season (S/N = σ2lake/σ2rep). Analysis was based on NLA field measurements on a summer 2007 probability sample of 981 lakes in the 48 conterminous US states, with repeat sampling on a random subset of 90 of those lakes during that summer.
In this study, we estimated the precision of 46 NLA physical habitat metrics that were calculated or described in the NLA report (USEPA Citation2009), this article, or CitationKaufmann et al. (2014a, 2014b). We compared NLA precision with that of the previous EMAP-NE pilot survey for a subset of 36 analogous metrics.
Results
Precision was moderate to high for most of the 46 NLA metrics (median σrep/Rgpot = 0.083), ranging from σrep/Rgpot = 0.020 (very precise) for littoral percent bedrock to σrep/Rgpot = 0.174 (low precision) for the proportion of lake stations with surface scum or films (). Thirty-four metrics had σrep/Rgpot ≤ 0.10, indicating that their repeatability was sufficient to distinguish (p < 0.05) at least 4 or 5 distinct levels of physical habitat condition from a single sampling visit to each lake (). Of those metrics, 11 had σrep/Rgpot ≤ 0.052, sufficient precision to distinguish among-lake differences <13% of their potential ranges ().
Values of S/N for the 46 metrics were generally moderate (median S/N = 3.9) but ranged from 0.4 for littoral snag and large wood cover to 9.5 for the nonagricultural human disturbance index (). For 23 of the NLA metrics, S/N was moderate to high (3.0–9.5). Noise variance was a relatively small to moderate confounding factor in the interpretation of these 23 metrics in the NLA, with repeat-visit variance between 9 and 33% of the magnitude of among-lake variance.
Precision differences among physical habitat metrics and regions
Based on σrep/Rgpot values, the most generally precise metric categories were littoral fish cover, composite habitat index, substrate, and littoral and bank morphology, but the precision of individual metrics within most categories ranged widely (). Furthermore, there were very precise individual metrics within the human disturbance, aquatic macrophyte, littoral cover, and littoral-shoreline substrate categories (). Several, if not most, metrics within each metric category had σrep/Rgpot values ≤0.10, including littoral cover and aquatic macrophyte cover metrics that had low precision in the earlier pilot surveys before field methods were improved (see below under precision differences between EMAP-NE and NLA).
More than half of the human disturbance metrics had high S/N (>6), as did many substrate and aquatic macrophyte measures (). Most measures of riparian vegetation, aquatic macrophytes, littoral bank morphology, and the composite indices had moderate S/N (2–5). Littoral fish cover metrics were highly precise in terms of σrep/Rgpot but had generally low S/N, with most values between 1 and 2.
The 5 composite physical habitat indices were precise or moderately precise (σrep/Rgpot = 0.043–0.115) and had moderate S/N (2.7–4.5) over the entire NLA survey (). When computed for NLA's 3 major regions, σrep/Rgpot values for these 5 indices remained approximately the same (0.041–0.129); however, the range of S/N values was greater (0.7–7.1), reflecting differences in the strength of gradients in these habitat condition indices among regions (). Despite having uniformly moderate to high precision among regions, as measured by σrep/Rgpot < 0.06, the littoral cover complexity index had low S/N in the West (0.7) and the Eastern Highlands (1.6), but moderate S/N in the Plains and Lowlands (3.4). Compared with the other composite indices, the human disturbance index RDis_IX had more consistent moderate to high S/N (3.5–7.1) across the 3 major NLA regions, as did LkShoreHQ, the index that combined lack of human disturbance with littoral and riparian physical habitat complexity (3.8–6.2; ).
Comparison between S/N and σrep/Rgpot
The S/N ratio (log-transformed) and σrep/Rgpot were only weakly (negatively) correlated over the NLA and its 3 regions (Pearson r = −0.25, p = 0.003). Low σrep/Rgpot (e.g., ≤0.052 indicating good repeatability) did not guarantee high (>6) or even moderate (2–6) S/N (). The S/N ratio for metrics with σrep/Rgpot ≤ 0.052 ranged from near 0 to >25. In comparison, metrics with high σrep/Rgpot (e.g., >0.15) never had S/N >4 and typically had S/N <2. Depending on the observed range and distribution of metric values throughout that range, S/N for 2 metrics with equivalent σrep/Rgpot may differ substantially.
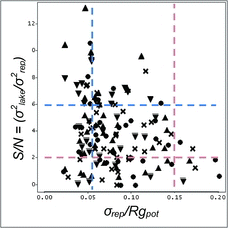
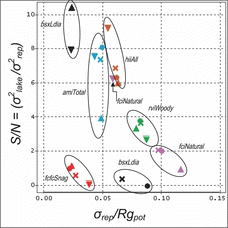
For example, S/N for the summed cover of 3 types of aquatic macrophytes (amiTotal) ranged from 4 to 8 among the 3 major regions of the NLA, whereas σrep/Rgpot remained nearly identical at ∼0.05 (). Similarly, the S/N ratio of littoral substrate mean diameter ranged from 0 to 10.4 (very poor to very good relative precision) among the 3 regions, despite only moderate differences in σrep/Rgpot among those regions (0.024–0.088), indicating excellent to moderate repeatability in all cases (). The S/N for the mean cover of littoral snags was low in all 3 NLA regions (0.2–1.1), despite the low to moderate values of σrep/Rgpot (0.02–0.04) that indicated excellent repeatability of the measurements in all regions (). When stratified by metric, S/N (log-transformed) and σrep/Rgpot were highly correlated (Pearson r = −0.92, p < 0.001), showing that σrep/Rgpot generally set the potential maximum for S/N within a given range or variance of metric values among lakes within a survey or region.
Precision differences between EMAP-NE and NLA
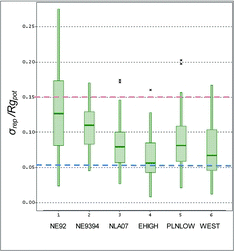
The physical habitat metrics derived from the refined field methods used in the NLA were more precise than those from EMAP-NE. The NLA employed more percent cover categories in visual areal cover estimates than did EMAP-NE and showed the greatest gains in precision for metrics based on those improved cover estimates. The NLA's metrics describing the areal cover of riparian vegetation, aquatic macrophytes, fish concealment features, and substrate types were more precise than those from the earlier EMAP-NE pilot (30–40% lower σrep; ). Regional median σrep/Rgpot values for the set of 36 analogous NLA habitat metrics and indices, calculated nationally and for the 3 NLA regions, were lower (more precise) than those for the EMAP-NE survey (). Metric precision improved (reductions in σrep/Rgpot) within all categories, with littoral cover, aquatic macrophytes, riparian vegetation, and substrate showing the greatest improvements between 1992 and 2007 (; ). Precision of 4 of the 5 composite habitat indices remained high, or improved, between the surveys (; ). The EMAP-NE in 1992 had some metrics with excellent repeat-visit precision, but the NLA σrep/Rgpot median and 75th percentiles were lower (i.e., better precision).
Discussion
Assessment of near-shore littoral and riparian physical habitat structure is an integral part of the US EPA's national and regional lake monitoring programs. We evaluated the precision of metrics and indices based on physical habitat field data collected in 2 major US lake surveys because adequate precision of those measurements is essential to the success of such monitoring programs. Adequate precision is also essential for robust assessments of physical habitat condition and for achieving the goal of the Clean Water Act to restore and maintain the physical, chemical, and biological integrity of the Nation's waters (Paulsen et al. Citation2008, Shapiro et al. Citation2008). Precise physical habitat metrics also are necessary for interpreting the biological data collected in these surveys and for making stressor risk assessments (Van Sickle Citation2013).
Table 5 Comparison of precision for 36 selected lake physical habitat metrics among surveys, expressed as: (1) the pooled standard deviation of repeat visits (σrep) and (2) precision relative to the potential range (σrep/Rgpot); lower values denote higher precision. Estimates of metric precision for NLA (2007) were based on field measurements on a summer 2007 probability sample of 981 lakes in the 48 conterminous US states, with repeat sampling of a random subset of 90 of those lakes during that summer. Estimates of metric precision for EMAP (1992, 1993, 1994) were based on similar field methods in probability surveys of lakes in the northeastern US during summers of 1992 (50 lakes, 19 repeat visits), 1993 (79 lakes, 15 repeats), and 1994 (71 lakes, 16 repeats). Bold font denotes highest precision (lowest value) for a metric among the surveys. Values of σrep/Rgpot marked with an asterisk (*) were calculated using observed range because their potential ranges were undeterminable or highly unlikely (e.g., 12 land use types simultaneously at every lake station).
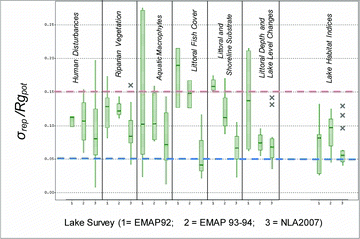
Adequacy of precision in a survey is dependent not only on the repeatability of measurements, but also on the range and variance of metric values over time and space, the questions being asked, and the level of uncertainty that can be tolerated. The adequacy of physical habitat data for describing regional conditions and potential causal associations with biota depends on the relationship between sampling noise and the differences observed over time, across a region, between sites or treatments, or along a disturbance gradient. In our methods, we outlined S/N guidelines used by Paulsen et al. (Citation1991) and Kaufmann et al. (Citation1999) to evaluate the effects of repeat-measurement variance on population estimation, correlation, and regression. We further specified low, medium, and high levels of repeat-visit precision (σrep/Rgpot) for metrics based on the minimum difference that can be considered statistically significant when comparing 2 lakes, each sampled once (). With an interquartile range of σrep/Rgpot = 0.05 to 0.11, most NLA physical habitat metrics are precise enough to distinguish 4 to 8 levels of habitat condition within their potential ranges; however, some metrics that are precise relative to their potential range (i.e., those with low σrep/Rgpot) may not be precise enough to discern differences in physical habitat condition among the survey lakes. This may occur where the variation of the particular metric is not large across the nation or within a particular region, as suggested by low S/N. Of the 46 NLA metrics evaluated, S/N was moderate to high (3.0–9.5) for 23, indicating that repeat-visit variance was between 1/3 and 1/11 the magnitude of among-lake variance in the NLA survey, and a relatively small confounding factor in the interpretation of those metrics. This means that most of the NLA metrics are precise enough for distinguishing several to many grades of condition from good to poor.
The S/N and σrep/Rgpot clearly quantify different aspects of variance and precision. S/N expresses the observed variability among lakes in a survey as a multiple of repeat-visit variability. In comparison, σrep/Rgpot scales repeat-visit variability by the maximum possible range of the metric, which is likely to represent ecologically substantial differences in physical habitat structure or condition. Good repeat-visit precision (low σrep/Rgpot) was a necessary but insufficient condition for a metric having high S/N in the NLA. For example, low S/N (<2.0) was almost unavoidable when σrep/Rgpot was >0.15, and high S/N (e.g., >7) was unlikely unless σrep/Rgpot was ≤0.052. However, metrics with high repeat-visit precision (i.e., σrep/Rgpot ≤ 0.052) had S/N ranging from near 0 to 65. Most of the NLA metrics had σrep/Rgpot < 0.10, which should enable them to have S/N >6 if the among-lake dispersion of metric values were well-distributed across the potential range of those metrics.
In reality, however, the median S/N was only moderate (median 3.9) for the NLA metrics we examined. Even though we observed that lakes could be found over the entire potential range of almost all of the metrics, low S/N was observed in cases where the distribution of metric values among lakes was limited. We recommend that researchers first use σrep/Rgpot to evaluate the adequacy of metrics and indices relative to the magnitude of between-lake differences that they want to contrast. S/N can then be used to further select the indicators with sufficient scope to examine patterns and associations within their survey data. S/N can be used to quantify the degree to which analyses such as correlation, regression, and ANOVA are limited by excessive measurement uncertainty relative to the differences actually observed among lakes in a particular survey dataset.
Metrics that are precisely-measured (i.e., low σrep/Rgpot.) can have low S/N in a regional survey if there is not a strong gradient of site conditions over the metric's potential range. In these cases, researchers should determine if the ecologically important range of the metric is considerably smaller than its potential range. If so, then the low S/N indicates that field measurement precision is inadequate for diagnostic and associational analyses; however, if the case is simply that the observed range is smaller than the ecologically important range, then a low S/N suggests that measurement precision is not limiting the associational analyses in a particular survey. In that case, the field and analytical methods are precise enough, but strong associations will not likely be observed in that set of survey sites. Researchers should reevaluate whether they are measuring the appropriate habitat aspect (possibly redefined to increase its variance across sites). For example, one might increase the weight of snag habitat in a littoral complexity index if snag habitat varies substantially among lakes but cover from other features (e.g., boulders or submerged aquatic macrophytes) is uniformly high among lakes in a region.
The ultimate aim of the EPA's National Aquatic Resources Surveys is to provide comparable, high-quality data for all water body types for use in integrated assessments of the ecological condition of all US waters (Hughes et al. Citation2000, Shapiro et al. Citation2008). To this end, EPA has incorporated common field protocols and indicators where possible in assessing the physical habitat structure of lakes, streams, and rivers in the NLA, EMAP (Stoddard et al. Citation2005b, Citation2006), National Wadeable Streams Assessment (Paulsen et al. Citation2008), and National River and Stream Assessment (USEPA Citation2013). In all 4 assessments, EPA employed systematically placed plots and 5 visually estimated cover classes to characterize habitat structure and human disturbances that quantify a set of 7 physical habitat attributes (Kaufmann Citation1993, Kaufmann et al. Citation1999) common to all 3 waterbody types.
Although comparable precision would be advantageous in future assessments that evaluate all waterbody types, the precision of NLA physical habitat metrics is not as good as that for streams. For an analogous set of 31 stream metrics and indices derived from EMAP-West stream habitat data (Stoddard et al. Citation2005a), the median and interquartile ranges (IQR) were 0.056 (IQR = 0.045–0.077) for σrep/Rgobs and 6.0 (IQR = 2.8–10.9) for S/N. Precision was approximately 60% as good for NLA lakes: median σrep/Rgobs was 0.096 with IQR 0.071–0.122, and median S/N was 3.8 with IQR 1.9–6.2 in regional groupings of equivalent size.
Precision of stream fish cover metrics derived from data collected at 11 plots along each stream site was similar to that for lakes; however, precision of riparian vegetation metrics was generally lower for lakes than for streams (Kaufmann et al. Citation1999, Stoddard et al. Citation2005a), probably because lake metrics were calculated from 10 riparian plots in contrast to the 22 used for stream reaches (2 stream sides × 11 stations), and stations were arrayed along the entire lake perimeter versus a relatively short length of stream assessed (40 times the mean wetted channel width). The stream channel substrate pebble counts visually classify105 individual particles into 8 sediment size classes (Peck et al. Citation2006). These stream methods also produce data of considerably higher precision (Faustini and Kaufmann Citation2007) than do the lake substrate methods, in which the crews directly estimate areal cover of the various substrate types within littoral plots and often must make these estimates where the littoral substrate is not visible.
Several international efforts corroborate the basic design of the EPA's lake physical habitat field methods. Rowan et al. (Citation2006) evaluated an adaptation of Kaufmann and Whittier's (Citation1997) lake physical habitat methods in Scotland for monitoring under the European Union's Water Framework Directive and reported that sampling 4–20 near-shore plots per lake was necessary to produce estimates within 5% of true values, depending on lake size and heterogeneity and on the variable measured. They chose 10 stations for their standard monitoring protocol, sufficient to meet the 5% criterion on all but the largest, most complex lakes. Based partly on that research and ours, Molozzi et al. (Citation2011) and Macedo et al. (Citation2012) sampled 20–40 plots on large Brazilian reservoirs, depending on their size and complexity.
If temporal changes in physical habitat characteristics at individual lakes are similar in type and magnitude to the differences we observed across lakes (i.e., if space-for-time substitution is reasonable), then the NLA habitat assessment approach seems promising as a tool for monitoring temporal trends. In that context, the statistical power for detecting temporal trends depends on the relationships among the repeat visit variance, interannual variance, the size of the trend we wish to detect, the time over which we want to detect that trend, and the statistical uncertainty that we are willing to accept (Larsen and Urquhart Citation1993, Larsen et al. Citation2004). Statistical power to detect temporal trends at a regional scale is especially sensitive to interannual variation that is concordant among sites (Larsen et al. Citation2004). Typically, concordant variation is driven by climatic fluctuations (e.g., El Nino), and it is possible to improve detection of temporal trends if cyclical interannual variation can be modeled. Unfortunately, little is known about regional patterns of interannual variability in physical habitat. We highly recommend that the NLA and other regional or national surveys maintain a network of lake monitoring sites that is sampled every year to provide data to quantify and model cyclical annual variation.
Measurements, metrics, or indices with low precision may require modification of sampling methods, further metric development, or outright rejection. The NLA physical habitat measurements, metrics, and indices we examined have adequate precision to give us confidence in applying them to future NLA surveys that occur every 5 years, and to more intensive temporal monitoring to quantify annual variability.
The precision of field physical habitat determinations was sensitive to relatively minor changes in field methods. As we expected, precision improved between the 2 parts of the earlier EMAP-NE and the NLA ( and ; ). The precision increases were primarily in metrics derived from visual estimation of areal cover (e.g., riparian vegetation, aquatic macrophytes, littoral fish habitat “cover,” and substrates). We attribute the greater precision to improvements in field methods because the only major change was an increase in the number of visual percent cover estimation categories from 2 to 4 in the 1992 EMAP-NE, 3 to 5 in the 1993–1994 EMAP-NE, and finally to 5 cover classes for all types of metrics in the 2007 NLA. As Platts et al. (Citation1983) observed for streams, our lake results showed that 5 visual cover class estimates yield whole-lake metrics with precision adequate for regional surveys, precluding the need for more quantitative field measurements likely to be more expensive or time consuming (Hughes and Peck Citation2008). Progressive precision improvements with rather minor increases in field effort suggest that these changes were cost-effective. That is, decreased effort would likely degrade precision substantially, compromising survey objectives for assessing the status and trends in lake physical habitat and the power to detect associations with biota.
Acknowledgments
Most EMAP-NE data were collected by student employees of the State University of New York–College of Forestry and Environmental Sciences under the direction of N. Ringler and D. Halliwell. The NLA data were collected by State cooperators, US EPA regional staff, and TetraTech, GLEC and Dynamac crews. C. Burch-Johnson prepared the maps, and T. Kincaid assisted with statistical analyses and guidance. Our manuscript was improved by reviews from J. Kurtenbach, D.P. Larsen, R. Ozretich, E. McGoff, D. Peck, and C. Hawkins. This article was subjected to the National Health and Environmental Effects Research Laboratory's Western Ecology Division and approved for publication. Approval does not signify that the contents reflect the view of the US EPA, nor does mention of trade names or commercial products constitute endorsement or recommendation for use.
Funding
Funding for data analysis and manuscript preparation were largely from the US EPA Office of Research and Development in support of the Environmental Monitoring and Assessment Program (EMAP) and the EPA Office of Water's National Lakes Assessment through cooperative agreement #CR-818606 with Oregon State University and contract #68040019 with ManTech Corporation. Bob Hughes was supported in manuscript preparation during sabbatical in Brazil by grant 00011/09 from Fundacao de Amparo a Pesquisa do Estado de Minas Gerais (FAPEMIG), and Companhia Energetica de Minas Gerais (CEMIG).
References
- Allen AP, Whittier TR, Kaufmann PR, Larsen DP, O’Conner RJ, Hughes RM, Stemberger RS, Dixit SS, Brinkhurst RO, Herlihy AT, Paulsen SG. 1999. Concordance of taxonomic richness patterns across multiple assemblages in lakes of the northeastern United States. Can J Fish Aquatic Sci. 56:739–747.
- Bain MB, Finn JT, Booke HE. 1985. Quantifying stream substrate for habitat analysis studies. N Am J Fish Manage. 5:499–500.
- Faustini JM, Kaufmann PR. 2007. Adequacy of visually classified particle count statistics from regional stream habitat surveys. J Am Water Resour As. 43:1293–1315.
- Hart JF. 1984. Resort areas in Wisconsin. Geogr Rev. 74:192–217.
- Hughes RM, Paulsen SG, Stoddard JL. 2000. EMAP-Surface Waters: a national, multiassemblage, probability survey of ecological integrity. Hydrobiologia. 422/423:429–443.
- Hughes RM, Peck DV. 2008. Acquiring data for large aquatic resource surveys: the art of compromise among science, logistics, and reality. J N Am Benthol Soc. 27:837–859.
- Hutchinson GE. 1957. A Treatise on Limnology, Vol. I: Geography, Physics and Chemistry. New York: Wiley.
- Jennings MJ, Bozek MA, Hatzenbeler GR, Emmons EE, Staggs MD. 1999. Cumulative effects of incremental shoreline habitat modification on fish assemblages in north temperate lakes. N Am J Fish Manage. 19:18–27.
- Kaufmann PR. 1993. Physical habitat. In: Hughes RM, editor. Stream Indicator and Design Workshop. Corvallis (OR ): US Environmental Protection Agency; EPA/600/R-93/138. p. 59–69.
- Kaufmann PR, Hughes RM. 2006. Geomorphic and anthropogenic influences on fish and amphibians in Pacific Northwest coastal streams. In: Hughes RM, Wang L, Seelbach PW, editors. Landscape influences on stream habitat and biological assemblages. American Fisheries Society Symposium 48. Bethesda (MD). p. 429–455.
- Kaufmann PR, Hughes RM, Whittier TR, Bryce SA, Paulsen SG. ( 2014a). Relevance of lake physical habitat assessment indices to fish and riparian birds. . Lake Reservoir Manage. 30:177–191.
- Kaufmann PR, Larsen DP, Faustini JM. 2009. Bed stability and sedimentation associated with human disturbances in Pacific Northwest streams. J Am Water Resour As. 45:434–459.
- Kaufmann PR, Levine P, Robison EG, Seeliger C, Peck DV. 1999. Quantifying physical habitat in wadeable streams. Washington (DC ): US Environmental Protection Agency, Office of Research and Development; EPA/620/R-99/003; [cited Apr 2011]. . Available from: http://www.epa.gov/emap/html/pubs/docs/groupdocs/surfwatr/field/phyhab.html
- Kaufmann PR, Peck DV, Paulsen SG, Seeliger CW, Hughes RM, Whittier TC, Kamman NC. (. 2014b). Lake shoreline and littoral habitat structure and disturbance in a national lakes assessment. Lake Reservoir Manage. . 30:192–215.
- Kaufmann PR, Whittier TR. 1997. Habitat assessment. In: Baker JR, Peck DV, Sutton DW, editors. Environmental Monitoring and Assessment Program - Surface Waters: field operations manual for lakes. Washington (DC ): US Environmental Protection Agency, Office of Research and Development; EPA/620/R-97/001. p. . 5-1 to 5-26.
- Kincaid TM, Larsen DP, Urquhart NS. 2004. The structure of variation and its influence on the estimation of status: indicators of condition of lakes in the Northeast USA. Environ Monit Assess. 98:1–21.
- Larsen DP, Christie SJ, editors. 1993. EMAP-Surface Waters 1991 Pilot Report. Washington (DC ): US Environmental Protection Agency, Office of Research and Development; EPA/620/R-93/003.
- Larsen DP, Kaufmann PR, Kincaid TM, Urquhart NS. 2004. Detecting persistent change in the habitat of salmon-bearing streams in the Pacific Northwest. Can J Fish Aquat Sci. 61:283–291.
- Larsen DP, Kinkaid TM, Jacobs SE, Urquhart NS. 2001. Designs for evaluating local and regional scale trends. BioScience. 51(12):1069–1078.
- Larsen DP, Thornton KW, Urquhart NS, Paulsen SG. 1994. The role of sample surveys for monitoring the condition of the Nation's lakes. Environ Monit Assess. 32:101–134.
- Larsen DP, Urquhart NS. 1993. A framework for evaluating the sensitivity of the EMAP design. In Larsen DP, Christie SJ, editors. EMAP-Surface Waters 1991 Pilot Report. Washington, (DC ): US Environmental Protection Agency, Office of Research and Development; EPA/620/R-93/003. p. 119–155.
- Littel RC, Milliken GA, Stroup WW, Wolfinger RD, Schabenberger O. 2006. SAS for mixed models, 2nd ed. Cary (NC ): SAS Institute. . 814 p.
- MacDonald LH, Smart AW, Wismar RC. 1991. Monitoring guidelines to evaluate effects of forestry activities on streams in the Pacific Northwest and Alaska. Seattle (WA ): US Environmental Protection Agency, Region X; EPA 910/9-91-001.
- Macedo DR, Ligeiro R, Ferreira WR, Junqueira NT, Sanches BO, Silva DRO, Alves CBM, Hughes RM, Kaufmann PR, Pompeu PS, et al. 2012. Parâmetros biológicos e de habitats físicos para avaliação de bacias no Sudeste do Brasil. Ação Ambiental. 47:15–18.
- Molozzi J, França JS, Araujo TLA, Viana TH, Hughes RM, Callisto M. 2011. Diversidade de habitats físicos e sua relação com macroinvertebrados bentônicos em reservatórios urbanos. Iheringia Sér Zool. 101:191–199.
- Omernik JM. 1987. Ecoregions of the conterminous United States. Ann Assoc Am Geogr. 77:118–125.
- Paulsen SG, Larsen DP, Kaufmann PR, Whittier TR, Baker JR, Peck DV, Mcgue J. Stevens D, Stoddard J, Hughes RM, et al. 1991. Environmental Monitoring and Assessment Program (EMAP)–Surface waters monitoring and research strategy. Corvallis (OR ): US Environmental Protection Agency.
- Paulsen SG, Mayio A, Peck DV, Stoddard JL, Tarquinio E, Holdsworth SM, Van Sickle J, Yuan LL, Hawkins CP, Herlihy AT, et al. 2008. Condition of stream ecosystems in the US: an overview of the first national assessment. J N Am Benthol Soc. 27:812–821.
- Peck DV, Herlihy AT, Hill BH, Hughes RM, Kaufmann PR, Klemm DJ, Lazorchak JM, McCormick FH, Peterson SA, Ringold PL, et al. 2006. Environmental Monitoring and Assessment Program – Surface Waters: Western pilot study field operations manual for wadeable streams. Washington (DC ): US Environmental Protection Agency, Office of Research and Development; EPA/620/R-06/003.
- Peck DV, Olsen AR, Weber MH, Paulsen SG, Peterson C, Holdsworth SM. 2013. Survey design and extent estimates for the National Lakes Assessment. Freshwater Sci. 32:1231–1245.
- Platts WS, Megahan WF, Minshall GW. 1983. Methods for evaluating stream, riparian and biotic conditions. Ogden (UT ): US Forest Service, Intermountain Forest and Range Experiment Station; Gen. Tech. Rep. INT-138.
- Rowan JS, Carwardine J, Duck RW, Bragg OM, Black AR, Cutler JEJ, Soutar I, Boon PJ. 2006. Development of a technique for Lake Habitat Survey (LHS) with applications for the European Union Water Framework Directive. Aquat Conserv. 16:637–657.
- Sass GG, Kitchell JE, Carpenter SR, Hrabik TR, Marburg AE, Turner MG. 2006. Fish community and food web responses to a whole-lake removal of coarse woody habitat. Fisheries. 31:321–330.
- Schindler DE, Scheuerell MD. 2002. Habitat coupling in lake ecosystems. Oikos. 98:177–189.
- Shapiro MH, Holdsworth SM, Paulsen SG. 2008. The need to assess the condition of aquatic resources in the US. J N Am Benthol Soc. 27:808–811.
- Stoddard JL, Herlihy AT, Hill BH, Hughes RM, Kaufmann PR, Klemm DJ, Lazorchak JM, McCormick FH, Peck DV, Paulsen SG, et al. 2006. Mid- Atlantic Integrated Assessment (MAIA): state of the flowing waters report. Washington (DC ): US Environmental Protection Agency, Office of Research and Development; EPA/620/R-06/001.
- Stoddard JL, Peck DV, Olsen AR, Larsen DP, Van Sickle J, Hawkins CP, Hughes RM, Whittier TR, Lomnicky G, Herlihy AT, et al. 2005a. Environmental Monitoring and Assessment Program (EMAP) — Western streams and rivers statistical summary. Washington (DC ): US Environmental Protection Agency, Office of Research and Development; EPA 620/R-05/006.
- Stoddard JL, Peck DV, Paulsen SG, Van Sickle J, Hawkins CP, Herlihy AT, Hughes RM, Kaufmann PR, Larsen DP, Lomnicky G, et al. 2005b. An ecological assessment of western streams and rivers. Washington (DC ): US Environmental Protection Agency, Office of Research and Development; EPA 620/R- 05/005.
- Thomas GL, Thiesfeld SL, Bonar SA, Crittenden RN, Pauley GB. 1990. Estimation of submergent plant bed biovolume using acoustic range information. Can J Fish Aquat Sci. 47:805–812.
- [USEPA] US Environmental Protection Agency. 2007. Survey of the nation's lakes. Field operations manual. Washington (DC ): US Environmental Protection Agency; EPA 841—B—07—004.
- [USEPA] US Environmental Protection Agency. 2009. National Lakes Assessment—a collaborative survey of the Nation's lakes. Washington (DC ): US Environmental Protection Agency, Office of Water; EPA 841-R-09-001.
- [USEPA] US Environmental Protection Agency. 2013. National River and Stream Assessment – a collaborative survey. Washington (DC ): US Environmental Protection Agency; Office of Research and Development; Office of Wetlands, Oceans, and Water; EPA/841/D-13/001.
- Van Sickle J. 2013. Estimating the risks of multiple, covarying stressors in the National Lakes Assessment. Freshwater Sci. 32:204–216.
- Van Sickle J, Hawkins CP, Larsen DP, Herlihy AT. 2005. A null model for the expected macroinvertebrate assemblage in streams. J N Am Benthol Soc. 24(1):178–191.
- Wetzel RG, Likens GE. 1991. Limnological Analyses. New York (NY ): Springer-Verlag.
- Whittier TR, Paulsen SG, Larsen DP, Peterson SA, Herlihy AT, Kaufmann PR. 2002. Indicators of ecological stress and their extent in the population of northeastern lakes: a regional-scale assessment. BioScience. 52:235–247.
- Zar JH. 1999. Biostatistical Analysis, 4th ed. Upper Saddle River (NJ ): Prentice-Hall.