
Abstract
Xiong C, Hoyer MV. Influence of land use and rainfall variability on nutrient concentrations in Florida lakes. Lake Reserv Manage. 35:25–37.
This research examined impacts of regional differences (total phosphorus zones [TP Zones]), land uses within watersheds (agriculture, urban, forest and wetland), and rainfall variability on nutrient concentrations (phosphorus and nitrogen) in Florida lakes (n = 87). Nutrient concentrations varied directly with TP Zones, which can be used as background nutrient concentrations within regions of Florida. After accounting for regional differences, lakes within watersheds with high percent agriculture tended to have higher nutrient concentrations, though relationships with nitrogen were strongest, suggesting different nutrient-transport mechanisms. Lakes within watersheds with high percent urban development showed no significant effect on nutrient concentrations, suggesting good nutrient management in urban areas. Lakes in watersheds dominated by forested land cover had low nitrogen concentration reflecting nutrient-buffering capabilities of forest stands. Lakes in watersheds with greater wetland coverage tended to have high nutrient concentrations, conflicting with previous studies and reflecting the complex nutrient-related processes that occur within wetlands. Cumulative rainfall deviations measured over a 20 yr period were significantly correlated (both positively and negatively) with nutrient concentrations within approximately 40% of the study lakes and the mechanisms driving these relations may overshadow impacts of land use within watersheds and changes in land use over time on lake nutrient concentrations. A thorough investigation of watershed land uses and relations between rainfall and limnological mechanisms must be considered before applying a nutrient management strategy to individual lakes.
Pioneers of limnology and current researchers recognize that regional conditions, such as geology, terrestrial vegetation, soil characteristics, and climate, are major factors influencing the basic nutrient concentrations in lakes (Naumann Citation1929, Taranu and Gregory-Eaves Citation2008, Bigham-Stephens et al. Citation2015). Within larger regional scales, local conditions such as land use practices, landscape position, hydrology, and rainfall pattern also significantly impact water quality (Soranno et al. Citation2010, Read et al. Citation2015). Understanding the cross-scale interactions between regional and local conditions is necessary to understand and manage individual lake systems (Soranno et al. Citation2014, Canfield et al. Citation2016).
Nationwide, the Clean Water Act (CWA) has been instrumental in managing point-source pollution; however, non-point-source pollution remains the next target of the CWA (Oberstar Citation2002). It is difficult to effectively regulate or control non-point sources, which are usually associated with land use within watersheds (Carpenter et al. Citation1998, Keatley et al. Citation2011). Identifying the impacts of various land use practices will provide guidelines to help achieve the overall goal of the CWA.
Agricultural and urban land uses are suggested to exert the greatest influence on nutrient concentrations in water bodies (Foley et al. Citation2005, Taranu and Gregory-Eaves Citation2008, Bigham-Stephens et al. Citation2015). Agricultural practices such as livestock rearing and cropping usually involve surplus manure and chemical fertilizer applications (McFarland and Hauck Citation1999, Berka et al. Citation2001). Urbanization usually involves wastewater discharge and abundant stormwater runoff from impervious surfaces (Wang Citation2001). Conversely, forest and wetland land uses are thought to have a positive influence on water quality by absorbing nutrients and slowing down and decreasing surface water runoff (Johnston Citation1991, Detenbeck et al. Citation1993, Sliva and Williams Citation2001).
Rainfall and its impact on lake levels and hydrologic variability is another factor that impacts water quality (Hoyer et al. Citation2005, Whitehead et al. Citation2009). Impacts of land use on water quality are evident, but some studies suggest that precipitation variability can overshadow the effects of land use (Tasdighi et al. Citation2017). For example, Canfield et al. (Citation2016) showed increases in specific conductance and total phosphorus during decadal decreases in rainfall and hypothesized that this was related to a region-wide evaporation and concentration effect that overshadowed measured changes in land use. There is evidence that rainfall could have either positive or negative relationships with lake nutrient concentrations (Kleinman et al. Citation2006, Jeppesen et al. Citation2009). Whether rainfall influence is positive, negative, or neutral seems to be a function of rainfall’s deviation from normal geology, hydrology, land use types/changes and interactions among factors that drive individual lake mechanisms, suggesting that more work must be done in individual lake systems to better understand these relationships (Hoyer et al. Citation2005; Soranno et al. Citation2014).
The main purpose of this study was to assess the impacts of land use within Florida watersheds on lake water nutrient concentrations, after accounting for the regional effects on nutrient concentrations. Local rainfall deviation was also evaluated as a potential factor influencing nutrient concentrations in individual lake waters. The objectives of this study were to (1) determine if regional characteristics (total phosphorus zones; Bachmann et al. Citation2012) and percent land uses (agriculture, urban, forest, and wetland) account for significant variance in total phosphorus and total nitrogen concentrations of lakes throughout Florida within 2 discrete time periods and over time separated by 20 yr, and (2) compare continuous annual mean water total phosphorus and total nitrogen data to annual regional rainfall data for individual lakes throughout Florida during the same 20 yr period to determine if there are significant correlations between rainfall amounts and nutrient concentrations within individual lakes.
Study site
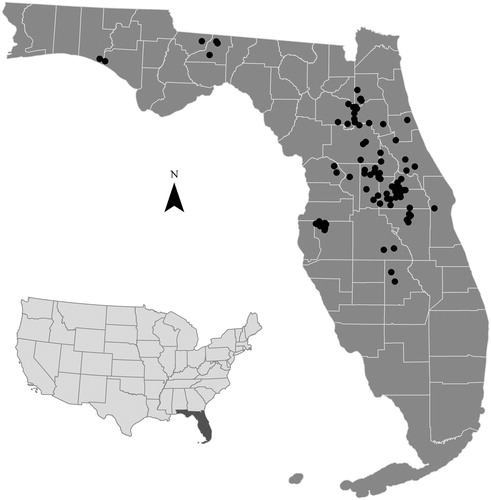
Lakes used in this analysis (n = 87) were chosen from Florida LAKEWATCH, a long-term monitoring database (Hoyer et al. Citation2014). Lakes with at least 20 yr (1989 through 2010) of continuous nutrient data were selected for analysis. These lakes span Florida from Walton County in the Panhandle to Highlands County at the southern end of the Lake Wales Ridge (). The relative abundance of lakes from each region in this study corresponded with the distribution of lakes throughout the state (Griffith et al. Citation1997), so the studied sample population of lakes is representative of the statewide lake population in morphometry and water quality characteristics. Lake size ranged from <1 to >7000 ha and watershed size ranged from <10 to >180,000 ha. Lakes also ranged from oligotrophic to hyper-eutrophic.
Figure 1. Locations of study lakes.
Materials and methods
Total phosphorus and total nitrogen data were obtained from the Florida LAKEWATCH database, which is a volunteer lake-monitoring program created in 1986 (Hoyer et al. Citation2014). LAKEWATCH field collections and laboratory analyses followed the methods of Canfield et al. (Citation2002). Volunteers collected monthly surface water samples for nutrient analyses in 250 mL acid-washed plastic Nalgene bottles and filtered water on sites or at their homes to collect planktonic algae for chlorophyll analysis. Both nutrient samples and chlorophyll filters were then frozen for later transport to the University of Florida’s LAKEWATCH laboratory where samples were analyzed. All samples for this study were analyzed between 2 and 5 mo of collection, which is within the prescribed LAKEWATCH holding time. For total phosphorus determination, LAKEWATCH personnel used a persulfate digestion method from Menzel and Corwin (Citation1965) and measured concentrations with the colorimetric procedures of Murphy and Riley (Citation1962). For total nitrogen determination, LAKEWATCH personnel followed a method described in Bachmann and Canfield (Citation1996) in which the sample was prepared using an autoclave and persulfate digestion (all nitrogen oxidized), and then all NO3 in the sample was measured and reported as total nitrogen. LAKEWATCH reported total phosphorus to 1 µg/L and total nitrogen to 10 µg/L.
Watersheds for each lake were delineated using Esri’s ArcMap software. The Land Use/Land Cover data were provided by the Florida Department of Environmental Protection (FDEP) and the 5 Florida Water Management Districts (WMDs). These data are collected approximately every 5 yr; we used data from 1989/1990 (hereafter 1990) and 2009/2010 (hereafter 2010). The FDEP oversees classification of aerial images for the Northwest Florida (NWFWMD) and Suwannee River (SRWMD) Water Management Districts because of insufficient resources in those 2 WMDs. The St. Johns River (SJRWMD), South Florida (SFWMD), and Southwest Florida (SWFWMD) Water Management Districts classify their own images. The FDEP, however, is responsible for compositing all the classified land use maps from the 5 WMDs into a single, seamless, statewide map. Classifications in all WMDs were based on the 1999 Florida Land Use, Cover and Forms Classification System (http://www.fdot.gov/geospatial/documentsandpubs/fluccmanual1999.pdf) by the Florida Department of Transportation (FDOT).
Three hierarchical levels of classification were used in creating the land use maps: level three has 158 land use types, level two combines level three into 27 land use types, and level one combines level two into 4 land use types. For this analysis, we used level one with 4 different land uses (agriculture, urban, forest, and wetland). Condensing the land use levels was accomplished by exporting the attribute data from the land use maps into an Excel spreadsheet and then summing the individual acreages within the level-three tier based on their relation to the level-one categories (agriculture, urban, forest, or wetland). Agriculture, urban, forest, and wetland were the only 4 land use categories employed in this analysis.
To examine regional impacts, lakes were placed in total phosphorus zones as defined by similar water chemistry, geology, soils, and hydrology; the zones were not all contiguous within Florida (Bachmann et al. Citation2012). Bachmann et al. (Citation2012) developed 6 phosphorus zones as a strategy to establish Florida numeric nutrient criteria; these are used in the USEPA-approved Florida nutrient criteria to define background nutrient condition. The lakes in this study fell only in Zone TP2 (n = 15), Zone TP3 (n = 36), and Zone TP4 (n = 36) ().
Table 1. Summary statistics for land use and nutrient data for 87 Florida lakes by total phosphorus zones (TP Zones; Bachmann et al. Citation2012). The number of lakes in each TP Zone is listed in parentheses. The mean values are recorded with the minimum and maximum values listed in parentheses. Means (2010) with an asterisk are significantly different from means measured in 1990.
Stepwise multivariate linear regression models (forward selection with minimum Bayesian information criteria to enter; SAS 2007) were run with total phosphorus and total nitrogen as the dependent variables with total phosphorus zone (Zone TP2, Zone TP3, or Zone TP4), time periods (1990 or 2010), and percent of the watershed in agriculture, urban, forest, and wetland as the independent variables. The total phosphorus and total nitrogen concentrations for these analyses were the average of all values measured in time periods 1990 (1989 and 1990 data) and 2010 (2009 and 2010 data). While Bachmann et al. (Citation2012) also developed total nitrogen zones, data were analyzed only using TP zones because all the lakes within the dataset had a total nitrogen to total phosphorus ratio (weight) > 10 with 90% of the lakes exceeding a ratio of 22, which indicates that nitrogen is not a significant limiting nutrient in these systems (Sakamoto Citation1966; Guildford and Hecky Citation2000).
Rainfall data were obtained from the Florida Climate Center site maintained by Florida State University (http://climatecenter.fsu.edu/climate-data-access-tools/downloadable-data). Rainfall data 5 yr prior to the time span of this study (1985 through 2010) were obtained to assess patterns leading up to the time of interest. Rainfall data were downloaded from stations nearest each lake in this study. Following procedures of Canfield et al. (Citation2016), precipitation data were manipulated to derive an adjusted, cumulative rainfall deviation (ACRD). Annual total rainfall values for each lake were averaged to yield the overall mean rainfall value for the period of record. The overall mean rainfall value was then subtracted from the individual annual rainfall values to get the precipitation surplus or deficit in each year. Successively adding the annual surplus and/or deficit deviations year by year throughout the 25 yr time span will give a cumulative series. Values within the whole cumulative series were then averaged and the absolute value of that cumulative average either was added, if the long-term average was negative, or subtracted, if the long-term average was positive, from each annual cumulative value in the series. The latter process scales the annual rainfall surplus and deficit around a long-term mean of zero.
Using all 20 yr of data, linear regression analyses with annual average nutrient concentrations (TP and TN) as the dependent variables and year as the independent variable were used to classify individual lakes as showing a positive (1), negative (−1), or no (0) significant trend. Multivariate ordinal logistic regression models were then run with temporal trends in total phosphorus and total nitrogen (−1, 0, 1) as the dependent variables and percent land use change from 1990 to 2010 of agriculture, urban, forest, and wetland within watersheds as the independent variables.
An additional analysis was conducted to assess relationships between changes in ACRD (rainfall) and changes in nutrient concentration over time (1990 to 2010) within individual lakes. Using linear regression analyses with nutrients (TP and TN) as the dependent variable and ACRD as the independent variable, lakes were classified as showing positive (1), inverse (−1), or no (0) significant relations between rainfall and nutrient concentrations. Multivariate ordinal logistic regression models were then run with rainfall relations with total phosphorus and total nitrogen (−1, 0, 1) as the dependent variables and percent land use change from 1990 to 2010 of agriculture, urban, forest, and wetland within watersheds as the independent variables.
Statistical analyses were conducted in R statistical software version 3.2.2. (R Core Team Citation2015) and JMP12 software (SAS Institute Inc. Citation2007). Nutrient concentration data were log-transformed, and percent data were arcsine-transformed where needed to increase normality of the data distribution (Gotelli and Ellison Citation2013).
Results
The lakes in this study ranged in size from 0.8 ha to over 7000 ha and their watersheds ranged from 16.8 ha to over 180,000 ha (). For the time periods of 1990 and 2010, total phosphorus and total nitrogen concentrations were 4–127 µg/L and 63–3000 µg/L, respectively. From 1990 to 2010, average total nitrogen concentration for lakes in Zone TP3 showed a significant increase (mean of 36 lakes) from 655 µg/L to 811 µg/L. For the study period, agricultural land uses within watersheds ranged from 0% to 63%, showing a significant decrease from 1990 to 2010 within Zone TP3 from 21% to 12.1%. Urban land uses within watersheds ranged from 0% to 100%, showing a significant increase (mean of 36 lakes) from 1990 to 2010 within Zone TP3 from 35.8% to 48.1%. Forest and wetland land uses within watersheds ranged from 0% to 100% and 0% to 44.8%, respectively.
Using data from 2 discrete time periods (1990 and 2010), stepwise multivariate linear regression was run with total phosphorus as the dependent variables and TP Zones, time periods, and percent land uses of watersheds as the independent variables. After the stepwise forward selection, only TP zone, percent agriculture, and percent wetland remained in the model accounting for 49% of the variance in total phosphorus (R2 = 0.49, P < 0.05; ). Lake total phosphorus concentration increased with TP Zones, percent agriculture, and percent wetland coverage. TP Zone showed the largest effect and land use variables showed similar effect sizes.
Table 2. Output from stepwise multivariate linear regression models with total phosphorus and total nitrogen as the dependent variables and total phosphorus zone (Zone TP2, Zone TP3, or Zone TP4; Bachmann et al. Citation2012), time periods (1990 or 2010), and percent of the watershed in agriculture, urban, forest, and wetland land uses as the independent variables. Nutrient concentration data were log-transformed, and percent data were arcsine-transformed.
Using data from 2 discrete time periods (1990 and 2010), stepwise multivariate linear regression was run with total nitrogen as the dependent variables and TP Zones, time periods, and percent land uses of watersheds as the independent variables. After stepwise forward selection, only TP Zones, time period, percent agriculture, percent forest, and percent wetland remained in the model, accounting for 58% of the variance in total nitrogen (R2 = 0.58, P < 0.05; ). Total nitrogen increased with TP Zones, time period, percent agriculture, and percent wetland coverage. Total nitrogen decreased with increasing percent forest. TP Zones showed the largest effect, time period the smallest effect, and land use variables had similar size effects.
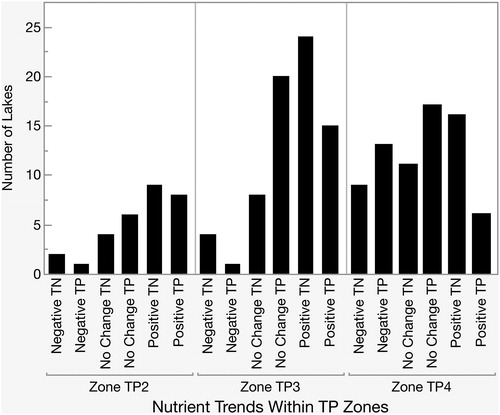
Using continuous annual mean data from 1990 to 2010 for each lake, linear regressions with total phosphorus and total nitrogen as dependent variables and year as the independent variable showed that individual lakes had significant negative (n = 15), positive (n = 29), and no (n = 43) trends in total phosphorus concentration over time (). Similarly, individual lakes had significant negative (n = 15), positive (n = 49), and no (n = 23) changes in total nitrogen concentration from 1990 to 2010. There were significant increases, decreases, and no changes over time for both nutrients and in all 3 TP Zones; however, trends in total phosphorus and total nitrogen did not always parallel each other within individual lakes. Trends in total phosphorus and total nitrogen paralleled in 9 lakes with negative trends, 15 lakes with no change, and 25 lakes with positive trends ().
Figure 2. Frequency distribution of lakes with positive, negative, and no change in nutrient concentrations (total phosphorus and total nitrogen) over time listed within TP Zones (Bachmann et al. Citation2012) where the lakes reside.
Multivariate ordinal logistic regression with temporal trends in total phosphorus and total nitrogen (−1, 0, 1) as the dependent variables and TP Zones, percent land use change from 1990 to 2010 of agriculture, urban, forest, and wetland within watersheds as the independent variables were significant, accounting for only 11% and 6% of the variance in trend classification, respectively (). For total phosphorus and total nitrogen trend classification, only TP zones showed direct significant effects.
Table 3. Output from multivariate ordinal logistic regression models with total phosphorus and total nitrogen trend group (1 increase, 0 no change, −1 decrease) as the dependent variables and TP Zone, percent change from 1990 to 2010 within the watershed in agriculture, urban, forest, and wetland land use as the independent variables. Nutrient concentration data were log-transformed, and percent change data were normally distributed requiring no transformation.
Using continuous annual mean data from 1990 to 2010, linear regressions showed that total phosphorus and ACRD had significant negative (n = 7), positive (n = 25), and no relationships (n = 55) over time. Linear regression analyses also showed that total nitrogen and ACRD had significant negative (n = 11), positive (n = 13), and no (n = 63) relationships from 1990 to 2010. The significant relations between ACRD and total phosphorus and total nitrogen did not always parallel each other in individual lakes. The significant relations between ACRD and total phosphorus and total nitrogen paralleled in 5 lakes with negative trends, 45 lakes with no change, and 11 lakes with positive trends (). Multivariate ordinal logistic regression with relationships between total phosphorus and total nitrogen and ACRD (−1, 0, 1) as the dependent variables and TP Zones, percent land use change from 1990 to 2010 of agriculture, urban, forest, and wetland within watersheds as the independent variables were not significant ().
Figure 3. Frequency distribution of lakes with positive, negative, and no relation between nutrient concentrations (total phosphorus and total nitrogen) and adjusted cumulative rainfall deviations (ACRD) over time listed within TP Zones (Bachmann et al. Citation2012) where the lakes reside.
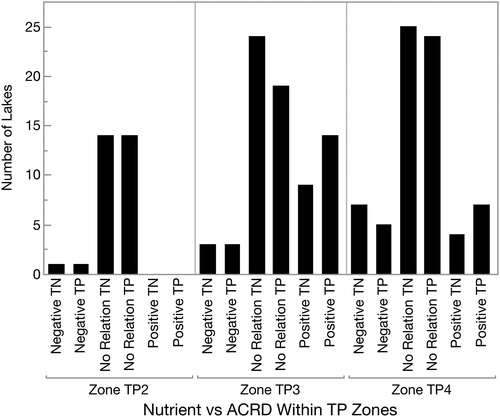
Table 4. Output from multivariate ordinal logistic regression model with the relationship between total phosphorus and total nitrogen with rainfall group (ACRD: 1 increase, 0 no change, −1 decrease) as the dependent variables and TP Zone, percent change from 1990 to 2010 within the watershed in agriculture, urban, forest, and wetland land use as the independent variables. Nutrient concentration data were log-transformed, and percent data and percent change data were normally distributed requiring no transformation.
Discussion
To date, numerous investigators have shown that nutrient concentrations in lakes are influenced to a large extent by regional conditions (Filstrup et al. Citation2014, Bigham-Stephens et al. Citation2015). The analyses in this study support these findings showing a direct relation between the TP Zones defined by Bachmann et al. (Citation2012) and nutrient concentrations among Florida lakes. For total phosphorus concentrations in lakes, after accounting for regional effects with stepwise multivariate linear regression, time period (1990–2010) showed no significant effect suggesting that there was no significant change in phosphorus among a population of Florida lakes over a 20 yr period. However, time period showed a significant but small direct effect on total nitrogen among lakes suggesting that factors impacting nutrient concentrations in lakes over time may be affecting nitrogen concentration more than phosphorus concentrations. Khare et al. (Citation2012) did a similar study in west-central Florida over a 34 yr time span and reported similar results. However, Oliver et al. (Citation2017) found that land use and climate change had more of an impact on TP changes in some lakes rather than TN in parts of the Northeastern and Midwestern United States. The differences in results suggest that factors impacting nitrogen and phosphorus concentrations differentially may vary regionally.
Percent agriculture and percent wetland both showed significant direct effects on both total phosphorus and total nitrogen among lakes, and percent forest showed an inverse effect of total nitrogen concentrations among lakes. The multivariate linear regressions suggest that agriculture is directly related to nutrient concentrations in lakes supporting previous studies that concluded agriculture has the potential to cause increases in nutrient concentration of some lakes (McFarland and Hauck Citation1999, Berka et al. Citation2001, Cross and Jacobson Citation2013).
Looking at the individual lake trend analyses also showed that 49 lakes had increasing total nitrogen concentrations from 1990 to 2010 while only 29 lakes showed increasing total phosphorus trends. Similar results have been found in other studies in different countries (Dunn et al. Citation2014, Wang et al. Citation2014), suggesting that land use changes over time may influence both total phosphorus and total nitrogen in lakes but they may have a greater influence on total nitrogen concentrations. The stronger relationships with total nitrogen concentrations argues for different transport mechanisms of phosphorus and nitrogen (Follett and Delgado Citation2002, Fraterrigo and Downing Citation2008).
Phosphorus in soils occurs mainly in the stable or fixed form because of its tendency to be tightly adsorbed onto soil particles or bound with other geological constituents (Hansen et al. Citation2002). Because of the high association of phosphorus with soil particles, soil erosion in surface runoff is typically the main phosphorus transport mechanism (Sharpley et al. Citation1995). Nitrogen in mineral soils occurs mostly in a soluble form (e.g., nitrate), enabling high mobility in both surface and ground water (Wall Citation2013). Various management practices have been able to decrease soil loss from agricultural fields (Maass et al. Citation1988), thereby hindering the transport of phosphorus and, to an extent, nitrogen to nearby water bodies. However, managing the hydrogeology of agricultural fields can be difficult and since nitrate can travel underground, this makes it hard to mitigate the impacts of groundwater nitrogen inputs to downstream water bodies. Domagalski et al. (Citation2008) did a comparative study of nutrient transport rates in agricultural basins and showed that nitrate in all cases had higher yields than phosphate, allowing greater inputs of nitrate to nearby water bodies.
It was surprising that percent urban land use showed no significant effect on lake nutrient concentrations because many studies suggest that, as urban development increases within watersheds, nutrient concentrations in the receiving waters generally increase (Bonansea et al. Citation2016, Ferreira et al. Citation2017). However, Reavie et al. (Citation2006) found similar results with agriculture overwhelmingly impacting nutrient enrichment of the coastal Great Lakes, while urban development had no significant effect. The lack of significant urban development effects on lake nutrient concentrations are contrary to the suggestion that urban development is a major factor contributing to increases in nutrient concentration of lakes (Ding et al. Citation2015, Tasdighi et al. Citation2017). However, for these Florida lakes there is an inverse correlation between percent land use in agriculture and that of urban land use in both 1990 and 2010 and, over time, percent agriculture decreased as percent urban increased. These inverse relationships may mask urban impacts on nutrient concentrations in Florida lakes.
Lack of significant effects between percent urban land use and nutrient concentration could also be a result of high-efficiency wastewater treatment. Novel methods, such as the use of micro-algae, are being used in municipal treatment facilities to reduce nutrient concentrations in wastewater (Rajasulochana and Preethy Citation2016). Although new wastewater treatments are gaining popularity, conventional wastewater treatment methods, such as septic tanks, are still used widely and can be a major source of nutrients, especially nitrogen, in urban areas (Reay Citation2004, Withers et al. Citation2011). Spirandelli (Citation2015), however, evaluated wastewater infrastructure along an urbanization gradient and found that septic tank density decreased as urbanization increased, suggesting that septic tanks may have less impact in highly urbanized areas. Investment in stormwater infrastructure within urbanization has also been shown to reduce the amount of nutrients that enter downstream water bodies (Bernhardt et al. Citation2008).
Percent forest land use had no significant effects on total phosphorus and an inverse effect with total nitrogen concentrations among lakes. Tasdighi et al. (Citation2017) also found that forest land uses had significant correlations with water quality. Significant negative effect between forest land uses and total nitrogen concentrations support previous studies (Tu Citation2013, Kändler et al. Citation2017) that suggested forest land use has a positive influence on nutrient concentrations in lakes. By acting as a sediment trap and reducing water movement, forested land can hinder the transport of nitrate and phosphate and serve as a nutrient sink (Lowrance et al. Citation1984).
Like urban land use, the effect between percent wetland and lake nutrient concentrations does not support many previous findings. Several studies suggest that wetlands are nutrient retention areas and act as nutrient sinks, thereby preventing nutrients from reaching downstream water bodies (Zhang et al. Citation2000, Jordan et al. Citation2003). Percent wetland had a direct relationship with total phosphorus and total nitrogen concentrations among lakes suggesting that wetlands may contribute to water nutrient concentrations in some Florida lakes. Fisher and Acreman (Citation2004) reviewed wetland studies from around the world and concluded that under certain situations wetlands do increase total phosphorus and total nitrogen loading to downstream water bodies. Fisher and Acreman (Citation2004) suggested that vegetation was among the most important factors that determine the nutrient retention ability of wetlands. Howard-Williams (Citation1985) suggested that rooted plants in wetlands can act as “pumps,” taking up nutrients from the wetland sediments and releasing them into the water column when they senesce. A survey conducted in 1996 reported that 98% of Florida’s wetlands were vegetated with woody and rooted plants (Dahl Citation2005). Johnston (Citation1991) indicated that leaching of nutrients from decomposing herbaceous and woody wetland plants can be a source of high nutrient flux within wetland systems. The high number of wetlands in Florida with rooted vegetation, and the nutrient flux that occurs when they decay, may account for the unconventional relationship between wetland cover and water nutrient concentrations found in this study.
Examination of temporal changes in land use and concurrent trends in total phosphorus and total nitrogen concentrations showed extremely weak relationships and that TP Zone is the only factor significantly related to total phosphorus and total nitrogen trends. This was surprising because the number of significant effects between land use and nutrient concentrations within 2 discrete time periods (1990 and 2010). It is possible that land use changes that occurred during this study (∼20 yr) were not large enough to impact nutrient concentrations in the lakes. Khare et al. (Citation2012) conducted a similar study on the Hillsborough River and Alafia River watersheds in Florida over a 34 yr time span and found similar results. Over almost the same time period (1990 to 2013), Oliver et al. (Citation2017) showed a similar lack of relations among a population of almost 3000 lakes of the Northeast and Midwest. Our results may agree with the findings of Canfield et al. (Citation2016) who suggest that other factors may overshadow the influence of land use change over time on nutrient concentrations in individual Florida lakes.
Aside from land use, there are multiple factors that have been shown to impact nutrient concentrations in lakes including rainfall (Canfield et al. Citation2016, Ockenden et al. Citation2016). Obviously, rainfall impacts nutrient loading to lakes (Fraterrigo and Downing Citation2008); it impacts lake water level and as water level changes in a lake, multiple limnological mechanisms can work together or individually to influence nutrient concentration (Hoyer et al. Citation2005). For example, as water level decreases in some shallow lakes, strong winds can sometimes re-suspend bottom sediments and release sediment-bound nutrients back into the water column (Nagid et al. Citation2001). Reduced water levels in other lakes can expose more of the littoral zone to photosynthetically active radiation (PAR) and increase macrophyte abundance, thus leading to lower nutrient concentrations (Blindow Citation1992, Scheffer Citation2004).
Multiple lakes in this study showed significant positive and negative relations between ACRD and nutrient concentration supporting the contention that rainfall deviations drive different in-lake mechanisms that ultimately determine nutrient concentrations. Both positive and negative correlations between rainfall and nutrient concentration have been reported in other studies as well (Kleinman et al. Citation2006, Jeppesen et al. Citation2009). In this study, the percentage of land use change in agriculture, urban, forest, and wetlands over 20 yr showed no significant effect on either trend in nutrient concentrations or relations between nutrient concentrations and ACRD. This supports the hypothesis that other lake mechanisms may be overshadowing impacts of land use change.
Ockenden et al. (Citation2016) suggested that nutrient concentrations will increase in water bodies during times of high rainfall because of the influx of nutrients in runoff water. Others, however, suggest that nutrient concentrations will decrease when rainfall increases, because of dilution from increasing water levels (Jeppesen et al. Citation2009). Hoyer et al. (Citation2005) suggested that when water level changes (i.e., inputs from rainfall), internal lake mechanisms can cause changes in nutrient concentrations. Whether rainfall causes an influx of nutrients, serves to dilute in-lake nutrients, or triggers internal mechanisms that influence nutrient concentrations in lake water, the relation between rainfall and water nutrient concentrations is complex.
In summary, nutrient concentrations in Florida lakes vary directly with TP Zones defined by Bachmann et al. (Citation2012), which can be used to define a range of background nutrient concentrations existing within different regions of Florida. Lakes with larger agricultural areas tended to show higher total phosphorus and total nitrogen concentrations, though relationships with total nitrogen were stronger probably because of different nutrient-transport mechanisms. Lakes surrounded by urban land uses tended to show low total phosphorus and total nitrogen concentrations, suggesting positive influences of wastewater treatment facilities and stormwater remediation. Watersheds dominated by forest land uses tended to have lakes with low total phosphorus and total nitrogen concentration, reflecting the potential nutrient-buffering capabilities of forest stands. Lakes in watersheds with greater wetland coverage tended to have high total phosphorus and total nitrogen concentration, conflicting with previous studies and reflecting the complex nutrient-related processes that occur within wetlands.
Variations in rainfall were negatively and positively correlated with changes in nutrient concentration over time in multiple lakes. The influence of rainfall/hydrology on nutrient concentrations in lakes is difficult to determine because it can impact many mechanisms (i.e., sediment resuspension, macrophyte density, lake morphology) that were not evaluated in this study but have been shown to impact nutrient concentrations in lakes. These impacts may have overshadowed the impacts of land use change among the population of lakes used in this study. Finally, this study suggests that land use and other mechanisms drive nutrient concentrations within Florida lakes and a thorough investigation of individual lakes should be considered before applying a standard nutrient management plan to individual water bodies.
Acknowledgments
We thank LAKEWATCH staff members and all the volunteers for building the database that made this project possible. We thank Jason Bennett for providing information needed to conceptualize a big part of this project. We thank Brian Beneke and Jennifer Bock of the Florida Fish and Wildlife Conservation Commission (FWC) for providing watershed data. We thank 3 anonymous reviewers and an associate editor for comments that made this a stronger manuscript.
References
- Bachmann RW, Canfield DE. 1996. Use of an alternative method for monitoring total nitrogen concentrations in Florida lakes. Hydrobiologia. 323(1):1–8.
- Bachmann RW, Bigham DL, Hoyer MV, Canfield DE Jr. 2012. A strategy for establishing numeric nutrient criteria for Florida lakes. Lake Reserv Manage. 28(1):84–91.
- Berka C, Schreier H, Hall K. 2001. Linking water quality with agricultural intensification in a rural watershed. Water Air Soil Poll. 127(1/4):389–401.
- Bernhardt ES, Band LE, Walsh CJ, Berke PE. 2008. Understanding, managing, and minimizing urban impacts on surface water nitrogen loading. Ann NY Acad Sci. 1134(1):61–96.
- Bigham-Stephens DL, Carlson RE, Canfield DE Jr, Horsburgh CA, Hoyer MV, Bachmann RW. 2015. Regional distribution of Secchi disk transparency in waters of the United States. Lake Reserv Manage. 31(1):55–63.
- Blindow I. 1992. Long- and short-term dynamics of submerged macrophytes in two shallow eutrophic lakes. Freshwater Biol. 28(1):15–27.
- Bonansea M, Ledesma C, Rodriguez MC. 2016. Assessing the impact of land use and land cover on water quality in the watershed of a reservoir. Appl Ecol Env Res. 14(2):447–456.
- Canfield DE Jr, Brown CD, Bachmann RW, Hoyer MV. 2002. Volunteer lake monitoring: testing the reliability of data collected by the Florida LAKEWATCH program. Lake Reserv Manage. 18(1):1–9.
- Canfield DE Jr, Hoyer MV, Bachmann RW, Stephens DB, Ruiz-Bernard I. 2016. Water quality changes at an Outstanding Florida Water: influence of stochastic events and climate variability. Lake Reserv Manage. 32(3):297–313.
- Carpenter SR, Caraco NF, Correll DL, Howarth RW, Sharpley AN, Smith VH. 1998. Nonpoint pollution of surface waters with phosphorus and nitrogen. Ecol Appl. 8(3):559–568.
- Cross TK, Jacobson PC. 2013. Landscape factors influencing lake phosphorus concentrations across Minnesota. Lake Reserv Manage. 29(1):1–12.
- Dahl TE. 2005. Florida’s wetlands: an update on status and trends 1985 to 1996. Washington (DC): United States Department of the Interior, Fish and Wildlife Service.
- Detenbeck NE, Johnston CA, Niemi GJ. 1993. Wetland effects on lake water quality in the Minneapolis/St. Paul metropolitan area. Landscape Ecol. 8(1):39–61.
- Ding J, Jiang Y, Fu L, Liu Q, Peng Q, Kang M. 2015. Impacts of land use on surface water quality in a subtropical river basin: a case study of the Dongjiang River basin, Southeastern China. Water. 7(12):4427–4445.
- Domagalski JL, Ator S, Coupe R, McCarthy K, Lampe D, Sandstrom M, Baker N. 2008. Comparative study of transport processes of nitrogen, phosphorus, and herbicides to streams in five agricultural basins, USA. J Environ Qual. 37(3):1158–1169.
- Dunn SM, Sample J, Potts J, Abel C, Cook Y, Taylor C, Vinten AJA. 2014. Recent trends in water quality in an agricultural catchment in Eastern Scotland: elucidating the roles of hydrology and land use. Environ Sci: Processes Impacts. 16(7):1659–1675.
- Ferreira ARL, Sanches Fernandes LF, Cortes RMV, Pacheco FAL. 2017. Assessing anthropogenic impacts on riverine ecosystems using nested partial least squares regression. Sci Total Environ. 583:466–477.
- Filstrup CT, Wagner T, Soranno PA, Stanley EH, Stow CA, Webster KE, Downing JA. 2014. Regional variability among nonlinear chlorophyll-phosphorus relationships in lakes. Limnol Oceanogr. 59(5):1691–1703.
- Fisher J, Acreman MC. 2004. Wetland nutrient removal: a review of the evidence. Hydrol Earth Syst Sci. 8(4):673–685.
- Foley JA, Defries R, Asner GP, Barford C, Bonan G, Carpenter SR, Chapin FS, Coe MT, Daily GC, Gibbs HK, et al. 2005. Global consequences of land use. Science. 309(5734):570–574.
- Follett RF, Delgado JA. 2002. Nitrogen fate and transport in agricultural systems. J Soil Water Conserv. 57(6):402–408.
- Fraterrigo JM, Downing JA. 2008. The influence of land use on lake nutrients varies with watershed transport capacity. Ecosystems. 11(7):1021–1034.
- Gotelli NJ, Ellison AM. 2013. A primer of ecological statistics. 2nd ed. Sunderland (MA): Sinauer Associates, Inc.
- Griffith GE, Canfield DE Jr, Horsburgh CA, Omernik JM. 1997. Lake Regions of Florida. Corvallis (OR): US Environmental Protection Agency; National Health and Environmental Effects Research Laboratory. EPA/R-97/217; [cited 23 May 2017]. Available from http://www.epa.gov/wed/pages/ecoregions/fl.eco.htm
- Guildford SJ, Hecky RE. 2000. Total nitrogen, total phosphorus, and nutrient limitation in lakes and oceans: is there a common relationship. Limnol Oceanogr. 45(6):1213–1223.
- Hansen NC, Daniel TC, Sharpley AN, Lemunyon JL. 2002. The fate and transport of phosphorus in agricultural systems. J Soil Water Conserv. 57(6):408–417.
- Howard-Williams C. 1985. Cycling and retention of nitrogen and phosphorus in wetlands: a theoretical and applied perspective. Freshwater Biol. 15(4):391–431.
- Hoyer MV, Bigham DB, Bachmann RW, Canfield DE Jr. 2014. Florida LAKEWATCH: citizen scientists protecting Florida’s aquatic systems. Fla Sci. 77(4):184–197.
- Hoyer MV, Horsburgh CA, Canfield DE Jr, Bachmann RW. 2005. Lake level and trophic state variables among a population of shallow Florida lakes and within individual lakes. Can J Fish Aquat Sci. 62(12):2760–2769.
- Jeppesen E, Kronvang B, Meerhoff M, Søndergaard M, Hansen KM, Andersen HE, Lauridsen TL, Liboriussen L, Beklioglu M, Özen A, Olesen JE. 2009. Climate change effects on runoff, catchment phosphorus loading and lake ecological state, and potential adaptations. J Environ Qual. 38(5):1930–1941.
- Johnston CA. 1991. Sediment and nutrient retention by freshwater wetlands: effects on surface water quality. Crit Rev Env Contr. 21(5–6):491–565.
- Jordan TE, Whigham DF, Hofmockel KH, Pittek MA. 2003. Nutrient and sediment removal by a restored wetland receiving agricultural runoff. J Environ Qual. 32(4):1534–1547.
- Kändler M, Blechinger K, Seidler C, Pavlů V, Šanda M, Dostál T, Krása J, Vitvar T, Štich M. 2017. Impact of land use on water quality in the upper Nisa catchment in the Czech Republic and in Germany. Sci Total Environ. 586:1316–1325.
- Keatley BE, Bennett EM, MacDonald GK, Taranu ZE, Gregory-Eaves I. 2011. Land-use legacies are important determinants of lake eutrophication in the Anthropocene. Plos One. 6(1):e15913. doi:10.1371/journal.pone.0015913.
- Khare YP, Martinez CJ, Toor GS. 2012. Water quality and land use changes in the Alafia and Hillsborough River watersheds, Florida, USA. J Am Water Resour As. 48(6):1276–1293.
- Kleinman PJA, Srinivasan MS, Dell CJ, Schmidt JP, Sharpley AN, Bryant RB. 2006. Role of rainfall intensity and hydrology in nutrient transport via surface runoff. J Environ Qual. 35(4):1248–1259.
- Lowrance R, Todd R, Fail J Jr, Hendrickson O Jr, Leonard R, Asmussen L. 1984. Riparian forests as nutrient filters in agricultural watersheds. Bioscience. 34(6):374–377.
- Maass JM, Jordan CF, Sarukhan J. 1988. Soil erosion and nutrient losses in seasonal tropical agroecosystems under various management techniques. J Appl Ecol. 25(2):595–607.
- McFarland AMS, Hauck LM. 1999. Relating agricultural land uses to in-stream stormwater quality. J Environ Qual. 28(3):836–844.
- Menzel DW, Corwin N. 1965. The measurement of total phosphorus in seawater based on the liberation of organically bound fractions by persulfate oxidation. Limnol Oceanogr. 10(2):280–282.
- Murphy J, Riley JP. 1962. A modified single solution method for the determination of phosphate in natural waters. Analytica Chimica Acta. 27:31–36.
- Nagid EJ, Canfield DE Jr, Hoyer MV. 2001. Wind-induced increases in trophic state characteristics of a large (27 km2), shallow (1.5 m mean depth) Florida lake. Hydrobiologia. 455:97–110.
- Naumann E. 1929. The scope and chief problems of regional limnology. Int Revue Ges Hydrobiol Hydrogr. 22(1):423–444.
- Oberstar JL. 2002. The clean water act: 30 years of success in peril. Washington (DC): United States House of Representatives, The House Committee on Transportation and Infrastructure. [cited 23 May 2017]. Available from http://lobby.la.psu.edu/_107th/117_Effluent_Limitation/frameset_effluent.html
- Ockenden MC, Deasy CE, Benskin CMWH, Beven KJ, Burke S, Collins AL, Evans R, Falloon PD, Forber KJ, Hiscock KM, et al. 2016. Changing climate and nutrient transfers: evidence from high temporal resolution concentration-flow dynamics in headwater catchments. Sci Total Environ. 548-549:325–339.
- Oliver SK, Collins SM, Soranno PA, Wagner T, Stanley EH, Jones JR, Stow CA, Lottig NR. 2017. Unexpected stasis in a changing world: lake nutrient and chlorophyll trends since 1990. Glob Change Biol. 2017:001–013.
- Rajasulochana P, Preethy V. 2016. Comparison on efficiency of various techniques in treatment of waste and sewage water–a comprehensive review. Resource Efficient Technologies. 2(4):175–184.
- R Core Team. 2015. R: a language and environment for statistical computing. Vienna, Austria: R Foundation for Statistical Computing.
- Read EK, Patil VP, Oliver SK, Hetherington AL, Brentrup JA, Zwart JA, Winters KM, Corman JR, Nodine ER, Woolway RI, et al. 2015. The importance of lake-specific characteristics for water quality across the continental United States. Ecol. Appl. 25(4):943–955.
- Reavie ED, Axler RP, Sgro RP, Danz GV, Kinjgston NP, Kireta JC, Brown AR, Hollenhorst TN, Ferguson MJ. 2006. Diatom-based weighted-averaging transfer functions for Great Lakes coastal water quality: relationships to watershed characteristics. J Great Lakes Res. 32:321–347.
- Reay WG. 2004. Septic tank impacts of ground water quality and nearshore sediment nutrient flux. Ground Water. 42(7):1079–1089.
- Sakamoto M. 1966. Primary production by phytoplankton community in some Japanese lakes and its dependence on lake depth. Arch Hydrobiol. 62:1–28.
- SAS Institute Inc. 2007. JMP Statistics and Graphics Guide. Cary (NC): SAS Institute, Inc.
- Scheffer M. 2004. Ecology of shallow lakes. Dordrecht, Netherlands: Springer.
- Sharpley A, Daniel TC, Sims JT, Pote DH. 1995. Determining environmentally sound soil phosphorus levels. J Soil Water Cons. 51(2):160–166.
- Sliva L, Williams DD. 2001. Buffer zones versus whole catchment approaches to studying land use impact on river water quality. Water Res. 35(14):3462–3472.
- Soranno PA, Cheruvelil KS, Bissell EG, Bremigan MT, Downing JA, Filstrup CT, Henry EN, Lottig NR, Stanley EH, Stow CA, et al. 2014. Cross-scale interactions quantifying multi-scaled cause-effect relationships in macrosystems. Front. Ecol. Environ. 12(1):65–73.
- Soranno PA, Cheruvelil KS, Webster KE, Bremigan MT, Wagner T, Stow CA. 2010. Using landscape limnology to classify freshwater ecosystems for multi-ecosystem management and conservation. BioScience. 60(6):440–454.
- Spirandelli D. 2015. Patterns of wastewater infrastructure along a gradient of coastal urbanization: a study of the Puget Sound Region. Land. 4(4):1090–1109.
- Taranu ZE, Gregory-Eaves I. 2008. Quantifying relationships among phosphorus, agriculture, and lake depth at inter-regional scale. Ecosystems. 11(5):715–725.
- Tasdighi A, Arabi M, Osmond DL. 2017. The relationship between land use and vulnerability to nitrogen and phosphorus pollution in an urban watershed. J Environ Qual. 46(5):113–122.
- Tu J. 2013. Spatial variations in the relationships between land use and water quality across an urbanization gradient in the watersheds of northern Georgia, USA. Environ Manage. 51(1):1–17.
- Wall D. 2013. Nitrogen in Minnesota surface waters. Saint Paul (MN): Minnesota Pollution Control Agency Report wq-s6-26a.
- Wang X. 2001. Integrating water-quality management and land-use planning in a watershed context. J Environ Manage. 61(1):25–36.
- Wang Y, Li Y, Liu X, Liu F, Li Y, Song L, Li H, Ma Q, Wu J. 2014. Relating land use patterns to stream nutrient levels in red soil agricultural catchments in subtropical central China. Environ Sci Pollut Res Int. 21(17):10481–10492.
- Whitehead PG, Wilby RL, Battarbee RW, Kernan M, Wade AJ. 2009. A review of the potential impacts of climate change on surface water quality. Hydrol Sci J. 54(1):101–123.
- Withers PJA, Jarvie HP, Stoate C. 2011. Quantifying the impact of septic tank systems on eutrophication risk in rural headwaters. Environ Int. 37(3):644–653.
- Zhang X, Feagley SE, Day JW, Conner WH, Hesse ID, Rybczyk JM, Hudnall WH. 2000. A water chemistry assessment of wastewater remediation in a natural swamp. J Environ Qual. 29(6):1960–1968.