
Abstract
Perrion MA, Kaemingk MA, Koupal KD, Schoenebeck CW, Bickford NA. 2019. Use of otolith chemistry to assess recruitment and habitat use of a white bass fishery in a Nebraska reservoir. Lake Reserv Manage. 36:64–74.
Managing fisheries that exhibit variable annual recruitment is challenging, and maintenance stockings are often prescribed to minimize interannual population variation. Maintenance stockings are costly and may not be necessary if sufficient natural recruitment is occurring. Therefore, developing tools and techniques that can collectively assess hatching origin and subsequent habitat use of individuals would be valuable. Herein, we aimed to assess the efficacy of otolith chemistry techniques to (1) determine whether there was evidence of natural recruitment within an annually stocked white bass population and (2) examine the potential to describe spatial reservoir use of these age-0 fish. A sample of hatchery-produced fingerling white bass (n = 17) was retained from a larger June 2015 stocking of white bass in Lake McConaughy, Nebraska, to characterize the hatchery fish natal elemental signatures. Age-0 white bass (n = 100) were then collected in Lake McConaughy in September 2015 from 2 sections of the reservoir (upper and main) to assess both natal origin (hatchery versus natural) and habitat use (upper versus main) using otolith concentrations of 5 chemical constituents at the otolith core and otolith edge, respectively. Otolith core signatures from the fall age-0 Lake McConaughy collected fish were different from the hatchery fish, indicating evidence for natural white bass recruitment. Otolith edge signatures were also distinct between fish collected from the upper and main sections of the reservoir. Otolith chemistry techniques can be useful for addressing challenges associated with managing erratic recruiting fish populations that are common to lake and reservoir systems.
Managing fish populations that exhibit highly variable recruitment is a common challenge. Many important sport fish populations undergo dramatic changes in population abundances that ultimately impact recreational fisheries (Willis et al. Citation2002, Kaemingk et al. Citation2014, Bogner et al. Citation2016). For example, white bass (Morone chrysops) recruitment is highly dynamic and often linked to abiotic conditions experienced during their early life history (Beck et al. Citation1997, Pope et al. Citation1997, Dicenzo and Duval Citation2002, Guy et al. Citation2002). During some years these populations may produce strong year classes, but most years there may be little or no recruitment into the population. Since angler satisfaction is often tied directly to catch rates, managing for boom and bust fisheries is not typically favored.
One strategy to overcome inconsistent or erratic recruitment is to augment fish populations through supplemental or maintenance stockings (Summerfelt Citation1999). Maintenance stockings afford the ability to increase the consistency of recruitment among years while preserving overall population size to meet angler demands. While maintenance stockings can be effective, they may not always be necessary. Natural recruitment may be sufficient within a given year, whereby maintenance stockings become ineffective and, in some cases, futile (Li et al. Citation1996, Hoxmeier and Wahl Citation2002). However, identifying annual contributions of natural and stocked fish within a population is difficult. Therefore, it is critical to develop tools and techniques that are able to distinguish the origin and movements of individual fish that are subject to maintenance stockings, such as those populations typified by erratic recruitment.
Numerous researchers have utilized batch chemical marking techniques to identify stock contribution (Dreves Citation2014, Lundgren et al. Citation2014, Perrion et al. Citation2016), but these approaches lack unique identifiers to track individual fish. For example, oxytetracycline (OTC) is often used to batch mark fish prior to stocking. These OTC marks are then used to assess the contribution of stocked fish at a later life stage (Lundgren et al. Citation2014, Perrion et al. Citation2016). Batch markings are useful for a coarse assessment of stock contribution, but they are unable to distinguish among recruits that derived from multiple stockings (e.g., through time) or multiple hatchery sources. Some batch marking techniques may also lead to low fingerling survival (as a result of chemical exposure) and the inability to subsequently read or distinguish these markings (i.e., high misclassification rates; Rutherford et al. Citation2002). Furthermore, batch markings are unable to track individual fish movements once they have been stocked (Dreves Citation2014). Employing a technique that has the ability to assess both natal source and habitat use of individual fish would improve understanding of fish performance.
The Nebraska Game and Parks Commission (NGPC) has designated white bass as a priority management species in Lake McConaughy, Nebraska—Nebraska’s largest reservoir that receives some of the highest fishing pressure in the state (Pope et al. Citation2017). Since the population of white bass in Lake McConaughy exhibits erratic recruitment (Eichner Citation2018), it is assumed that this sport fishery is almost entirely supported and maintained by annual stockings of hatchery-reared fish. It would therefore be desirable to assess natal origin (i.e., hatchery versus natural) and track habitat use (i.e., upper versus main reservoir sections) of age-0 white bass in this fishery. Otolith chemistry has the desired characteristics and ability to simultaneously assess natal source and habitat use among individual fish within a population (Sohn et al. Citation2005, Schaffler and Winkelman Citation2008, Pangle et al. Citation2010, Hogan et al. Citation2014, Carlson et al. Citation2016a). The objectives of our study were to assess the efficacy of otolith chemistry techniques to (1) determine whether there was evidence of natural recruitment in a white bass population that is putatively dependent on maintenance stockings and (2) examine the potential to track their movements within the reservoir after being stocked. This information could improve our ability to increase stocking efficiencies, develop habitat conservation plans, and further establish the efficacy of otolith chemistry as a stock contribution identifier for other important sport fish populations.
Study site
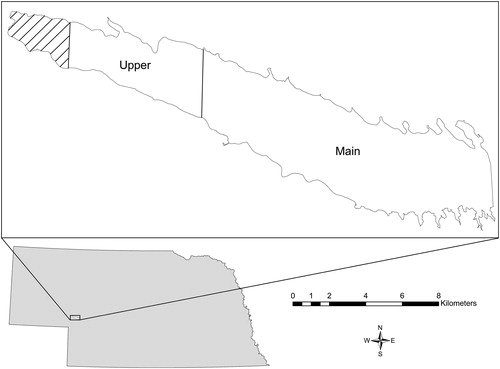
Lake McConaughy was created when the North Platte River was impounded by Kingsley Dam in 1941. The lake encompasses 121.4 km2 and stores more than 20.9 million m3 of water at full pool with a maximum depth of 43 m. Water levels in the reservoir fluctuate yearly because of irrigation drawdown and variable precipitation. A drought occurred in 2012 and reduced Lake McConaughy to a surface area less than 77 km2 (CNPPID Citation2016). During this study, elevation was 991.5 m above sea level and increased to 994.6 m in July 2015, which was 98% full pool capacity. Lake McConaughy is separated into 2 ) based on historic physicochemical differences such as phosphate and nitrate nitrogen (Taylor and Hams Citation1981). The upper section of the reservoir comprised the western third of the lake (101°57'5.57''W to 101°52'0.13''W), adjoining the North Platte River with the reservoir, and is characterized by riverine habitats. The main reservoir section comprised the remaining portion of the lake (101°52'0.13''W to 101°41'2.61''W) and is characterized by lacustrine habitats. Sampling was initially randomly conducted in shoreline sections that were divided into 0.5 km long sites within each of the upper (32 sampling sites) and main (64 sampling sites) sections of the reservoir, but subsequent sampling efforts were focused on successful collection sites.
Figure 1. Map of Lake McConaughy with designated upper and main sections of the reservoir based on physicochemical differences.
Materials and methods
Fish collection
A subsample of white bass fingerlings was collected in June 2015 from the North Platte Fish Hatchery and served as our hatchery sample; the remaining white bass fingerlings (n = 401,000) were stocked in Lake McConaughy in June 2015. Age-0 white bass were collected in September 2015 from Lake McConaughy using overnight experimental gillnets (1.8 × 45.7 m; 19.1, 25.4, 31.8, 38.1, 50.8, 76.2 mm bar mesh sizes) and electrofishing (5–8 A pulsed DC at 100–200 V). Sampling was initially randomly conducted in shoreline sections that were divided into 0.5 km long sites within each reservoir section (upper and main), but subsequent sampling focused on successful collection sites to reach a desirable sample size. We recorded total lengths for all fish sampled.
Otolith preparation
Otoliths were extracted via a cut in the top of the skull following the method of Bickford and Hannigan (Citation2005). White bass ages were verified (e.g., age-0) through otolith observation. Otoliths were stored in amber vials and allowed to dry. Once dry, the otoliths were embedded in thermoplastic cement with the sulcus side up and lightly sanded with a fine grit polishing pad on the sagittal plane to expose the core and edge growth increments (Bettoli and Maceina Citation1996). Immediately after sanding, the otoliths were washed with Milli-Q water multiple times to remove surface contamination. After drying, mounting techniques described by Donohoe and Zimmerman (Citation2010) were used to mount multiple otoliths on a single petrographic slide to reduce analysis time. All otoliths were transported to the University of Massachusetts–Boston Environmental Analytical Facility for chemistry analysis.
Otolith element analysis
Sectioned otoliths were analyzed with an inductively coupled plasma-mass spectrometer (ICP-MS) to quantify signatures. Otoliths were ablated utilizing spot analysis techniques. The CETAC-LSX-2/3 system was utilized to ablate spots on the otoliths with consistent operational parameters (20 Hz, 200 shots, 80% energy level) in conjunction with an ELAN DRC II ICP-MS for element quantification. Repeated 10 µm spots were used: 3 spots were ablated on the core (i.e., hatching signature) for both hatchery and Lake McConaughy collected fish and 3 on the edge (i.e., signature just prior to collection) of each otolith for the Lake McConaughy collected fish. Average elemental concentrations and ratios were calculated. For each ablation spot, a 10 s dwell time was followed by a 30 s washout time before the next spot was ablated on the otolith. Before each day’s analysis, argon nebulizer gas was adjusted to optimize 86Sr detectability and variability reduction (Coghlan et al. Citation2007). The ICP-MS was linked to DigiLaz software and microanalytical carbonate standard 3 (MACS-3) was ablated before and after each analyzed otolith to evaluate and collect instrument drift.
GeoPro software from CETAC technologies was used to merge the data for each otolith spot sample to estimate concentrations of 5 different analytes (138Ba, 24Mg, 55Mn, 86Sr, and 88Sr). All analytes are reported as element:43Ca ratios (mmol/mol). The elemental concentrations were normalized to 43Ca concentration because 43Ca is considered a pseudointernal standard (Campana and Neilson Citation1985, Campana Citation1999).
Natural recruitment
Statistical methods
To determine whether there was evidence of natural white bass recruitment in Lake McConaughy, we chose to perform an unsupervised cluster analysis using otolith core signatures from the fall age-0 Lake McConaughy collected fish. We used 5 chemical constituents (elements and isotopes; 138Ba, 24Mg, 55Mn, 86Sr, and 88Sr) to identify the number of clusters (hereafter referred to as McConaughy natal groups). This approach allowed for an independent assessment of the number of potential natal sources (i.e., natural and/or hatchery) that recruited to the age-0 white bass Lake McConaughy population. We wanted to account for the possibility of multiple natal sources that could occur among several tributaries and reservoir sections, in addition to the obvious hatchery contribution of fish. We used the R package “factoextra” to explore both partitional (K-means) and hierarchical (dendrogram) clustering methods for selecting the number of white bass natal groups (Hastie et al. Citation2009). Both approaches were congruent and revealed the same number of groups based on the Ward method, which minimizes the total within-group variance (Aukema et al. Citation2006).
We then compared the otolith core elemental signatures of our hatchery fish to each of the previously identified McConaughy natal groups (resulting from our cluster analysis). Hatchery collected white bass were hatched and reared in a separate water source from Lake McConaughy. Therefore, we surmised that fish collected from the hatchery would have distinct otolith core elemental signatures compared to fish that had naturally recruited in Lake McConaughy (i.e., since water sources were different). Therefore, if the McConaughy natal groups collected from the fall sample did not match the otolith elemental concentrations from our hatchery group we could conclude that there was strong evidence for natural recruitment (i.e., fish were naturally produced). Our data failed to meet parametric assumptions, so we conducted permutational multivariate analysis of variance (PERMANOVA) using the adonis function in the R package “vegan” to compare otolith elemental signatures among the McConaughy and hatchery natal groups (Reis-Santos et al. Citation2012). A PERMANOVA calculates p values under permutation and does not require multivariate normality or explicit distribution assumptions (Anderson Citation2017). Variables were transformed (ln[x + 1]) and dissimilarity matrices were based on Euclidean distances. A significant PERMANOVA difference was followed by a posteriori univariate comparisons for all 5 elements (Reis-Santos et al. Citation2012). Natal groupings were also visually assessed using nonmetric multidimensional scaling (NMDS) and an ordination plot was created from the otolith core elemental signatures for each natal group with Euclidian distance measure using the R package “vegan” (Oksanen et al. Citation2008). We fitted 95% confidence interval ellipses for each natal group and plotted the direction and strength of each element, using the envfit function, as a visual representation of the differences among natal groups.
Using the results from the PERMANOVA, we selected elements that significantly differed among the natal groups to assess our ability to correctly classify fish into their respective natal groupings. We used Random Forest, a machine learning technique, to discriminate fish among the McConaughy and hatchery natal groups using the R package “randomForest” (Breiman et al. Citation2018). Random Forest is based on classification trees that are built from a random bootstrap resampling (with replacement) of the data. This technique has many benefits (e.g., no a priori distributional assumptions) and thus is the preferred method for classifying fish based on otolith chemistry signatures (Mercier et al. Citation2011). We conducted a grid search to identify the most appropriate number of variables to randomly sample as candidates for each split using the R package “caret” (Kuhn Citation2008). The number of trees grown was set at 500 (i.e., default) to ensure that each data row was predicted multiple times. We randomly split our data into a training data set (75% of the fish) and a predictive data set (remaining 25% of the fish). The predictive data set allowed us to estimate the classification accuracy in terms of correct re-assignment by way of a cross-validation procedure. We also evaluated the contribution of each element to the global discrimination using the mean decrease in Gini coefficient (Archer and Kimes Citation2008).
Spatial distinction
Statistical methods
Our second objective was to assess the ability to define spatial residence of fish within the reservoir, using otolith chemistry signatures from the otolith edge. The otolith edge represents the signatures just prior to collection and therefore should represent localized habitat use for these age-0 white bass. We took a similar approach as the first objective, but instead of comparing otolith core signatures among fish we used otolith edge signatures. Thus, a PERMANOVA was computed to compare otolith edge signatures between fish collected from the upper and main sections of the reservoir. Univariate comparisons were made for each of the 5 elements following a significant PERMANOVA. We then selected the significant elements that differed between the 2 reservoir sections for classification purposes, using the Random Forest procedure and approach previously described.
Results
We collected 17 white bass fingerlings (mean length: 41.1 mm; range: 30–48 mm) in June 2015 from the North Platte Fish Hatchery. We then collected a total of 100 (mean length: 119.7; range: 69–193 mm) age-0 white bass in September 2015 that had recruited to the fall age-0 population. Of the 100 age-0 white bass collected from Lake McConaughy, in total 39 fish (mean length: 162.2 mm; range: 121–193 mm) were collected in the upper section and 61 (mean length: 92.5 mm; range: 69–149 mm) in the main section of the reservoir.
Natural recruitment
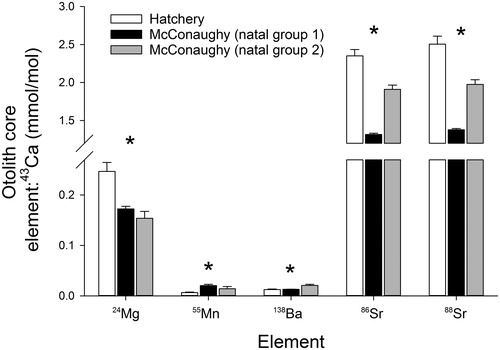
Our cluster analysis on the otolith core elemental signatures of the age-0 white bass collected from Lake McConaughy revealed 2 distinct McConaughy natal groups. Of the 100 age-0 white bass collected from Lake McConaughy, 74 fish were grouped into McConaughy natal group 1 and the remaining 26 fish were grouped into McConaughy natal group 2 (). Signatures of the 5 chemical constituents (elements and isotopes) taken from the otolith core were significantly different among the 2 McConaughy natal groups and the hatchery natal group of fish (Pseudo-F = 183.4, df = 2, Pperm < 0.001; ). Pairwise comparisons among all 3 natal groups revealed that all groups were different (P < 0.05). Post hoc univariate analyses confirmed that all 5 elements were significantly different among the 3 natal groups with variation in 138Ba:43Ca (Pseudo-F = 17.1, df = 2, Pperm < 0.001), 24Mg:43Ca (Pseudo-F = 16.0, df = 2, Pperm < 0.001), 55Mn:43Ca (Pseudo-F = 3.6, df = 2, Pperm = 0.03), 86Sr:43Ca (Pseudo-F = 196.3, df = 2, Pperm < 0.001), and 88Sr:43Ca (Pseudo-F = 165.2, df = 2, Pperm < 0.001; ).
Figure 2. Visualizing differences (NMDS plot) among natal groups using 138Ba:43Ca, 24Mg:43Ca, 55Mn:43Ca, 86Sr:43Ca, and 88Sr:43Ca with hatchery fish (n = 17) in red, upward-facing triangles, McConaughy natal group 1 (n = 74) in green boxes, and McConaughy natal group 2 (n = 26) in blue, downward-facing triangles (with 95% confidence interval [CI] ellipses). Arrows represent underlying element:43Ca ratio differences (strength and direction).
![Figure 2. Visualizing differences (NMDS plot) among natal groups using 138Ba:43Ca, 24Mg:43Ca, 55Mn:43Ca, 86Sr:43Ca, and 88Sr:43Ca with hatchery fish (n = 17) in red, upward-facing triangles, McConaughy natal group 1 (n = 74) in green boxes, and McConaughy natal group 2 (n = 26) in blue, downward-facing triangles (with 95% confidence interval [CI] ellipses). Arrows represent underlying element:43Ca ratio differences (strength and direction).](/cms/asset/fbb97470-73e6-4ea5-bec6-30c3144e970b/ulrm_a_1637977_f0002_c.jpg)
Figure 3. Differences in 24Mg:43Ca, 55Mn:43Ca, 138Ba:43Ca, 86Sr:43Ca, and 88Sr:43Ca (from the otolith core) among 2 Lake McConaughy white bass natal groups (derived from cluster analysis) and hatchery fish. Differences assessed using a PERMANOVA and asterisks denote significant differences among groups (hatchery versus McConaughy natal groups) for each element:43Ca ratio.
In general, classification accuracy of our Random Forest model was quite high for assigning fish into their respective natal groupings (). Classification accuracy was higher for fish in the 2 McConaughy natal groups (natal group 1 = 94%; natal group 2 = 83%) compared to the hatchery natal group (66%). Otolith core elements 138Ba, 86Sr, and 88Sr contributed most to their assignment accuracy, based on mean decrease in Gini coefficient.
Table 1. Predicted natal group assignment and accuracy (%) of white bass fingerlings collected from the North Platte Fish hatchery and age-0 white bass collected from Lake McConaughy (derived from cluster analysis) using otolith core ratios of 138Ba:43Ca, 24Mg:43Ca, 55Mn:43Ca, 86Sr:43Ca, and 88Sr:43Ca. We used 75% of the data to train the Random Forest model and used the remaining 25% of the data to measure the percent classification accuracy. Bold text indicates the number of fish and percentage (in parentheses) that were correctly assigned to their respective natal group.
Spatial distinction
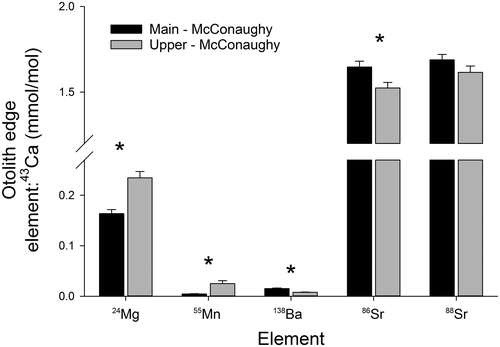
Otolith edge signatures of the 5 elements were significantly different between fish collected from the upper and main sections of the reservoir (Pseudo-F = 11.7, df = 1, Pperm < 0.001; ). Post hoc univariate analyses confirmed that 4 of the 5 elements were significantly different between the 2 reservoir sections. Fish collected from the upper section of the reservoir exhibited lower signatures of 138Ba:43Ca (Pseudo-F = 40.8, df = 1, Pperm < 0.001) and 86Sr:43Ca (Pseudo-F = 5.8, df = 1, Pperm = 0.02), but higher levels of 24Mg:43Ca (Pseudo-F = 26.4, df =1, Pperm < 0.001) and 55Mn:43Ca (Pseudo-F = 21.0, df = 1, Pperm = 0.03). However, there was no difference in 88Sr:43Ca between white bass collected from the 2 reservoir sections (Pseudo-F = 2.0, df = 1, Pperm = 0.15).
Figure 4. Differences in 24Mg:43Ca, 55Mn:43Ca, 138Ba:43Ca, 86Sr:43Ca, and 88Sr:43Ca (from the otolith edge) between juvenile white bass collected from 2 sections of Lake McConaughy, Nebraska. Differences assessed using a PERMANOVA and asterisks denote significant differences between groups (upper versus main reservoir) for each element:43Ca ratio.
Classification accuracy of our Random Forest model was higher for fish collected in the main section of the reservoir (100%) compared to fish collected from the upper section of the reservoir (75%; ). Otolith core elements 138Ba and 55Mn contributed most to their assignment accuracy, according to their mean decrease in Gini coefficient.
Table 2. Predicted lake section assignment and accuracy (%) of fish collected from the upper and main sections of Lake McConaughy using white bass otolith edge ratios of 24Mg:43Ca, 55Mn:43Ca, 138Ba:43Ca, and 86Sr:43Ca. We used 75% of the data to train the Random Forest model and used the remaining 25% of the data to measure the percent classification accuracy. Bold text indicates the number of fish and percentage (in parentheses) that were correctly assigned to their respective lake section.
Discussion
Otolith chemistry techniques were useful for estimating sources of recruitment and habitat use within an erratic recruiting white bass population that is annually stocked. We found evidence for natural recruitment in Lake McConaughy for white bass. Otolith core elemental signatures were different between age-0 fish collected from Lake McConaughy and fish collected from the hatchery, suggesting that most age-0 recruits were naturally produced. Furthermore, our ability to discriminate fish collected from the upper and main sections of the reservoir provides support for potentially tracking individual movements of fish within the reservoir, at least at a coarse spatial level. The outcome of this study provides insight for the utility of otolith chemistry techniques to address multiple management questions in a reservoir that is supplementally stocked because of highly variable recruitment.
A large proportion of the Lake McConaughy white bass year class appears to have derived from natural recruitment, with low representation of the 401,000 white bass fingerlings that were stocked in Lake McConaughy in 2015. White bass are known to have variable recruitment based on environmental conditions, and in 2015 NGPC observed a strong year class of white bass in Lake McConaughy that appeared to be naturally produced (Eichner Citation2018). However, we cannot dismiss the possibility of some contribution of hatchery fish to the population. One of our largest McConaughy natal groups (74% of the sample) was clearly different from the hatchery natal group and had 94% classification success (Carlson et al. Citation2016b). However, otolith core elemental signatures of the smaller McConaughy natal group (26% of the sample) were different, but some may have been misclassified as hatchery fish (17%). A few hatchery fish may have been collected and been subsequently classified as part of the smaller McConaughy natal group. While we did not set out to specifically identify the percent contribution of natural versus hatchery produced fish, we interpret our findings to suggest that there is evidence of natural recruitment and that these naturally produced fish could have formed the basis of the 2015 year class in Lake McConaughy. Future studies aiming to use otolith chemistry techniques, specifically validating natal origin of hatchery fish, could benefit from a secondary mark (i.e., genetic or microwire tag). Determining the distribution of hatchery fish post stocking would also provide valuable insight into early life-history characteristics and catchability assumptions that would impact study results. We should anticipate interannual variation in the contribution of naturally produced fish and stocking success; otolith chemistry techniques may provide the necessary tool to track and assess this variation through time and space.
High spring inflows were observed during this study, which may have aided natural recruitment of age-0 fish within this system. Increased spring flow rates were reported to promote recruitment of white bass (Dicenzo and Duval Citation2002, Guy et al. Citation2002). Other studies found high annual and spring inflows, increases in reservoir elevation and storage, high rates of spring water-level changes, and June daily air temperatures to all positively influence white bass recruitment (Beck et al. Citation1997, Pope et al. Citation1997, DeBoer and Pope Citation2015). During this study, high elevation and spring inflows both occurred, which likely contributed to the strong naturally produced year class of white bass in Lake McConaughy (Eichner Citation2018). It is also worthwhile to note that we identified 2 natal sources that were naturally produced within Lake McConaughy. These 2 natal sources could indicate 2 separate geographic locations (e.g., tributary and reservoir) or 2 temporal cohorts (e.g., early and late) that hatched in the same geographic location (or some combination of these possibilities). Understanding recruitment dynamics and the associated environmental conditions that shape survival could aid with determining which years require maintenance stockings to meet management objectives and identifying critical spawning habitats within the reservoir.
Determining spatial use of individual fish within a waterbody is particularly useful for understanding fish recruitment. We were able to discriminate age-0 fish that were collected from the upper and main sections of the reservoir. The physicochemical differences between these sections of the reservoir likely aided our ability to predict their spatial location based on otolith chemistry signatures. It is also plausible that these differences reflect other spatial locations (i.e., not upper and main sections) of the reservoir, since white bass are known for their schooling behavior. In either case, it appears that otolith chemistry techniques may have the ability to track movement patterns of individual fish within this reservoir and furthermore the potential to identify specific spawning locations and associated habitat characteristics (Bickford and Hannigan Citation2005, Gibson-Reinemer et al. Citation2009, Carlson et al. Citation2016a). Otolith chemistry techniques could also be used to assess relative survival of individual fish stocked at different locations (e.g., boat ramps versus offshore) and times (e.g., spring versus fall). This information could be used to stratify stocking locations and the timing of stocking to improve survivability of different cohorts, especially to avoid high predation rates (Buckmeier et al. Citation2005). The ability to trace individual fish back to their natal spawning habitat or stocking location within a waterbody would be of tremendous value for developing and guiding habitat conservation plans (Hayden et al. Citation2011).
Our study provided significant support for using otolith chemistry techniques to assist with decisions surrounding the management of sport fish that exhibit erratic recruitment, which is common among many fish species that inhabit lake and reservoir systems. Future otolith chemistry studies should consider the most appropriate statistical method and technique for their question, especially those related to classification (see Mercier et al. Citation2011). We chose to use a Random Forest model to evaluate recruitment and spatial assignment, given that it was more efficient, was easier to interpret, had fewer assumptions, and most importantly performed better than other available models such as linear discriminant analysis, quadratic discriminant analysis, and artificial neural networks (Mercier et al. Citation2011). Otolith chemistry techniques will likely aid in optimizing fishery resources, such as stocking efforts and habitat improvements that are necessary to efficiently manage sport fish populations for anglers. We anticipate that fish populations will likely undergo even greater variation in natural recruitment with changing climatic conditions or lower overall recruitment with the aging of many reservoirs (Kimmel and Groeger Citation1983, Joeckel and Diffendal Citation2004). These biotic and abiotic changes may require a modification of current stocking strategies and prioritization of certain habitats to promote natural recruitment and optimize stocking efforts. Modern tools and techniques, such as otolith chemistry, will be instrumental to better understand fish population dynamics and fishery management challenges.
Acknowledgments
We thank Dirk Higgins and Bryan Sweet for their assistance in collecting hatchery white bass and for valuable insight into hatchery procedures, water chemistries, and stocking timeline. Dr. Alan Christian and his lab at the University of Massachusetts–Boston deserve our gratitude for use of the ICP-MS. We also thank Benjamin Schall for his assistance in developing the scientific illustrations and the field collection of age-0 white bass within Lake McConaughy. Cale Hadan, Josh Kreitman, and a multitude of NGPC personnel were invaluable for their assistance with field collections. Andrew Carlson provided valuable insight into proper otolith chemistry techniques. We also thank the three anonymous reviewers who provided valuable insight with revisions for article improvements.
Additional information
Funding
References
- Anderson MJ. 2017. Permutational multivariate analysis of variance (PERMANOVA). In: Balakrishnan N, Colton T, Everitt B, Piegorsch W, Ruggeri F, Teugels JL, editors. Wiley StatsRef: Statistics reference online. doi:10.1002/9781118445112.stat07841.
- Archer KJ, Kimes RV. 2008. Empirical characterization of random forest variable importance measures. Comput Stat Data Anal. 52:2249e2260. doi:10.1016/j.csda.2007.08.015.
- Aukema BH, Carroll AL, Zhu J, Raffa KF, Sickley TA, Taylor SW. 2006. Landscape level analysis of mountain pine beetle in British Colombia, Canada: spatiotemporal development and spatial synchrony within the present outbreak. Ecograph. 29:427–441. doi:10.1111/j.2006.0906-7590.04445.x.
- Beck HD, Willis DW, Unkenholz DG, Stone CC. 1997. Relations between environmental variables and age-0 white bass abundance in four Missouri River reservoirs. J Freshw Ecol. 12:567–575. doi:10.1080/02705060.1997.9663571.
- Bettoli PW, Maceina MJ. 1996. Determination of age and growth. In: B.R. Murphy BR, Willis DW, editors. Fisheries techniques, 2nd edition. Bethesda (MD): American Fisheries Society. p. 483–512.
- Bickford N, Hannigan R. 2005. Stock identification of walleye via otolith chemistry in Eleven Point River, Arkansas. North Am J Fish Manage. 25:1542–1549. doi:10.1577/M04-189.1.
- Bogner DM., Kaemingk MA, Wuellner MR. 2016. Consequences of hatch phenology on stages of fish recruitment. PLoS One. 11:e0164980. doi:10.1371/journal.pone.0164980.
- Breiman L, Cutler A, Liaw A, Wiener M. 2018. Breiman and Cutler’s random forests for classification and regression. R Proj On. R package version 4.6–14.
- Buckmeier DL, Betsill RK, Schlechte JW. 2005. Initial predation of stocked fingerling largemouth bass in a Texas reservoir and implications for improving stocking efficiency. North Am J Fish Manage. 25:652–659. doi:10.1577/M04-077.1.
- Campana SE. 1999. Chemistry and composition of fish otoliths: pathways, mechanisms, and applications. Mar Ecol Prog Ser. 188:263–297. doi:10.3354/meps188263.
- Campana SE, Neilson JD. 1985. Microstructure of fish otoliths. Can J Fish Aquat Sci. 42:1014–1032. doi:10.1139/f85-127.
- Carlson AK, Fincel MJ, Graeb BDS. 2016a. Otolith microchemistry reveals natal origins of walleyes in Missouri River reservoirs. North Am J Fish Manage. 36:341–350. doi:10.1080/02755947.2015.1135214.
- Carlson AK, Phelps QE, Graeb BDS. 2016b. Chemistry to conservation: using otoliths to advance recreational and commercial fisheries management. J Fish Biol. 90:505–527. doi:10.1111/jfb.13155.
- CNPPID. 2016. Central Nebraska Public Power District: recreational resources within the central Nebraska public power and irrigation district [accessed 2016 May 19]. www.cnppid.com/recreation/recreational-resources.
- Coghlan Jr. SM, Lyerly MS, Bly TR, Williams JS, Bowman D, Hannigan R. 2007. Otolith chemistry discriminates among hatchery-reared and tributary-spawned salmonines in a tailwater system. North Am J Fish Manage. 27:531–541. doi:10.1577/M06-118.1.
- Deboer, JA, Pope KL. 2015. Factors influencing recruitment of walleye and white bass to three distinct early ontogenetic stages. Ecol Freshw Fish. May:1–14. doi:10.1111/eff.12229.
- DiCenzo, VJ, Duval MC. 2002. Importance of reservoir inflow in determining white bass year-class strength in three Virginia reservoirs. North Am J Fish Manage. 22:620–626. doi:10.1577/1548-8675(2002)022<0620:IORIID>2.0.CO;2.
- Donohoe CJ, Zimmerman CE. 2010. A method of mounting multiple otoliths for beam-based microchemical analyses. Environ Biol Fish. 89:473–477. doi:10.1007/s10641-010-9680-3.
- Dreves DP. 2014. Evaluation of white bass stocking to enhance existing reservoir populations. Kentucky Department of Fish and Wildlife Resources Fisheries Bulletin 113.
- Eichner D. 2018. Lake McConaughy 2017 fall survey summary. Neb Gam and Par Comm [accessed 2019 May 31]. http://outdoornebraska.gov/wp-content/uploads/formidable/5/McConaughy-2018-survey-summary-handout.pdf.
- Gibson-Reinemer DK, Johnson BM, Martinez PJ, Winkelman DL, Koenig AE, Woodhead JD. 2009. Elemental signatures in otoliths of hatchery rainbow trout (Oncohynchus mykiss): distinctiveness and utility for detecting origins and movement. Can J Fish Aquat Sci. 66:513–524. doi:10.1139/F09-015.
- Guy CS, Schultz RD, Colvin MA. 2002. Ecology and management of white bass. North Am J Fish Manage. 22:606–608. doi:10.1577/1548-8675(2002)022<0606:EAMOWB>2.0.CO;2.
- Hastie T, Tibshirani R, Friedman J. 2009. Unsupervised learning. In: Hastie T, Tibshirani R, Friedman J, editors. The elements of statistical learning: data mining, inference, and predictionNew York (NY): Springer. p. 485–585. https://doi.org/10.1007/978-0-387-84858-7.
- Hayden TA, Miner JG, Farver JR, Fryer BJ. 2011. Philopatry and vagrancy of white bass (Morone chrysops) spawning in the Sandusky River: evidence of metapopulation structure in western Lake Erie using otolith chemistry. J Great Lake Res. 4:691–697. doi:10.1016/j.jglr.2011.08.012.
- Hogan JD, Blum MJ, Gilliam JF, Bickford NA, McIntyre PB. 2014. Consequences of alternative dispersal strategies in a putatively amphidromous fish. Ecology. 95:2397–2408. doi:10.1890/13-0576.1.
- Hoxmeier RJH, Wahl DH. 2002. Evaluation of supplemental stocking of largemouth bass across reservoirs: effects of predation, prey availability, and natural recruitment. In Philipp DP, Ridgway MS. Black bass: ecology, conservation, and management. Am Fish Soc Symp 31. Bethesda (MD). p. 639–648.
- Joeckel RM, Diffendal Jr. RF. 2004. Geomorphic and environmental changes around a large, aging reservoir: Lake CW McConaughy, western NE, USA. Environ Engin Geosci. 10:69–90. doi:10.2113/10.1.69.
- Kaemingk MA, Graeb BD, Willis DW. 2014. Temperature, hatch date, and prey availability influence age‐0 yellow perch growth and survival. Trans Am Fish Soc. 143:845–855. doi:10.1080/00028487.2014.886622.
- Kimmel BL, Groeger AW. 1983. Limnological and ecological changes associated with reservoir aging. Oak Ridge (TN): Oak Ridge National Lab.
- Kuhn, M. 2008. Building predictive models in R using the caret package. J Stat Software. 28(5):1–26.
- Li J, Cohen Y, Schupp DH, Adelman IR. 1996. Effects of walleye stocking on population abundance and fish size. North Am J Fish Manage. 16:830–839. doi:10.1577/1548-8675(1996)016<0830:EOWSOP>2.3.CO;2.
- Lundgren SA, Schoenebeck CW, Koupal KD, Lorenson JA, Huber CG. 2014. Quantification and evaluation of factors influencing largemouth bass predation of stocked advanced fingerling yellow perch. North Am J Fish Manage. 34:595–601. doi:10.1080/02755947.2014.901260.
- Mercier L, Darnaude AM, Bruguier O, Vasconcelos RP, Cabral HN, Costa MJ, Lara M, Jones DL, Mouillot D. 2011. Selecting statistical models and variable combinations for optimal classification using otolith microchemistry. Ecol Appl. 21:1352–1364.
- Oksanan J, Kindt R, Legendre P, O’Hara B, Simpson GL, Solymos P, Stevens MHH, Wagner H. 2008. The vegan package. R Proj On. Community Ecology Pack Version 1.15-1.
- Pangle KL, Ludsin SA, Fryer BJ. 2010. Otolith microchemistry as a stock identification tool for freshwater fishes: testing its limits in Lake Erie. Can J Fish Aq Sci. 67:1475–1489.
- Perrion MA, Schall BJ, Schoenebeck CW, Koupal KD, Sweet BD. 2016. Feasibility of oxytetracycline marking fingerling white bass. North Am J Aquacult. 78:362–365. doi:10.1080/15222055.2016.1201554.
- Pope KL, Powell LA, Harmom BS, Pegg MA, Chizinski CJ. 2017. Estimating the number of recreational anglers for a given waterbody. Fish Res. 191:69–75. doi:10.1016/j.fishres.2017.03.004.
- Pope KL, Willis DW, Lucchesi DO. 1997. Influence of temperature and precipitation on age-0 white bass abundance in two South Dakota natural lakes. J Freshwat Ecol. 12:599–605. doi:10.1080/02705060.1997.9663574.
- Reis-Santos P, Gillanders BM, Tanner SE, Vasconcelos RP, Elsdon TS, Cabral HN. 2012. Temporal variability in estuarine fish otolith elemental fingerprints: implications for connectivity assessments. Esturaine Coastal Shelf Sci. 112:216–224. doi:10.1016/j.ecss.2012.07.027.
- Rutherford ES, Iacono JD, Callahan G. 2002. Evaluation of Marking Procedures to Estimate Natural Reproduction of Chinook Salmon in Lake Michigan. Great Lakes Fishery Commission (Ann Arbor) 1001:48109–1084.
- Schaffler JJ, Winkelman, DL. 2008. Temporal and spatial variability in otolith trace-element signatures of juvenile striped bass from spawning locations in Lake Texoma, Oklahoma–Texas. Trans Am Fish Soc. 137:818–829. doi:10.1577/T06-023.1.
- Sohn D, Kang S, Kim S. 2005. Stock identification of chum salmon (Oncorhynchus keta) using trace elements in otoliths. J Oceanogr. 61:305–312. doi:10.1007/s10872-005-0041-3.
- Summerfelt, RC. 1999. Lake and reservoir habitat management. In: Kohler CC, Hubert WA, editors. Inland fisheries management in North America, 2nd edition. Bethesda (MD): American Fisheries Society. p. 285–320.
- Taylor MW, Hams KM. 1981. The physical and chemical limnology of Lake McConaughy with reference to fish management. NE Tech Ser No 9. Lincoln (NE).
- Willis DW, Paukert CP, Blackwell BG. 2002. Biology of white bass in eastern South Dakota glacial lakes. North Am J Fish Manage. 22:627–636. doi:10.1577/1548-8675(2002)022<0627:BOWBIE>2.0.CO;2.