
 ?Mathematical formulae have been encoded as MathML and are displayed in this HTML version using MathJax in order to improve their display. Uncheck the box to turn MathJax off. This feature requires Javascript. Click on a formula to zoom.
Abstract
Adongo TA, Kyei-Baffour N, Abagale FK, Agyare WA. 2019. Assessment of reservoir sedimentation of irrigation dams in northern Ghana. Lake Reserv Manage. 36:87–105.
Sedimentation in reservoirs of irrigation dams is a serious issue that threatens their functionalities. Since information on this phenomenon in irrigation dams in northern Ghana is almost nonexistent, a study was necessary. The study used bathymetric survey integrated with geographic information systems (GIS) tools to assess reservoir sedimentation of 9 irrigation dams in 3 northern regions of Ghana. The bathymetric survey was conducted during August–October 2017 using a hand-held Hondex digital depth meter. Reservoir depths at full supply level were found to range from 0.10 to 14.70 m. The volumetric storage capacity loss in the reservoirs ranged from 0.1 to 7.94 Mm3, while the percentage storage capacity loss ranged from 8.54 to 34.12%. The reservoirs were found to be losing volume by 0.26–0.91%/yr. The water surface area of the reservoirs lost due to sedimentation ranged from 5.53 to 24.10%. Estimated mean annual sediment load and sediment inflows into the reservoirs ranged from 3159 to 12,850 mg/L and from 1594 to 355,017 m3/yr, respectively. Estimated useful life of the reservoirs ranged from 22 to 160 yr. All the reservoirs except Bontanga and Tono had a well-formed delta and slightly formed tapering deposits. Major causes of the sedimentation were observed to be mainly human activities within the reservoir catchments. Enactment and enforcement of bylaws to restrict farming, burning, and sand/gravel mining activities in the buffer zones of the reservoirs are necessary to reduce the rate of sedimentation. Improved catchment management practices, construction of check dams, installation of hydrosuction sediment-removal systems, and periodic desilting are also recommended.
Water is one of the most important natural resources to all living things (Young Citation2006). Due to the seasonality of rainfall in many parts of the world, water resources development and management have become very important and a necessity to conserve water and make it available for human and animals use in their immediate environment. This has led to the construction of dams (Yusuf and Yusuf Citation2012). Indeed, these dams are important infrastructure and play important role in the world’s economy by providing water for irrigation, domestic/industrial water supply, and electric-power generation by means of hydropower installation (Basson Citation2010, Issa et al. Citation2013). As of 2011, there were about 850 small- to large-scale dams in Ghana, of which northern Ghana has about 370 (Namara et al. Citation2011).
Globally, irrigation has been noted to be the most important user of water from reservoirs, and irrigated area has also been reported to be expanding at a rate of about 30% per decade (Qamar and Gopal Citation2017). However, sedimentation is a major unavoidable phenomenon in all reservoirs, and uncontrolled sediment deposition makes storage reservoirs the key nonsustainable component of modern water supply systems. Accumulation of sediment in a reservoir reduces its depth, storage capacity, and useful life and interferes with its functions (White Citation2001, Wang et al. Citation2018). With many reservoirs rapidly losing their depths to sedimentation and reaching the end of their original design useful life, sedimentation assessment is becoming an increasingly important issue in reservoir operation and management (Doyle et al. Citation2003, USACE Citation2017). The global rate of reservoir sedimentation is estimated to be 0.5 to 2% loss of storage capacity annually (Issa et al. Citation2015). Adwubi et al. (Citation2009) found 4 small reservoirs in Ghana filling up rapidly with sediments at a rate of 1.75%/yr.
Facilities for flushing out sediment from reservoirs of dams in Ghana are absent (Namara et al. Citation2011). Large amounts of catchment sediment due mainly to poor land use practices are easily transported and deposited into the reservoirs (Adwubi et al. Citation2009). Furthermore, routine desilting or dredging in reservoirs for capacity restoration is absent in Ghana amid high sediment inflows into the reservoirs. The several patches of islands and weeds that can be seen in some reservoirs are indications of the occurrence of sedimentation. However, there is lack of information regarding their depths, storage capacities, water surface areas, sedimentation rates, and actual useful life span after many years of operation. This study was therefore carried out to assess reservoir sedimentation and its effects on selected irrigation dams in northern Ghana.
Materials and methods
Study area
The study was conducted on 9 reservoirs: Bontanga, Golinga, and Libga reservoirs in the Northern Region; Gambibgo, Tono, and Vea reservoirs in the Upper East Region; and Daffiama, Karni, and Sankana reservoirs in the Upper West Region (). Principal characteristics of the reservoirs and their associated dams are presented in . The study reservoirs represent 3% of the number of reservoirs in northern Ghana, with all the 3 large reservoirs covered and 6 of the small and medium-size reservoirs. The study reservoirs were purposively selected based on 4 criteria:
Figure 1. Map of northern Ghana showing the location of the study reservoirs (red color).
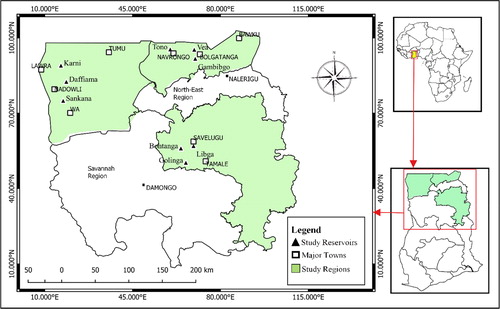
Table 1. Location and characteristics of study reservoirs.
Reservoirs constructed between 1960 and 1990, classified as old reservoirs.
Reservoirs with design maps and engineering characteristics.
Reservoirs that have not been desilted since construction.
Sizes of reservoirs to include small, medium-size, and large reservoirs. Small, medium-size, and large reservoirs are reservoirs with maximum storage capacities of <1 Mm3, 1 to 3 Mm3, and >3 Mm3, respectively (Basson Citation2007, Kolala et al. Citation2015).
Methodology
The objectives of the study were achieved using grab sampling and bathymetric surveys integrated with remote sensing and ArcGIS 10.4 software. Observations were also made of the activities surrounding the reservoirs and recorded to inform the outcomes of the surveys.
Bathymetric surveys
The bathymetric surveys were conducted in the reservoirs during August–October 2017 using a hand-held Hondex digital depth meter, a hand-held global positioning system (GPS), canoe, ArcGIS 10.4 software, and appropriate protective equipment. Depth measurements were collected using established navigation lines that served as reference paths, beginning from the dam wall and continuing upstream along the longitudinal extent of the reservoir. The number of range lines required for the survey in each reservoir was determined using Equationequation 1(10)
(10) (Zarris and Lykoudi Citation2003):
(1)
(1)
where N is the required number of range lines and A is the reservoir surface area (km2).
Based on Equationequation 1(10)
(10) , the survey navigation lines were established at 30-m intervals for the large reservoirs, that is, Bontanga, Tono, and Vea, and at 15-m intervals for the small and medium-size reservoirs, Daffiama, Gambibgo, Golinga, Karni, Libga, and Sankana. Based on the recommendation of Gómez-Fragoso (Citation2016), depth point measurements were done at an interval of 10 m for the large reservoirs and at 5-m intervals for the small and medium-size reservoirs.
The reservoir water levels were monitored thrice daily, at 08:00 a.m., 12:00 p.m., and 04:00 p.m., and resulted in computation of the adjusted maximum pool elevation level. The means of transport on the water was a canoe. The water depths were measured with an accuracy of ±0.01% of the measured depths and the geographic position data were taken with an accuracy of ±3 m. The necessary number of survey points taken ranged from 745 to 3885 depending on reservoir surface area ().
Maximum pool elevation-level adjustments and development of bathymetric maps
The bathymetric data were adjusted to the maximum pool (spillway) elevation, which is the maximum allowable water surface elevation. The maximum pool level adjustment was necessary because some of the reservoirs were not at full supply level at the time depth measurements were taken. The adjusted bathymetric data were used to develop bathymetric survey maps () for each reservoir using ArcGIS software version 10.4.
Figure 2. Bathymetric survey points in study reservoirs.
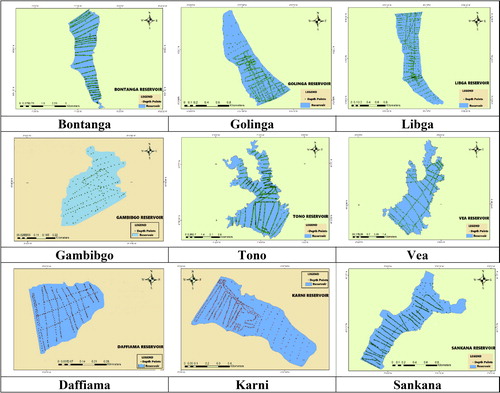
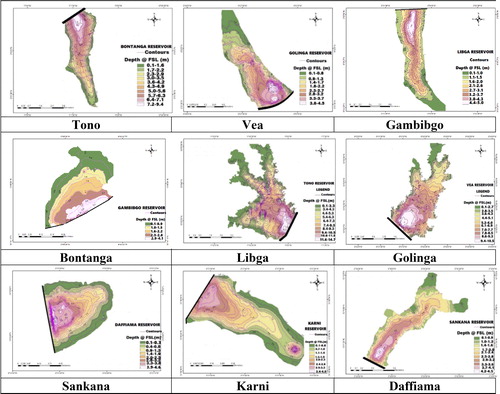
For each reservoir, the depth points and their respective GPS coordinates were processed in Microsoft Excel and integrated into a geographic information system (GIS). The data (X, Y, Z) were imported into ArcGIS 10.4 software. Using the ordinary kriging method, the depth points were interpolated. The depth points were then color coded according to their specific depths and converted into an elevation (raster) map, and contour lines were created by connecting the same color points throughout the longitudinal extent of the reservoir using the contour spatial analyst tool. The output was a bathymetric contour map at 0.5-m intervals indicating the spatial distribution of depth of reservoirs at full supply level ().
Figure 3. Spatial distribution of depth of reservoirs at full supply level.
Generation of bathymetric triangulated irregular network (TIN) maps and computation of storage capacity and water surface area of the reservoirs
For each reservoir, the processed bathymetric survey vectorial data (X, Y, Z) were exported to ArcGIS 10.4 software in ESRI shape format. Using customizing tools in the GIS program and a kridging method, the depth points were interpolated and converted into raster maps. A triangulated irregular network model (TIN) was generated from the data stored in the GIS database using the 3D Analyst module. TIN is a collection of triangles generated using the data points as the corners. The triangles were created using the Delaunay triangulation method, so that all points are connected using their two nearest neighbors to form triangles (Wilson and Richards Citation2006). Consequently, a bathymetric TIN map was produced for each reservoir. The current storage capacity and water surface area of each reservoir at full supply level were then computed using the TIN model tool in ArcGIS. The current storage capacity and the water surface area of the reservoirs as obtained from the bathymetry and the initial storage capacity and water surface area of the reservoirs were used to compute the loss in storage capacity and water surface area of the reservoirs (Equationequations 2(2)
(2) and Equation6
(6)
(6) ). The storage capacity lost in a reservoir represents the volume of sediment accumulated in it.
After the bathymetry, the following series of computations and analysis were made for each reservoir using Equationequations 2–7:
(2)
(2)
where SCL is the reservoir storage capacity loss due to sedimentation (m3), ISCR is the initial (original) storage capacity of the reservoir (m3), and CSCR ia the current storage capacity of the reservoir (m3) (Ferrari and Collins Citation2006);
(3)
(3)
where MASR is the mean annual rate of sedimentation (m3/yr), SCL is the reservoir storage capacity loss (m3), and AgR is the age of the reservoir (yr) (Aynekulu et al. Citation2006);
(4)
(4)
where %MASR is the mean annual sedimentation rate (%/yr), SCL is the reservoir storage capacity loss (m3), and AgR is the age of the reservoir (yr) (Basson Citation2010):
(5)
(5)
where UL is the useful life of the reservoir in years when the initial storage capacity will reduce to 50%, ISCR is the initial (original) storage capacity of the reservoir (m3), SCL is the storage capacity loss (m3), and MASR is the mean annual rate of sedimentation (m3/yr) (Gill Citation1979);
(6)
(6)
where WSAL is the water surface area loss due to sedimentation (ha), IWSA is the initial water surface area at full supply level (ha), and CWSAL is the current water surface area at full supply level (ha) (Ferrari and Collins Citation2006); and
(7)
(7)
where PRWSA is the percentage reduction in water surface area (%), WSAL is the water surface area loss due to sedimentation (ha), and IWSA is the initial water surface area at full supply level (ha) (Issa et al. Citation2013).
All the historical data such as initial (original) storage capacities and water surface areas of the reservoirs were obtained from the database of the GIDA and ICOUR and used in the equations presented.
Estimation of sediment loads and sediment inflows into the study reservoirs
All the rivers and streams that feed the reservoirs under study are not gauged at their inlet points to monitor sediment loads and sediment inflows into the reservoirs. Therefore, a grab sampling method was used to measure sediment loads and sediment inflows into the reservoirs via runoff. Runoff samples from selected rivers and streams that feed a particular reservoir were collected using a 3-L suspended sediment sampler. Samples were taken about 25–40 m away from the reservoirs and were collected for a period of 3 years (Jun–Sep 2016, 2017, and 2018). Sampling was done thrice daily at 8:00 a.m., 12:00 p.m., and 4:00 p.m.. Depending upon the depth of the runoff, the sampler was dipped to a depth of 30–50 cm below the water level so as to have a more representative sample at a point. Five grams of aluminum sulfate (alum) was added to each sample collected to aid quick settlement of sediments. The settled sediments were then filtered and transferred into a 1-L sampling bottle and labeled. The sediment samples were then transferred into drying metallic plates in the laboratory for oven drying at 60 C for 12 h. The oven-dried samples were weighed to determine the sediment concentrations. Mean annual suspended sediment concentrations were computed from the samples collected. Total sediment load for each reservoir was estimated from the suspended sediment load using the Strand and Pemberton (Citation1982) bedload correction method, while the total sediment inflow into a reservoir was computed taking account the annual water inflow into the reservoir.
Acquisition and analysis of land-use/land-cover data
Multitemporal and multisensor satellite imageries of the reservoir catchments were acquired for the purpose of determining the land-use/land-cover (LULC) classes. Landsat 8 OLI images of scene 195/52 of the year 2016 were used for the study. Two software packages, ERDAS Imagine version 10.4 and ArcGIS version 10.4, were used to process the satellite images for layer stacking, mosaicking, georeferencing, subsetting, and training of the images according the area of interest (AOI). Using ERDAS, the raw satellite images were converted from tag image file format (tiff) to IMG format in order to be compatible with other ERDAS Imagine files. The UTM Zone 30 N Coordinate on the WGS84 was used to geocode the imported images. The Landsat 8 OLI images were georeferenced using ground control points collected from a shapefile created from samples recorded from the field with root mean square error (RMSE) of 0.015. The georeferenced images of the reservoir catchments were used for an image-to-image registration of the other images using the same AOI. The area of each catchment was used in the clipping and subsetting of the images to ensure faster processing.
A combination of both unsupervised and supervised classification was used for classifying the two images for each catchment. A false color composite of bands 4-3-2 of the Landsat 8 OLI images and bands 1-2-3 in the visible–near-infrared (VNIR) of the ASTER images were evaluated for the ability to distinguish LULC types. These color composites provided the most optimal visualization of the 5 LULC classes and was consequently loaded into the color board RGB (red, green, and blue) of ERDAS Imagine version 10.4 software. An unsupervised classification was first done using the classification algorithm iterative self-organizing data-analysis technique (ISODATA) with a maximum iteration of 6. This was used as guidance for the collection of training sample points on the field. The points were then overlaid on the images and used as guidance to define polygons to extract the signatures for the various LULC types. Maximum likelihood classification (MLC) was used for the supervised classification. Accuracy assessment of the classification of the satellite images was performed to assess the quality of information derived from the data.
Determination of reservoir sediment grain (particle) size distribution
The hydrometer method as described by Bouyoucos (Citation1963) was used for the determination of the particle size distribution of the sediment deposited in the reservoirs. This method relies on the differential settling velocities of different particle sizes within a water column. The settling velocity is also a function of liquid temperature, viscosity, and specific gravity of the falling particle (Okalebo et al. Citation1993).
Procedure
A 50-g sediment sample was weighed into a “milkshake” mixer cup, and 50.0 ml of 10% sodium hexametaphosphate and 100 ml distilled water were added.
The mixture was shaken for 15 min, after which the suspension was transferred from the cup into a 1000-ml measuring cylinder and distilled water was added to reach the 1000-ml mark.
The mixture was inverted several times until all sediment particles were in suspension. The cylinder was placed on a flat surface and the time was noted.
The first hydrometer and temperature readings were taken at 40 s. After the first readings the suspension was allowed to stand for 3 h and the second hydrometer and temperature readings were taken.
The first reading indicated the percentage of sand and the second reading the percentage of clay. The percentage of silt was determined by the difference. Computations were done as follows:
(8)
where H1 is the hydrometer reading at 40 s; T1 is the temperature reading at 40 s; H2 is the hydrometer reading at 3 h; and T2 is the temperature reading at 3 h.
Results and discussion
Land-use/land-cover classes in the reservoir catchments
Using multitemporal and multisensor satellite imageries and unsupervised/supervised classification, 4 major land-use/land-cover (LULC) classes, namely, cropland, water body, built-up land, and open savannah woodland, were delineated in the catchments of the study reservoirs except for Tono, where closed savannah woodland was identified as the fifth major LULC class ( and ). Across all the catchments, cropland constituted the largest area (over 40%), followed by open savannah woodland, except in Gambibgo catchment, where built-up land occupied the second largest area.
Figure 4. Land-use/land-cover classes in the reservoir catchments for year 2016.
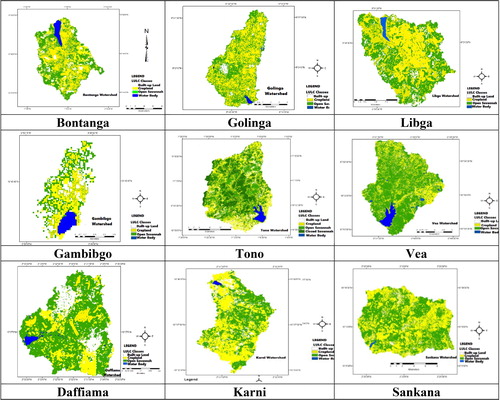
Table 2. Land-use/land-cover classes in the reservoir catchments and their areal coverage and C-factor.
The land-cover management (C) factors of the LULC classes ranged from 0.0 to 0.27, and according to Renard et al. (Citation1997), LULC classes with C-factor values above 0.20 significantly contribute to high soil erosion and sediment yield if conservation measures are not installed. The C-factor value for the predominant land-use class (cropland) in the catchments is 0.27. This suggests that it is a potential source of sediment load to the various reservoirs. Improper tilling of land and indiscriminate conversion of critical areas of the catchments and buffer zones of the reservoirs for crop production were observed to be rampant. These practices enhance accelerated soil erosion and high sediment yield, leading to sedimentation in the reservoirs. The open and closed savannah woodlands, which have high potentials of controlling high soil erosion and sediment yield, were also observed to be rapidly depleting annually. Molla and Sisheber (Citation2017) noted high soil erosion and sediment yield in cultivated lands, followed by built-up/bare lands and grasslands that are heavily grazed.
Sediment loads and sediment inflows into the study reservoirs
The mean annual sediment load into the reservoirs was found to range from 3159 to 12,850 mg/L, with the least and highest recorded at Tono and Karni reservoirs, respectively (). According to Kamtukule (Citation2008), mean annual sediment load <1000.0 mg/L indicates low sediment yield from the catchment, 1000–2999.9 mg/L indicates moderate sediment yield from the catchment, 3000–10,000.0 mg/L indicate high sediment yield, and >10,000.0 mg/L indicates very high sediment yield. Based on this classification, the Tono, Gambibgo, Vea, Bontanga, Libga, Golinga, and Daffiama reservoirs annually received high loads of sediment, as their mean annual sediment load ranges from 3000 to 10,000 mg/L (). This means that their corresponding catchments were not well conserved due to factors such as improper farming practices, burning, and deforestation rendering them susceptible to erosion and high sediment yield, which may be transported into the reservoirs. The sediment loads entering the Sankana and Karni reservoirs were considered very high as they recorded a mean sediment load above 10,000 mg/L. This indicated that their corresponding catchments were highly susceptible to soil erosion, causing very high sediment yield. The mean annual sediment loads obtained in this study are within the range of annual sediment loads estimated in similar studies in other parts of the world. For example, Chitata et al. (Citation2014) estimated mean annual sediment load ranging from 3590 to 5880 mg/L at the Mutangi reservoir located in semiarid southern Zimbabwe. Mavima et al. (Citation2011) recorded a mean annual sediment load of 5660 mg/L at the Chesa Causeway reservoir located in the Upper Ruya subcatchment of Zimbabwe.
Table 3. Mean annual sediment loads and inflows into the study reservoirs.
The mean annual sediment inflow into the reservoirs was estimated to range from 1594 to 355,017 m3/yr, with the least and highest estimated in the Gambibgo and Tono reservoirs, respectively (). It was noted that the reservoirs received very high sediment inflows annually, as they recorded mean annual sediment inflows above 1000 m3/yr.
Sediment grain size distribution and depositional patterns in the study reservoirs
According to Morris and Fan (Citation1997), the depositional pattern of sediment in a reservoir is driven by sediment grain size and texture. The ranges of average grain size distribution of the sediment deposits in the study reservoirs were 10.3–24.8% sand, 43.7–53.1% silt, and 30.6–37.8% clay (). The texture of the sediment deposits in the reservoirs included clay, loam, clay loam, silty loam, and silty clay loam. Across all the reservoirs, the results indicated that the deposited sediment are richer in fine particles such as fine sand, silt, and clay particles. The coarse sand particles were found along the peripheries of the reservoirs and the inlets of the reservoir tributaries. Field observations and the illustrations in indicated that the Golinga, Libga, Gambibgo, Vea, Daffiama, Karni, and Sankana reservoirs had a well-formed delta and slightly-formed tapering deposits, while Bontanga and Tono reservoirs had a slightly formed delta and tapering deposits. The formation of the delta and tapering depositional patterns in the reservoirs could be attributed to the large amount of silt particles in the sediment inflows to the reservoirs. Morris and Fan (Citation1997) noted that sediment depositional patterns in a reservoir affect the extent to which the maximum depth and storage capacity are lost and added that delta depositional pattern are formed if the sediment inflows to the reservoir consist mainly of coarse sediment or contain a large fraction of finer sediment such as silt, while tapering deposits are formed when deposits develop progressively from fines from the water moving toward the dam wall.
Table 4. Sediment grain size distribution, texture and the depositional patterns in the study reservoirs.
Spatial distribution and analysis of reservoir depth loss to sedimentation
As presented in , the historical maximum depths of the reservoirs at original design full supply level ranged from 5.0 to 15.6 m. The 2017 bathymetric survey found the current maximum depths of the reservoirs at full supply level to be ranging from 4.0 to 14.7 m, with the lowest and highest depth recorded in the Karni and Tono reservoirs, respectively. Across all the reservoirs, the deepest sections with maximum depths were close to the dam wall, whereas the shallowest sections with minimum depths were found at the throwback and peripheries, especially at the entry points of the tributaries that feed the reservoirs (). The areas of shallow depth were overgrown with weeds and some were converted into farmlands.
Table 5. Reservoir depth loss to sediment.
The study found the maximum depth lost to sediment to be in the range of 0.9–2.2 m with a mean of 1.37 m (). The Daffiama and Tono reservoirs, which had been in operation for 29 and 33 years, respectively, had the least depth loss, while the Sankana reservoir ,which had been in operation for 48 years, had the highest sediment deposition. Assuming the sediment deposition is uniform over the bed of the reservoirs, the reservoirs lose their depths at rates ranging from 2.36 to 5.01 cm/yr, with the least in the Gambibgo reservoir and the highest loss rate occurring in the Karni reservoir. The magnitude of depth loss in the small and medium-size reservoirs is high and thus substantially reduces their reservoir storage capacities. The reservoir depth loss obtained in this study is similar to that reported by Chanson and James (Citation2005), such that small and medium-size storage capacity reservoirs lose their depths to sediment deposits at faster rates than large storage capacity reservoirs. The range of depth loss obtained in this study is quite a bit lower than the 5.3-m (25.25-cm/yr) depth loss recorded in the Akdarya reservoir in Uzbekistan within 21 yr of its operation (Rakhmatullaev et al. Citation2011) and also far lower than the 7.57 m (37.85 cm/yr) depth loss of the Jibia reservoir in Nigeria within 20 yr of operation (Yusuf and Yusuf Citation2012).
Effect of age, water inflow, sediment inflow, trap efficiency, reservoir surface area, and storage capacity on reservoir depth loss
For future reservoir depth analysis, the study proposed Equationequation 11(11)
(11) , which sought to establish the causal effect of age, water inflow, sediment inflow, trap efficiency, surface area, and storage capacity on reservoir depth loss to sediments:
(11)
(11)
where RDL is the reservoir depth loss to sediment (m), AgR is the age of the reservoir (yr), AWI is the annual water inflow (m3), ASI is the annual sediment inflow (m3), ATE is the annual trap efficiency (%), RSA is the reservoir surface area (ha), and RSC is the reservoir storage capacity (m3).
The multivariate linear regression analysis recorded an R2 of 0.917, and this suggests that age, water inflow, sediment inflow, trap efficiency, surface area, and storage capacity of a reservoir account for about 91.7% of its depth loss to sediment, while other factors account for about 4.8%. The p values of 0.003–0.028 were recorded, and this indicated that the factors contribute significantly to reservoir depth loss. The regression results also revealed that a unit increase in the age of a reservoir results in a 0.14% depth loss. For annual water inflows, the results indicated that a unit increase results in an increase in a reservoir depth loss by 12.51%. For annual sediment inflow, the model established that a unit increase results in an increase in depth loss in the reservoirs by 27.54% whilst a unit increase in annual trap efficiency results in a reservoir depth loss by 50.99%. Also, an increase in reservoir surface area and storage capacity by a unit results in an increase in a depth loss by 0.17% and 0.31% respectively.
Reservoir storage capacity and water surface area loss to sedimentation
The results from the bathymetric survey integrated with GIS are presented in , while the bathymetric TIN maps indicating the current storage capacities, water surface areas at full supply level and the spatial distribution of the TIN elevations of the reservoirs are also presented in . The current storage capacities of the reservoirs as estimated by the bathymetric survey ranged from 0.2 Mm3 at Gambibgo to 85.06 Mm3 at Tono as noted against their initial storage capacities at full supply level, which ranged from 0.3 to 93 Mm3, respectively. The estimated volumetric storage capacity loss indicating the volume of sediment accumulated in the reservoirs ranged from 0.1 Mm3 at Gambibgo to 7.94 Mm3 at Tono reservoir ( and and ).
Figure 5. 2017 Bathymetric TIN maps of study reservoirs.
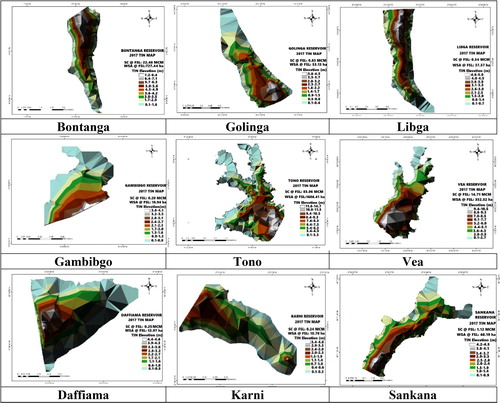
Figure 6. a) A plot of storage capacity versus age for Golinga, Libga, Gambibgo, Daffiama, Karni, and Sankana reservoirs. b) A plot of storage capacity versus age for Bontanga, Tono, and Vea reservoirs.
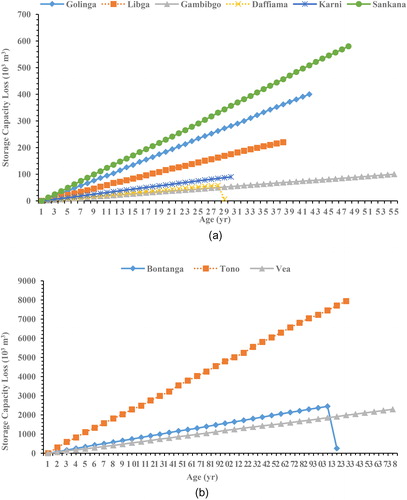
Figure 7. Plates illustrating some of the major activities in the buffer zones of the study reservoirs that significantly contribute to their sedimentation.
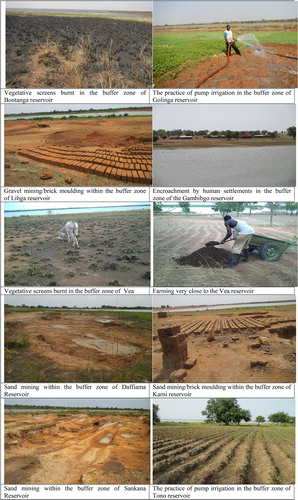
Table 6. Storage capacity and water surface area loss in the study reservoirs.
The bathymetric survey estimated the lowest storage capacity loss of 8.54% at Tono reservoir and 34.12% at Sankana reservoir as the highest. The average annual sedimentation rate was found to range from 0.26 to 0.91%, with the lowest rate recorded at Tono reservoir and the highest rate at Karni reservoir, as noted in . It was observed that the small and medium-size reservoirs, namely, Gambibgo, Sankana, Daffiama, Libga, Golinga, and Karni reservoirs, were rapidly losing their storage capacities to sediment deposits at high rates ranging from 0.61 to 0.91% per year compared to the sedimentation rates of 0.26–0.35% per year in the large reservoirs, namely, Tono, Bontanga, and Vea reservoirs. Considering the high rate of sedimentation in the small and medium-size reservoirs, they will be seriously affected by sedimentation within the next 5–10 years if control measures are not taken.
The findings of this study agree with the assertion of Chanson and James (Citation2005) that small and medium-size reservoirs are highly vulnerable to rapid sedimentation if strict reservoir protection measures are not put in place and enforced. The findings also align reasonably with findings in the United States, where the small and medium-size reservoirs were found to be losing storage capacity rapidly at an alarming rates of 1.5–3.5% per year while the large reservoirs were silting at a lower rate of 0.16% per year (Dendy et al. Citation1973). In other similar studies, Adwubi et al. (Citation2009) found 4 small reservoirs located in the Upper East Region of Ghana losing storage capacity rapidly at a mean rate of 1.75% per year. Abubakari (Citation2014) reported that the Tono reservoir was filling up rapidly with sediment at 1.74% per year. Ceylan and Ekizogllu (Citation2012) also reported a storage capacity loss of 0.51% per year in the Altinapa reservoir in Turkey, while Lago La Plata Reservoir in Puerto Rico was also reported to be losing its storage capacity annually by 0.56% (Gómez-Fragoso Citation2016).
As a result of the sedimentation of the reservoirs, there has been a loss in the water surface areas that was noted to range from 5.53 to 24.10%, with the least loss incurred in the Bontanga reservoir and the highest loss in the Golinga reservoir (). The water surface area loss was observed to be similar to the storage capacity loss, as the small and medium-size reservoirs recorded high water surface loss that ranged from 13.53 to 24.10% while the large storage reservoirs recorded low water surface loss of 5.53–8.44%. As observed from the TIN maps, the maximum loss occurred at the peripheries, especially the entry points of the tributaries that supply the reservoirs with water inflows. These areas were observed to have overgrown weeds, with other areas converted into farms. The TIN elevations indicate that, across all the reservoirs, the sections with maximum water holding capacities were closer to the dam wall, as can be observed in . The current (2017) reservoir bathymetry could not be compared to initial or any previous bathymetry on the reservoirs due to unavailability of data.
Effect of annual soil loss rate in reservoir catchment on annual rate of sedimentation and effect of reservoir catchment size on annual rate of sedimentation
A regression analysis was performed to statistically establish the relationship and the causal effect of annual soil loss rate in the reservoir catchments on annual rate of sedimentation. The regression analysis recorded an R2 of 0.238, and this indicates that annual soil loss rate in reservoir catchments accounts for about 23.8% of annual rate of sedimentation, while other factors account for about 76.2%. The results also indicated that an increase in annual soil loss in reservoir catchments by a unit results in an increase in annual rate of sedimentation by 13.5% (Equationequation 12(12)
(12) ). The results from Pearson’s correlation confirmed that there was a moderate positive correlation between annual soil loss rate in the reservoir catchments and annual rate of sedimentation, r = 0.367 and p = 0.032, with annual soil loss rate in the catchments explaining about 13.9% of the variation in the annual rate of sedimentation of their respective reservoirs:
(12)
(12)
where ASR is the annual rate of sedimentation of the reservoir (%/yr) and MASLR is the mean annual soil loss rate in reservoir catchment (t/ha/yr).
For the effect of reservoir catchment on annual rate of sedimentation, the regression analysis recorded an R2 of 0.085, and this suggests that about 8.5% of the variation in annual rate of sedimentation of reservoirs is caused by catchment size of the reservoirs. The results also indicated that every additional 1 km2 in catchment size could lead to an increase in annual rate of sedimentation of the reservoirs by 7.3%, as presented in Equationequation 13(13)
(13) . Also, Pearson correlation indicated that there was a very small positive correlation between the two variables with r = 0.291 and p = 0.041:
(13)
(13)
where ARS is the annual rate of sedimentation of the reservoir (%/yr) and SRC is the size of the reservoir catchment (km2).
Useful life of the study reservoirs
The useful life of a reservoir is the time taken for 50% of its initial (original) storage capacity to be depleted due to sedimentation (Gill Citation1979). Considering the mean annual sedimentation rate of 3289–265,813 m3/yr, the useful life of the reservoirs was estimated to range from 22 to 160 years, with Sankana and Tono reservoirs recording the lowest and highest, respectively, as presented in . The estimates indicated that if control measures are not taken, the Sankana, Golinga, Karni, Libga, Gambibgo, Daffiama, Vea, Bontanga, and Tono reservoirs would be 50% filled with sediments in the year 2041, 2042, 2044, 2047, 2048, 2057, 2122, 2123, and 2179, respectively. The predicted useful life of the reservoirs could not be compared to design useful life due to unavailability of design useful life data.
Comparing the volume of sediment deposits in each reservoir () to their dead storage capacities (), it was observed that all the reservoirs except Tono and Bontanga had lost their dead storage capacities ,which are meant to store sediment until their anticipated design life span. This finding is in line with that of Adwubi et al. (Citation2009), where 4 small reservoirs in the Upper East Region of Ghana lost their dead storage capacities within 9 yr of operation, with their useful life ranging from 22 to 190 years. The useful life of the Jibia reservoir located in Nigeria was estimated to be 55 years and it was predicted to be completely filled up with sediments in the year 2046, assuming the factors influencing the sedimentation and the rate of sedimentation remain unchanged (Yusuf and Yusuf Citation2012).
Major factors contributing to the sedimentation of the reservoirs
The study observed a number of major factors that either are potential sources or contribute significantly to the sedimentation of the reservoirs. Majority of these factors are mainly human activities within the reservoirs catchments and practices within buffer zones of the reservoirs. This article focused much more on the buffer practices because they are more concentrated, and, therefore mitigation measures are easier to enforce. These factors include:
Sand/gravel mining and brick molding activities within the catchments/buffer zones of the reservoirs. The grass species that check soil erosion at the peripheries of the reservoir are being cleared to make way for gravel/sand mining, as well as brick molding for construction of houses. This practice renders the ground bare and highly susceptible to erosion. The estimated area under these activities ranged from 5.9 to 812.5 ha ().
Conversion of buffer zones of the reservoirs into croplands. This activity makes the soil loose and easily eroded. Irrigated farming activities very close to the reservoirs using water pumps were observed seriously practiced in most of the catchments. The estimated area under these activities ranged from 70 to 24,586 ha ().
Improper farming practices such as plowing along the slope, slash/burn of crop residues, and farming very close to watercourses in the catchments also increase their susceptibility to water erosion and sediment transport into the reservoirs.
Depletion of upstream vegetative cover through burning and tree felling. Uncontrolled burning of reservoir protection grasses such as Panicum maximum grasses and other grass species by hunters and herdsmen to make way for the regeneration of fresh foliage for their animals to graze are very common in the catchments of reservoirs. The estimated area affected by annual burning ranged from 29 to 3,610 ha ().
Encroachment in the buffer zones of the reservoirs by human settlements as houses are built very close to about 50 m away from reservoirs. The inhabitants of these settlements established farmlands and gardens within 10–20 m of the reservoir shoreline. These activities normally cause accelerated soil erosion and high sediment transported into the reservoirs. The estimated encroached area ranged from 11.5 to 104.8 ha ().
High to very high sediment load discharge into the reservoirs. The estimated mean annual sediment load discharge into the reservoirs ranged from 3159 to 12,850 mg/L, values that are in the range of high to very high concentrations.
Table 7. Quantification of major activities that are significant sources of sediment load to the study reservoirs.
Measures for controlling and managing sedimentation of the reservoirs
Since the study reservoirs do not have outlet works for flushing out sediments, the study identified a number of pragmatic control measures that can be used by the management of the reservoirs to control their sedimentation so as to increase their useful life and benefits. The measures include:
The management of the reservoirs should collaborate with the district or municipal assemblies within which the reservoirs are situated to enact and enforce the necessary bylaws restricting farming, brick molding, sand/gravel mining activities, and encroachment of human settlement within the buffer zones of the reservoirs.
Pragmatic erosion control and soil and water conservation measures such as contour plowing, stone/earth bunding, zero/medium tillage, and upstream afforestation of the watersheds are best practices to reduce sediment production and should be carried out in the catchments of the reservoirs.
Establish vegetative screens at the entrance of the reservoirs as well as in the buffer zones to reduce the quantity of sediment that enters the reservoir, as the vegetative screens will trap large amounts of sediments that come along with inflows to the reservoirs. Burning of grasses and felling of trees within the buffer zones of the reservoirs should be prohibited.
Hydrosuction sediment-removal systems should be installed in the small reservoirs to flush out sediments.
Check dams should be constructed across the major river/streams that feed the reservoirs to reduce sediment inflow to the reservoirs.
Periodic desilting or dredging for removal of sediments should be carried out in the reservoirs for capacity restoration.
Conclusions
The study assessed reservoir sedimentation of 9 irrigation dams in 3 northern regions of Ghana and found substantial to dramatic sediment impacts at most of the reservoirs. The study reservoirs are losing their depths by 2.36–5.01 cm/yr. The reservoirs have accumulated about 0.1–7.94 Mm3 of sediment after 29 to 55 years of operation. The original storage capacities of the reservoirs have been reduced by 8.54–34.12% due to sedimentation, with the lowest and highest losses recorded at Tono and Sankana reservoirs, respectively. The annual rate of storage capacity loss ranged from 0.26 to 0.91%, with the lowest and highest sedimentation rates estimated at Tono and Karni reservoirs, respectively. The small and medium-size reservoirs were noted to be rapidly losing their storage capacities to sediment deposits when compared with the large reservoirs. The small and medium-size reservoirs will be seriously affected by sedimentation within the next 5–10 years if control measures are not taken. Due to the sedimentation, the reservoirs lost about 5.53–24.10% of their water surface areas, with the lowest and highest losses incurred in the Bontanga and Golinga reservoirs, respectively. The useful life of the reservoirs was found to range from 22 to 160 yr, with Sankana and Tono reservoirs recording the lowest and highest values, respectively.
The deposited sediments are richer in fine particles than in coarse particles. The Golinga, Libga, Gambibgo, Vea, Daffiama, Karni, and Sankana reservoirs had a well-formed delta and slightly formed tapering deposits, while the Bontanga and Tono reservoirs had a slightly formed delta and tapering deposits. The major land-use/land-cover classes in the catchments of the reservoirs include cropland, water body, built-up land, and open savannah woodland, with cropland constituting the largest area (over 40%) of each catchment and noted to be a potential source of sediment load to the various reservoirs. The mean annual sediment loads into the reservoirs is quite high, ranging from 3159 to 12,850 mg/L. The reservoirs received very high sediment inflows of 1594 to 355,017 m3 annually.
The major factors that either are potential sources or contribute significantly to the sedimentation of the reservoirs are mainly human activities within the reservoir catchments and practices concentrated within the buffer zones of the reservoirs. Restriction of farming, human settlements, burning, felling, and sand/gravel mining activities in the buffer zones of the reservoirs, as well as improved catchment management practices, construction of check dams, and installation hydrosuction sediment-removal systems, are very necessary to prevent rapid sedimentation of the reservoirs. There should be periodic desilting or dredging of the reservoirs for restoration of lost capacity.
References
- Abubakari A. 2014. Impact of land use changes on soil erosion and sedimentation in the tono reservoir catchment using GeoWEPP model. Master of Science Thesis, Kwame Nkrumah University of Science and Technology [accessed 2017 May 20]. http://ir.knust.edu.gh/xmlui/handle/123456789/6939?show=full
- Adwubi A, Amegashie BK, Agyare WA, Tamene L, Odai SN, Quansah C, Vlek P. 2009. Assessing sediment inputs to small reservoirs in Upper East Region, Ghana. Lakes Reserv Res Manag. 14(4):279–287. doi:10.1111/j.1440-1770.2009.00410.x.
- Aynekulu E, Atakliti S, Ejersa A. 2006. Small-scale reservoir sedimentation rate analysis for a reliable estimation of irrigation schemes economic lifetime: a case study of Adigudom Area, Tigray, Northern Ethiopia [accessed 2017 Mar 13]. https://www.zef.de/uploads/tx_zefportal/6dd3_Siltation_Tigray_Ethiopia_Ermias.pdf
- Basson G. 2007. Dams and the World’s water. Int Comm Large Dams. 4(2):301–309.
- Basson G. 2010. Sedimentation and sustainable use of reservoirs and river systems. International Commission on Large Dams (ICOLD) Bulletin. http://www.icold-cigb.org/2010.
- Bouyoucos GJ. 1963. Hydrometer method improved for making particle size analyses of soils. Agronomy Journal. 53:464–465. doi:10.2134/agronj1962.00021962005400050028x.
- Ceylan A, Ekizogllu I. 2012. A study on the assessment of bathymetric changes Via GIS: Altinapa Dam (Konya) Example. FIG Working Week.
- Chanson H, James DP. 2005. Siltation of Australian reservoirs: some observations and dam safety implications. Department of Civil Engineering. The University of Queensland, Brisbane QLD 4072, Australia. www.iahr.org/membersonly/grazproceedings99/doc/000/…/086.htm
- Chitata T, Mugabe FT, Kashaigili JJ. 2014. Estimation of small reservoir sedimentation in semi-arid Southern Zimbabwe. JWARP. 06(11):1017–1028. doi:10.4236/jwarp.2014.611096.
- Dendy FM, Champion WA, Wilson RB. 1973. Reservoir sedimentation surveys in the United States. Washington DC Am Geophys Union Geophy Monograp Ser. 17(1):349–357.
- Doyle MW, Stanley EH, Harbor JM, Grant GS. 2003. Dam removal in the United States: emerging needs for science and policy. Eos Trans Agu. 84(4):29–33. doi:10.1029/2003EO040001.
- Ferrari RL, Collins K. 2006. Reservoir survey and data analysis. Erosion and sedimentation manual. Bureau of reclamation, sedimentation and river hydraulics group. Denver, Colorado, Ch. 9, 66 pp [accessed 2017 Apr 20]. http://www.usbr.gov/pmts/sediment/kb/ErosionAndSedimentation/chapters/Chapter9.pd
- GIDA. 2017. Factsheet of Ghana Irrigation Development Authority (GIDA).
- Gill MA. 1979. Sedimentation and useful life of reservoirs. J Hydrol. 44(1-2):89–95. doi:10.1016/0022-1694(79)90148-3.
- Gómez-Fragoso J. 2016. Sedimentation survey of Lago La Plata, Toa Alta, Puerto Rico, March–April 2015: U.S. Geological Survey 2016 Scientific Investigations Map 3369.http://dx.doi.org/10.3133/sim3369. ISSN 2329-132X
- ICOUR. 2017. Factsheet of Irrigation Company of Upper Regions (ICOUR).
- Issa IE, Al-Ansari N, Knutsson S. 2013. Sedimentation and new operational curve for Mosul Dam, Iraq. Hydrolog Sci J. 58(7):1456–1466. doi:10.1080/02626667.2013.789138.
- Issa IE, Al-Ansari N, Knutsson S, Sherwany G. 2015. Monitoring and evaluating the sedimentation process in Mosul dam reservoir using trap efficiency approaches. ENG. 7(4):190–202. doi:10.4236/eng.2015.74015.
- Kamtukule SL. 2008. Investigating impacts of sedimentation on water availability in small dams: case study of Chamakala II Small Earth Dam in Malawi. [Msc dissertation] A Thesis submitted to the University of Zimbabwe for the Award of Master’s Degree of Integrated Water Resources Management. [accessed 2018 Jul 05]. http://www.waternetonline.org/download/data/download/00000092/Kamtukule-S-Final-Thesis.pdf
- Kolala M, Lungu C, Kambole C. 2015. The causes of dam failure a study of earthen embankment dams on the Copperbelt Province of Zambia. IJERT. 4(2):301–315.
- Mavima G, Soropa G, Makurira H, Dzvairo W. 2011. Sedimentation impacts on reservoir as a result of land use on a selected catchment in Zimbabwe. Int J Eng Sci Technol. 3(8):6599–6608.
- Molla T, Sisheber B. 2017. Estimating soil erosion risk and evaluating erosion control measures. Solid Earth. 8(1):13–23.
- Morris GL, Fan J. 1997. Reservoir sedimentation handbook, design and management of dams, reservoirs, and catchments for sustainable use. New York: McGraw-Hill Book Co., 805 pp.
- Namara R, Horowitz L, Nyamadi B, Barry B. 2011. Irrigation development in Ghana: past experiences, emerging opportunities, and future directions. GSSP Working Paper No. 0027. International Food Policy Research Institute. https://www.africaportal.org/publications/irrigation-development-in-ghana-past-experiences-emerging-opportunities-and-future-directions/
- Okalebo JR, Gathua KW, Woomer PL. 1993. Laboratory methods of soil and plant analysis: a working manual. Tropical soil biology and fertility. Soil Science Society of East Africa. Technical Publication No. 1. Nairobi, Kenya.
- Qamar S, Gopal NM. 2017. Useful life of a reservoir and its dependency on watershed activities. Agric. Res and Tech. 8(5):555–749.
- Rakhmatullaev S, Marache A, Huneau F, Le Coustumer P, Bakiev M, Motelica-Heino M. 2011. Geostatistical approach for the assessment of the water reservoir capacity in arid regions: a case study of the Akdarya Reservoir, Uzbekistan. Environ Earth Sci. 63(3):447–460. doi:10.1007/s12665-010-0711-3.
- Renard KG, Foster GR, Weesies GA, McCool DK, Yoder DC. 1997. Predicting soil erosion by water: a guide to conservation planning with the revised universal soil loss equation (RUSLE) (Vol. 703). Washington, DC: United States Department of Agriculture.
- Strand RI, Pemberton EL. 1982. Reservoir sedimentation: technical guideline for bureau of reclamation. Sedimentation and River Hydraulics Section, Hydrology Branch, Division of Planning Technical Services, Engineering and Research Center [accessed 2017 Oct 7]. https://www.usbr.gov/…/techreferences/reservoir/ReservoirSedimentationTechGuide10
- United States Army Corps of Engineers (USACE). 2017. Infrastructure report card; United States Army Corps of Engineers: Washington, DC, USA, 2017.
- Wang HW, Kondolf M, Tullos D, Kuo WC. 2018. Sediment management in Taiwan’s reservoirs and barriers to implementation. Water. 10(8):1034. doi:10.3390/w10081034.
- White R. 2001. Evacuation of sediments from reservoirs. London, UK: Thomas Telford Publishing.
- Wilson GL, Richards JM. 2006. Procedural documentation and accuracy assessment of bathymetric maps and area/capacity tables for small reservoirs: U.S. Geological Survey Scientific Investigations Report 2006–5208, 24 p [accessed 2017 Mar]. http://pubs.usgs.gov/sir/2006/5208.
- Young G. 2006. Preface. United Nation’s World Water Development Report, Wilfrid Laurier University, Waterloo, Ontairo [accessed 2017 Jun 2]. http://www.freedrinkingwater.com/water-education/waterhealth.htm
- Yusuf YO, Yusuf F. 2012. An assessment of the rate of siltation in Jibia Reservoir, Jibia, Katsina State. River Basin Manag VII. 172:189.
- Zarris D, Lykoudi E. 2003. Comparative analysis of different reservoir surveying methodologies for the optimum volumetric computation of fluvial sediment deposits. In 7th Hellenic Symposium on Oceanography and Fisheries, pp. 6–9.