
Abstract
Korosi JB, Thienpont JR, Eickmeyer DC, Kimpe LE, Blais JM. 2020. A paleolimnological approach for interpreting aquatic effects monitoring at the Diavik Diamond Mine (Lac de Gras, Northwest Territories, Canada). Lake Reserv Manage. 36:297–313.
A paleolimnological assessment of Lac de Gras (Northwest Territories, Canada) showed pronounced aquatic ecological and biogeochemical changes occurring since at least circa 1950, well before diamond mining operations began in 2000. These changes are likely a response to regional climate warming, which is confounding the interpretation of an Aquatic Effects Monitoring Program (AEMP) intended to identify early-warning indicators of diamond-mining impacts to water quality. In the latest AEMP report, action level exceedances based on 3 years of monitoring in Lac de Gras were reported for chlorophyll a and strontium, yet sediment cores collected from 3 different sites in the lake exhibited notable increasing trends in these parameters since pre-1950. Increases in the small, centric diatom Discostella pseudostelligera have also been occurring since pre-1950, which we infer to be a response to climate warming. Recent (post-1996) D. pseudostelligera increases observed from aquatic effects monitoring of nearby small lakes have previously been linked to nitrogen fertilization from diamond mining. Thus, our paleolimnological results clearly indicate that parameters predicted to respond to mining impacts are also responding similarly to regional climate warming. Based on this, AEMP adaptive management strategies need to consider the potential additive or synergistic effects of mining and climate change when establishing action level exceedances for water quality and ecological indicators. Using our paleolimnological data, we calculated background (premining) rates of change in key geochemical parameters that can provide a benchmark for evaluating ongoing changes in the current mining period, and for establishing AEMP significance thresholds.
Diamond-bearing kimberlite pipes were first discovered in northern Canada in 1991, in a vast and remote tundra landscape known colloquially as the Barren Lands (Northwest Territories). The Ekati Diamond Mine opened in 1998 under BHP Billiton Canada, Inc., as the first commercial diamond mine in Canada, and is one of 3 diamond mines operating in the Barren Lands today. To obtain a Water License to operate in the Northwest Territories (a jurisdiction with its own government within Canada), the mines are required to implement an Aquatic Effects Monitoring Program (AEMP) to determine the short- and long-term impacts of mining activities on surface water quality, intended to guide the implementation of mitigation strategies (MVLB/GNWT 2019). AEMPs include the routine monitoring of water and sediment chemistry, plankton, benthos, and fish over the duration of the project, in impacted surface waters and reference sites. AEMPs also typically include 1–2 years of baseline monitoring conducted prior to the onset of operations.
Of particular concern is the potential for increases in total suspended and dissolved constituents (Rollo and Jamieson Citation2006) resulting from the release of diamond mine discharge waters, including some ions and trace elements (e.g., chloride [Cl-], copper [Cu], aluminum [Al] that can have toxic effects on aquatic biota (ERM Citation2014). As part of mining operations, explosives are used to fragment rock, and waste rock is commonly stockpiled on site. Dust, as well as leaching and groundwater seepage from waste rock constituents and blasting residuals, can contribute phosphates, nitrate, and ammonia to nearby surface waters (Bailey et al. Citation2013, Vandenberg et al. Citation2016, Golder Associates Citation2018). The potential ecological impacts of nitrate and phosphorus inputs to surface waters are a central water quality concern for diamond mining activities in the Barren Lands, including Lac de Gras (Bailey et al. Citation2013, Golder Associates Citation2018). Phosphorus, typically the limiting nutrient in freshwater ecosystems, has been reported to be increasing in lakes receiving mine discharge waters (ERM Citation2014). Consequently, nutrients and measures of lake productivity (such as chlorophyll a and phytoplankton community composition) are also carefully monitored. In the 2017 AEMP report, based on the previous 3 years of monitoring in Lac de Gras, documented increases in chlorophyll a triggered Action Level 2, defined as trending toward a preestablished significance threshold that indicates departure from baseline conditions (Golder Associates Citation2018).
Climate warming is an important, independent driver of Arctic limnological change that may confound the interpretation of AEMP data (Vincent et al. Citation2013). Although AEMPs include 1–2 years of baseline monitoring, this is likely not sufficient for characterizing the limnological responses to climate warming, as the instrumental record shows air temperatures in the Barren Lands have been steadily increasing since circa 1960 (Mullan et al. Citation2017), and paleolimnological records show striking lake ecosystem changes beginning circa 1850 (Rühland and Smol Citation2005). For example, several small lakes receiving discharge waters from the Ekati Diamond Mine exhibited increases in Cyclotella (small, centric diatom taxa) over the course of 19 years of AEMP data, which has been interpreted as a response to nitrogen discharge from the mine (St-Gelais et al. Citation2018). However, widespread increases in Cyclotella have also been reported in lakes across the northern hemisphere as a response to climate warming (Rühland et al. Citation2015), including in Slipper Lake, the most distal in the chain of small lakes receiving discharge waters from Ekati (Rühland and Smol Citation2005). Based on Ekati AEMP data, Cyclotella increased in Slipper Lake after 2005 (St-Gelais et al. Citation2018), while a paleolimnological analysis of Slipper Lake conducted on a sediment core collected in 1997 (prior to the mine opening in 1998) recorded an abrupt increase in Cyclotella beginning in the 19th century (Rühland and Smol Citation2005).
The discrepancy between the monitoring and paleolimnological records of Slipper Lake clearly demonstrates the importance of time scales in understanding drivers of limnological change and the challenges associated with attempting to understand mining impacts on northern aquatic ecosystems that are being transformed as a result of climate warming. Thus, paleolimnological studies have much to contribute to our understanding of the impacts of diamond mining activities on the tundra lakes of the Barren Lands because they provide an indirect mechanism for identifying trajectories of environmental change in response to climate signals that began before the onset of mining impacts. In this study, we collected sediment cores from 3 locations in Lac de Gras, a large, cold monomictic lake where the Diavik Diamond Mine is located (). We performed sedimentary inferences of geochemical and ecological conditions prior to the onset of mining, in order to interpret water quality changes reported by the Diavik AEMP in the context of long-term limnological trends occurring in Lac de Gras in response to climate warming. We measured trace elements (e.g., Al, Cu, strontium [Sr], lead [Pb], and zinc [Zn]) because mine discharge waters and dust from waste rock piles are potential sources of these elements to nearby surface waters, and AEMP exceedances have been reported for Al, Cu, and Sr, among others. We also analyzed temporal trends in chlorophyll a and nitrogen isotopes to identify a possible eutrophication signal related to nitrogen pollution. Finally, subfossil diatoms were also analyzed, as diatom species responses to climate warming and nutrient pollution are well established based on previous studies (Saros et al. Citation2014, Rühland et al. Citation2015, Malik et al. Citation2018). Large northern lakes are historically understudied systems (Cott et al. Citation2016), and our study on Lac de Gras addresses a critical knowledge gap in our understanding of the responses of these systems to anthropogenic climate change.
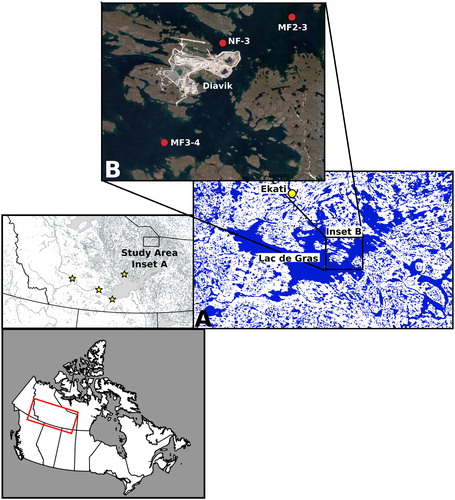
Figure 1. Study site locations. Map showing the location of Lac de Gras within the Northwest Territories of Canada (inset A), and the locations of the Diavik Diamond Mine and the 3 sediment coring locations within Lac de Gras (inset B). Yellow stars represent the locations of major population centers in the Northwest Territories, including the city of Yellowknife (northernmost star).
Study site
The Lac de Gras watershed is located ∼50 km north of treeline and ∼300 km northeast of the city of Yellowknife, within the Wek’èezhı̀i area (). The area is part of a historic land claim agreement with the Government of Canada, known as the Tłįchǫ Agreement (2005), which recognizes the land, resources, and self-government rights of the Tłįchǫ peoples. It is in the Slave Geological Province and includes Precambrian granitic, gneissic, metasedimentary, and metavolcanic rocks (Geological Survey of Canada Citation2014). The Lac de Gras kimberlite field is of Late Cretaceous to Eocene age (Sarkar et al. Citation2015), and supports the Dominion Diamond Corporation (DDC) Ekati Diamond Mine (operational since 1998) and the DDC–RioTinto Diavik Diamond Mine (operational since 2000). The area is characterized by low topographical relief, thin surficial tills, glaciofluvial sediments (Dredge et al. Citation1999, Hu et al. Citation2003), continuous permafrost (Heginbottom et al. Citation1995), and an abundance of lakes and streams (Baki et al. Citation2012). Vegetation consists primarily of dwarf birch (Betula glandulosa), willow (Salix spp.), and northern Labrador tea (Rhododendron tomentosum; Ritchie Citation1993). Climate is continental, with short cool summers and long cold winters (Hu et al. Citation2003). Mean annual air temperature recorded at the Ekati Diamond Mine () from October 2016 to September 2017 was −7.9 C (15 C in Jul; −26.1 C in Feb), and total annual precipitation is 236.5 mm, with 34% falling as snow (ERM Citation2018).
Lac de Gras is the headwater of the Coppermine River, which flows north and discharges into the Arctic Ocean. It is a large lake, with a surface area of 569 km2, an average depth of 12 m, a maximum depth of 56 m, and is typically ice-covered from approximately late October to late June (Deton’ Cho Stantec Citation2015). Limnological depth-profile data for temperature collected monthly from June to September during 1996–2009 (albeit from different sampling sites on the lake, all roughly 20 m in depth) showed that the maximum surface water temperatures in summer were 10 C, and the lake did not exhibit thermal stratification at least in the top 20 m during the open-water season (Deton’ Cho Stantec Citation2015). Lac de Gras is an ultraoligotrophic, slightly acidic to circumneutral, dilute, and clear lake (). The Diavik Diamond Mine operates on the East Island (), and effluent flows into Lac de Gras through 2 diffusers at the North Inlet Water Treatment Plant. Annual estimates of discharge volumes from the Diavik Diamond Mine have been estimated to range from approximately 4000 to 12,000 ML, from 2002 to 2013 (Deton’ Cho Stantec Citation2015). The Ekati Mine is located ∼15 km north of Lac de Gras, and mine wastewaters discharge into Lac de Gras at the Slipper Lake and Lac du Sauvage outlets. Modeled annual effluent discharge volume at the Slipper Lake outlet is estimated at 12,000 to 51,000 ML annually from 2000 to 2013, and flows through a chain of 7 lakes (including Slipper Lake) before it discharges into the northwest arm of Lac de Gras (Deton’ Cho Stantec Citation2015). The total residence time in the series of lakes between the Ekati containment facility and its discharge into Lac de Gras is estimated to be 324 d (Rescan Citation2012). Data are unavailable for effluent discharge from Ekati’s Misery pit into the Lac de Sauvage outlet at the eastern arm of Lac de Gras. Dust deposition rates are lower than the British Columbia dustfall objective for the mining industry, and ranged from an average of 354 mg/dm2/yr for sites within 100 m of the mine to 139 mg/dm2/yr for sites located 250–1000 m from the mine (Golder Associates Citation2018). Water chemistry, plankton, and benthos have been monitored at several sites in Lac de Gras regularly since 2001.
Table 1. Lac de Gras sediment coring sites.
Monitoring of chlorophyll a, phytoplankton and zooplankton biomass, total phosphorus, and total nitrogen indicate some nutrient enrichment has occurred since the opening of the mine, as spatial gradients in these parameters are evident with distance from mine effluent discharge sites and the spatial extent of dust deposition (Golder Associates Citation2018).The magnitude of the effect in chlorophyll a triggered an Action Level 2 designation, which requires the establishment of an Effects Benchmark (Golder Associates Citation2018). Water hardness, conductivity, Cl-, sulfate (SO42-), and Sr showed significant increasing trends lake-wide over the period of water quality monitoring (Deton’ Cho Stantec Citation2015). Concentrations of ammonia, Pb, and tin (Sn) were greater at midfield sampling stations potentially affected by dust deposition compared to reference conditions (Golder Associates Citation2018).
Methods
Field methods
Three coring locations were selected from among the sites routinely monitored for aquatic biota, water, and sediment chemistry as part of Diavik’s AEMP (Golder Associates Citation2018). Site Near-Field 3 (NF3; depth = 19.1 m) is located nearest to the effluent diffuser, and thus is considered to have the greatest exposure to mine impacts. Sites Midfield 2–3 (MF2–3; depth = 20.7 m) and Midfield 3–4 (MF3–4; depth = 18.2 m) are both located midfield to the effluent diffuser, surrounding the East Island where Diavik Diamond Mine is located, and are considered to have intermediate exposure to the mine. One sediment core (18.5–23.5 cm in length) was collected from each of 3 locations in Lac de Gras (, ) in August 2014 using a gravity corer (UWITEC, Austria). Sediment cores were sectioned into 0.25 cm intervals on site using a modified Glew vertical extruder (Glew Citation1988). Sediment cores were shipped frozen to the University of Ottawa and freeze-dried prior to further analyses.
Laboratory methods
Cores were 210Pb dated using an Ortec high-purity germanium gamma spectrometer (Oak Ridge, TN, USA) following methods in Appleby (Citation2001). Certified reference materials obtained from the International Atomic Energy Association (Vienna, Austria) were used to calibrate and perform efficiency corrections on the gamma spectrometer. Results were analyzed using ScienTissiME, a Matlab-based program (Barry’s Bay, ON, Canada). A chronology was established using the constant flux constant sedimentation rate (CFCS) model (Appleby Citation2001), which gave results nearly identical to the constant rate of supply model (Appleby and Oldfield Citation1978). Approximately 0.5 g of freeze-dried sediments was shipped to SGS Minerals Services in Lakefield, Ontario, a Canadian Association for Laboratory Accreditation (CALA)-accredited facility, for analysis of total metals. Briefly, samples were digested using microwave-assisted aqua regia and analyzed using inductively coupled plasma–mass spectrometry. We did not normalize our metals data to a lithogenic tracer (e.g., lithium [Li], titanium [Ti], or Al) because dust deposition is an important source of metals to Lac de Gras associated with mining activity, which would give a geogenic signal that could be missed by using a lithogenic tracer. We also chose not to normalize to organic carbon (OC) to account for changes in metal fluxes driven by climate-mediated changes in organic matter cycling because increasing OC is also a potential impact of mining activities independent of metal contamination, due to mining-related eutrophication, which would confound its use as a normalizing agent for metals. Rates of percent change through time were calculated for geochemical parameters also included in Lac de Gras AEMP monitoring. Rates of percent change were calculated first by calculating the percent change between adjacent sediment intervals, then dividing that by the difference in the age of the intervals.
In order to reconstruct trends in algal production, visual reflectance spectroscopy (VRS) was used to infer sedimentary chlorophyll a following methods in Michelutti et al. (Citation2005, Michelutti and Smol Citation2016), a procedure that incorporates estimates of chlorophyll a and its diagenetic products. Rates of percent change in chlorophyll a were also calculated following methods described above for metals. For analysis of percent organic carbon and percent nitrogen, freeze-dried sediment was acid-fumigated with concentrated HCl for 48 h in an acid desiccator to remove inorganic carbon (Harris et al. Citation2001). Sample vials were then filled with deionized water, centrifuged at 3000 rpm for 10 min, and the supernatant was discarded. This step was repeated twice more, and then samples were freeze-dried again. Approximately 5–10 mg of sample was weighed into a tin capsule containing 20 µg tungsten trioxide and analyzed using a Vario EL III elemental analyzer (Elementar, Germany) at the Ján Veizer Stable Isotope Laboratory (University of Ottawa), following methods described in Brazeau et al. (Citation2013). For δ15N analysis, 15–100 mg of untreated sediment was weighed into a tin capsule (weight dependent on %N content of sediment samples) and loaded into the elemental analyzer interfaced to the DeltaPlus XP isotope ratio mass spectrometer (ThermoFinnigan, Germany) at the Ján Veizer Isotope Laboratory. Calibrated internal standards were used for normalization of the data, and precision was better than 0.20‰ (Pella Citation1990).
Subfossil diatoms were analyzed in the sediment cores collected from a near-field site (NF3) and one of the midfield sites (MF2–3). Diatoms were isolated from the sediment matrix following methods outlined in Battarbee et al. (Citation2001). Briefly, sediments were digested with a 1:1 mixture of nitric and sulfuric acid in a water bath at 80 C for 3 h. Samples were then neutralized by adding fresh deionized water daily for 7 d until a neutral pH was reached. Samples were then plated onto microscope coverslips to dry, and then mounted onto microscope slides using Naphrax. Diatoms were identified to species level on an AmScope T690C-PL light microscope at 1000× magnification using Krammer and Lange-Bertalot (Citation1986, Citation1988, Citation1991, Citation2000) and Fallu et al. (Citation2000) as taxonomic guides. A minimum of 400 diatom valves were counted per interval. A principal components analysis (PCA) was conducted on the diatom stratigraphy data (a separate PCA for each sediment core) in order to visualize trends in overall species assemblage through time.
Results
210Pb dating
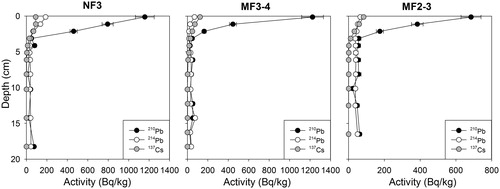
The 3 Lac de Gras cores exhibited an exponential decay in total 210Pb with depth, which reached background 210Pb (i.e., no more unsupported 210Pb was present) at ∼4–5 cm (), with the entire current mining period included in the top 0.5–0.75 cm. In each core, a slight increase in 137Cs was observed in the top 3 cm, with no distinct 137Cs peak (). Sedimentation rates were estimated at 0.0138 ± 0.0017 g/cm2/yr in MF2–3 and NF3, and 0.00138 ± 0.0001 g/cm2/yr in MF3–4. The basal sediment dates based on the CFCS age model were as follows: NF3 = 1395 ± 77 CE, MF2–3 = 1050 ± 43 CE, MF3–4 = 415 ± 43 CE.
Figure 2. Results of 210Pb gamma dating of Lac de Gras cores. Radioisotopic activities for 210Pb, 214Pb, and 137Cs in sediment cores collected from 3 sites (NF3, MF2–3, MF3–4) in Lac de Gras. Chronology and inferred sedimentation rates were determined using the constant flux constant sedimentation model (Appleby and Oldfield Citation1978).
Geochemical analysis
NF3 (near-field)
Concentrations of arsenic (As), Cu, Al, and iron (Fe) were relatively stable throughout the sediment core, while manganese (Mn), Sr, and Zn increased above a core depth of 3 cm to the surface interval, increasing from 1500 to 7100 µg/g, from 7.8 to 18 µg/g, and from 53 to 89 µg/g, respectively (). Rates of change for Sr and Zn were elevated slightly in the postmining period relative to the premining period, while rates of change in Pb were higher in the premining period (). The Pb concentrations also increased between 3 and 0.5 cm, from 4.9 to ∼15 µg/g, and stabilized during the current mining period (). Sedimentary nitrogen (%N) and organic carbon (%OC) increased above 12 cm to the surface interval, from 0.1 to 0.5% and from 1.2 to 4.8%, respectively (). The C/N ratio, a commonly used indicator of the relative fraction of terrestrial versus algal organic matter sources (Meyers and Teranes Citation2002), declined slightly above a core depth of 2 cm, from 13.2 to 11.5 (). Sedimentary sulfur (%S) increased slightly above background in the current mining period (). δ15N exhibited a steady decrease from the bottom of the core to 0.75 cm (10.7 to 5.0‰), and increased again above 0.75 cm (the current mining period) to 6.3‰ in the surface interval (). VRS-inferred chlorophyll a increased beginning at a core depth of 2 cm (). Although chlorophyll a showed increasing trends beginning in the premining period, the rate of change in chlorophyll a was higher in the postmining period of increase ().
Figure 3. Temporal trends in sedimentary metal concentrations in Lac de Gras sediment cores. Stratigraphy showing downcore changes in several metals at 3 sites in Lac de Gras along a gradient of impact from diamond mining operations. Concentrations are in µg/g dry weight. The gray box represents the current mining period.
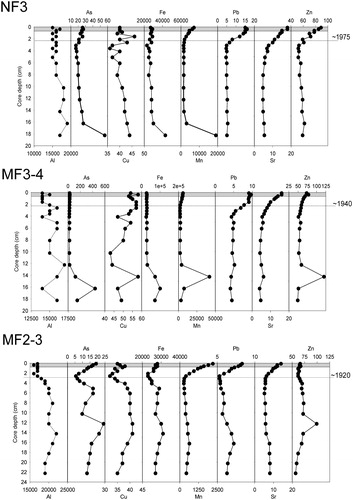
Figure 4. Temporal changes in organic matter composition in Lac de Gras cores. Stratigraphy showing downcore changes in nitrogen stable isotope composition, percent total nitrogen (TN), percent total organic carbon (OC), percent sulfur (S), carbon:nitrogen ratio (C/N), and chlorophyll a inferred using visible reflectance spectroscopy (mg/g dry weight) in sediment cores from Lac de Gras along a gradient of impact from diamond mining operations. The gray box represents the current mining period. The dashed line represents the estimated lower method detection limit for VRS–chlorophyll a (Michelutti et al. Citation2005).
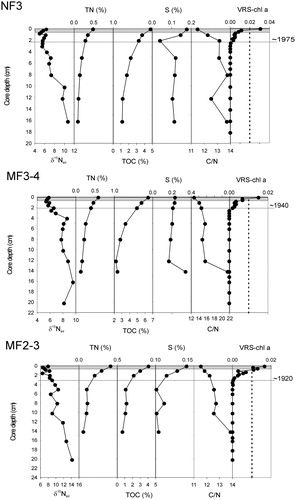
Table 2. Rates of change in geochemical proxies in Lac de Gras sediment cores.
MF3–4 (midfield)
Increases in Pb, Sr, Mn, and Zn were observed above a core depth of 3 to 4 cm, from ∼4.5 to ∼9.0 µg/g, from ∼5.0 to 16.0 µg/g, from 2300 to 6200 µg/g, and from ∼50 to ∼70 µg/g, respectively (). Rates of change for Sr and Zn were elevated slightly in the postmining period relative to the premining period, while rates of change in Pb and Mn were higher in the premining period (). The %OC and %N increased steadily from 12 cm to the surface of the core, from 0.13 to 0.58% and from 2.4 to 6.4%, respectively, while no trend was observed for %S (). The C/N ratio decreased from 14 to 12 cm, and again from 6 cm toward the surface of the core, a total decrease from 21.4 to 12.8 (). The δ15N exhibited a steady decrease above a core depth of 4 cm, from 8.2 to 5.7‰ (). VRS-inferred chlorophyll a increased above 2 cm, increasing above the lower limit of detection in the current mining period (). The rate of change in chlorophyll a was higher in the postmining period of increase ().
MF2–3 (midfield)
A slight decrease in Al concentrations was observed above a core depth of 8 cm, decreasing from 21,000 µg/g to 17,000 µg/g in the upper 2 cm, circa 1950 (). Arsenic concentrations were variable, and increased from 5.6 to 19 µg/g above 2.5 cm, which was still within the range of background for the sediment core (). Concentrations of Pb and Sr increased above 2 cm, from 5.3 to 8.3 µg/g, and from 7.3 to 14 µg/g, respectively (). The rate of change in Sr was higher in the postmining period, while rates of change for Pb were comparable between the pre- and postmining period (). The %OC and %N increased steadily above 6 cm toward the surface of the core, from 0.06 to 0.41% and 0.6 to 4.1%, respectively, and C/N decreased slightly between 14 to 12 cm, and again between 6 and 0 cm, for a total decrease from 13.8 to 11.5 (). The %S increased slightly in the current mining period, from 0.12 to 0.15% (). δ15N exhibited a steady decrease from 14.2‰ at core depth 20 cm, to ∼6–7‰ in the surface intervals (). VRS-inferred chlorophyll a exhibited an increasing trend above 3 cm, increasing above the lower limit of detection in the current mining period (). The rate of change in chlorophyll a was higher in the premining period of increase relative to the postmining period ().
Diatoms
NF3 (near-field)
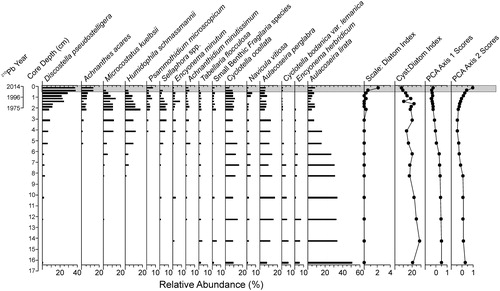
Distinct shifts in diatom assemblage structure occurred at NF3 prior to the opening of the Diavik Diamond Mine in the year 2000 (). Diatom assemblages in the preindustrial period were dominated by Aulacoseira lirata (30–40%), Aulacoseira perglabra (15–20%), and Cyclotella ocellata (15–20%), with Cyclotella bodanica var. lemanica and Encyonema herbridicum present at 5–10% abundance. Above a core depth of 8 cm, A. lirata, C. bodanica, and E. herbridicum decreased in relative abundance, from ∼30–40 to ∼5–10%, from 15–20% to 1–2%, and from 5–10% to 1–2%, respectively. Discostella pseudostelligera, Microcostatus kuelbsii, Humidophila schmassmannii, Sellaphora spp., and Encyonema minutum first appeared and increased in relative abundances above 8 cm. Above a core depth of 2 cm (ca. 1975), further increases in D. pseudostelligera occurred, as well as increases in Achnanthes acares, small benthic Fragilaria spp., and Psammothidium microscopicum. In the current mining period (above core depth 0.75 cm), D. pseudostelligera further increased to become the dominant taxon at ∼40% relative abundance, M. kuelbsii and H. schmassmannii decreased to <1%, and the ratio of chrysophyte scales to diatoms increased. Post-1950 diatom assemblage changes were most evident from PCA axis 2 scores.
Figure 5. Temporal changes in diatoms at site NF3. Stratigraphic profile of the most abundant diatom taxa (as relative abundances) in a sediment core collected from site NF3 in Lac de Gras, located near the effluent discharge site at the Diavik Diamond Mine. 210Pb-inferred dates are shown as a secondary y-axis. Principal components analysis axis 1 and axis 2 scores for diatom assemblages are also shown, as well as the ratio of chrysophyte scales to diatoms, and the ratio of chrysophyte cysts to diatoms. The gray box represents the current mining period.
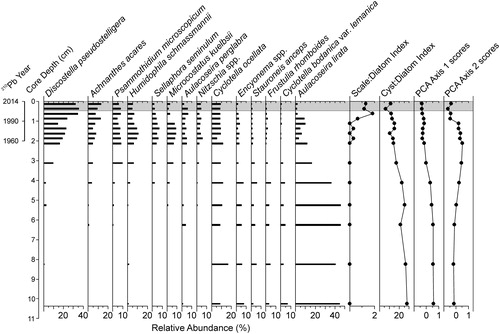
MF2–3 (midfield)
A shift in diatom assemblage occurred from 4 to 2 cm (). Below core depth 4 cm, the assemblage was dominated by A. lirata, at relative abundances of 40–50%. Cyclotella ocellata (10–20%), Encyonema spp. (∼10%), Stauroneis anceps (5–10%), Frustulia rhomboides (∼5%), and C. bodanica (∼5%) were also prevalent. At core depth 2 cm (ca. 1950), decreases in relative abundance occurred for A. lirata (to ∼10% relative abundance), C. bodanica (to <2%), F. rhomboides (to <2%), S. anceps (to <2%), and Encyonema spp. (to <5%). Increases in relative abundance were observed for D. pseudostelligera, A. acares, P. microscopicum, H. schmassmannii, Sellaphora seminulum, M. kuelbsii, A. perglabra, and Nitzscia spp., species that were mostly absent below core depth 4 cm. A further increase in D. pseudostelligera (from ∼25 to 40%) and decrease in A. lirata (from ∼10 to 2%) occurred in the postmining period. The chrysophyte scale:diatom index increased above core depth 1 cm (ca. 1990), and no further increases occurred in the postmine period. PCA axis 1 scores decreased from ∼5 to 2 cm (ca. 1960), and were stable in the uppermost 2 cm. PCA axis 2 scores increased from ∼5 to 2 cm, and then decreased again between 1.5 and 1 cm.
Figure 6. Temporal changes in diatoms at site MF2–3. Stratigraphic profile of the most abundant diatom taxa (as relative abundances) in a sediment core collected from site MF2–3 in Lac de Gras, located midfield from the Diavik Diamond Mine. 210Pb-inferred dates are shown as a secondary y-axis. Principal components analysis axis 1 and axis 2 scores for diatom assemblages are also shown, as well as the ratio of chrysophyte scales to diatoms, and the ratio of chrysophyte cysts to diatoms. The gray box represents the current mining period.
Discussion
Long-term changes in eutrophication indicators
Our paleolimnological findings for organic carbon, nitrogen, and chlorophyll a indicate that lake productivity has been increasing since pre-1950, well before the opening of the Diavik and Ekati diamond mines in the late 1990s and early 2000s. Only nitrogen stable isotope composition showed a clear deviation from the premining trajectory of change. Sedimentary organic carbon and nitrogen (total nitrogen, TN) content exhibited gradual increases since circa 1700 in all 3 sediment cores collected from Lac de Gras, although absolute percentages remained low (∼5–7% for OC and ∼0.5% for TN), indicating a long-term gradual increase in aquatic productivity. C/N ratios, which provide an estimate of the relative contributions of algal versus terrestrial sources of organic matter to lake sediments, decreased after circa 1950. Fresh organic matter derived from phytoplankton has C/N values in the range of ∼4–10, whereas organic matter originating from vascular land plants typically has C/N values of >20 (Meyers and Teranes Citation2002). In Lac de Gras, C/N decreased from ∼14 to ∼11, which is indicative of an increased contribution of organic matter originating from in-lake primary productivity. Similarly, post-1950 increasing trends in VRS-inferred chlorophyll a were also apparent in all 3 Lac de Gras sediment cores, although we caution that VRS Chl-a values that are below the estimated method detection limit should be interpreted with caution. Widespread increases in lake primary productivity have also been reported for lakes across the circumpolar Arctic and subarctic, a trend that has been inferred as a response to a longer open-water growing season due to climate warming (Michelutti et al. Citation2005, Griffiths et al. Citation2017, Hadley et al. Citation2019). For cores NF3 and MF3–4, the current mining period showed, on average, higher rates of percent change in VRS Chl-a, which may indicate an additive or synergistic effect between climate warming and nutrient release from mining activities. Similarly, the only intervals with VRS Chl-a above method detection limits for all 3 Lac de Gras cores are in sediments deposited in the current mining period, which may provide supporting evidence for at least a partial eutrophication effect of mining activities.
Long-term decreases in δ15N (from >10‰ to ∼4–6‰) were observed in all 3 sediment cores beginning circa 1900, indicating that changes in nitrogen cycling have occurred in Lac de Gras. The limnological processes contributing to changes in bulk δ15N are complex, making it challenging to interpret the underlying mechanisms driving the long-term shift in δ15N in lake sediment records (Meyers Citation2003). However, the temporal changes in δ15N values in the Lac de Gras sediment cores are consistent with seasonal changes in δ15N in Lake Ontario (northeastern United States and southern Canada), where δ15N values were low (∼6–8‰) during the spring and summer phytoplankton bloom, and high (10–12‰) during the late fall and winter, when organic matter originated from heterotrophic sources (Hodell and Schelske Citation1998). Based on this, we suggest that the postindustrial decrease in δ15N in Lac de Gras is likely tracking a shift from predominantly heterotrophic processes and sources of organic matter to more isotopically depleted phytoplankton detrital sources as the duration of the ice-free season has lengthened. In the current mining period, δ15N increased in NF3 and to a lesser extent in MF3–4, but not in MF2–3. Large inputs of nitrates from blast residue would be expected to alter the isotopic nitrogen signature, and thus the increase in δ15N (a reversal of the long-term trend) can be plausibly linked to diamond mining activities. Inorganic nitrogen inputs, for example, from agricultural fertilizers, have been shown to alter bulk sedimentary nitrogen isotope signatures in previous studies (Woodward et al. Citation2012. Wang et al. Citation2019). Furthermore, the current mining trend of increased δ15N is most pronounced in NF3, the site impacted most. This is what would be expected if mining activities were responsible for the change in δ15N.
Striking diatom assemblage changes are evident from the Lac de Gras subfossil record since pre-1950, well before mining operations began, likely reflecting changes in lake ice phenology and associated limnological responses to regional climate warming. Beginning pre-1950, decreases in the heavily silicified, tychoplanktonic taxon Aulacoseira lirata and in large-celled Cyclotella bodanica var. lemanica occurred coincident with increases in the relative abundances of a range of benthic and periphytic species of the Achnanthes sensu lato (acares, microscopicum) and small Navicula sensu lato (kuelbsii, schmassmani). A longer ice-free season, and consequently a longer growing season, in response to regional warming would result in increases in littoral habitat growth (e.g., aquatic mosses, macrophytes), supporting the population growth of associated periphytic diatom taxa. Similar diatom assemblage changes have been documented across the circumpolar Arctic (Smol et al. Citation2005, Rühland et al. Citation2015).
Since roughly the 1950s, Discostella pseudostelligera has proliferated to become the dominant diatom taxon in Lac de Gras (at least at sites NF3 and MF2–3). Scaled chrysophytes, a holoplanktonic group that requires appropriate pelagic habitat to flourish, increased at the same time as D. pseudostelligera. Discostella pseudostelligera is a small, rapidly growing, centric diatom that is often indicative of climate-driven physical changes in lakes (Winder et al. Citation2009, Wang et al. Citation2012). Circumpolar increases in D. pseudostelligera in the postindustrial period have been reported in lakes across the northern hemisphere, often corresponding with a longer ice-free period and greater water column stability (reviewed in Rühland et al. Citation2015). Synergistic interactions between nutrients (particularly nitrogen), light, and water column stability have also been postulated as potential drivers of increases in D. pseudostelligera (Saros et al. Citation2012, Saros et al. Citation2014, Malik et al. Citation2018). Based on long-term limnological monitoring conducted as part of the Diavik AEMP, Lac de Gras does not exhibit thermal stratification over the ice-free period, although short-lived periods of stratification and weakened mixing events are possible and may impact diatom assemblages (Rühland et al. Citation2013, Paterson et al. Citation2014). In the Lac de Gras watershed, permafrost thaw occurring in response to regional warming likely enhanced the flux of nutrients into the ultraoligotrophic Lac de Gras (Petrone et al. Citation2006, Reyes and Lougheed Citation2015). Thus, the proliferation of D. pseudostelligera beginning after circa 1950 likely reflects climate-driven changes in lake physical and biogeochemical processes, resulting in the crossing of ecological thresholds for phytoplankton communities. In small waterbodies north of Lac de Gras that receive effluent from the Ekati Diamond Mine, increases in the small centric diatom taxa Cyclotella have also been observed over the period of aquatic effects monitoring; however, this was interpreted as a response to nitrogen fertilization (St-Gelais et al. Citation2018). Importantly, diatom changes in Lac de Gras occurring in the current mining period are a continuation of trends that began circa 1950, and thus cannot be solely interpreted as a response to nitrogen and/or phosphorus fertilization.
Long-term changes in sedimentary metal concentrations
A paleolimnological approach can be used to establish long-term trajectories of change in trace metals in Lac de Gras, to place current monitoring observations in the context of ongoing climate warming. Based on the sediment cores collected from the 3 AEMP monitoring sites in Lac de Gras, strontium, lead, zinc, and manganese concentrations have been increasing over the postindustrial period. The percent sulfur has also been increasing in NF3 and MF2–3, but not in MF3–4. Increases in lead are likely a result of long-range transport of airborne pollutants from leaded fuels, and similar increases have been noted in sediment cores from across Arctic and subarctic regions (e.g., Bindler et al. Citation2001, Liu et al. Citation2012). Strontium is notably elevated in western Canadian Arctic lakes impacted by retrogressive thaw slumping (Mesquita et al. Citation2010, Houben et al. Citation2016), and its long-term increase in Lac de Gras may similarly provide a signature for thawing permafrost processes in the watershed. The thawing of permafrost and subsequent deepening of the seasonally thawed active layer can expose previously frozen soils to decomposition and mineral weathering processes, enhancing the flux of trace elements into hydrologically connected waterbodies. For example, seasonal geochemical signatures of trace metals in surface waters of 2 Alaskan watersheds were linked to the extent of active layer thaw, indicating that surface-water trace metal composition may provide a watershed-scale proxy for thawing permafrost soils (Barker et al. Citation2014). Thawing of permafrost may also result in reducing conditions in watershed soils if melted water stagnates, enhancing the mobility of redox-sensitive transitional metals such as manganese, iron, and zinc (Davidson Citation1993). Increases in the concentration of manganese in Lac de Gras sediments, decoupled from iron, may reflect an increased input of organic matter from the catchment, and/or the development of mildly reducing conditions in catchment soils, as manganese is more readily soluble than iron (Davidson Citation1993).
Among the trace elements that triggered AEMP Action Level 1 or 2, strontium and sulfur showed clear increasing trends prior to the opening of the Diavik and Ekati Diamond Mines, indicating that the exceedances may be unrelated or only partially related to mining operations; however, rates of change in Sr were consistently higher in the postmining period, which indicates additional contributions from mining activities. In contrast, Al and Cu, which had AEMP Action Level 2 exceedances, have been stable or decreasing over the last several decades based on the paleolimnological record. As Al and Cu are potentially toxic to aquatic biota (Brix et al. Citation2017, DeForest et al. Citation2018), these elements should continue to be carefully monitored for potential mining-related impacts in Lac de Gras.
Management implications
An Aquatic Effects Monitoring Program (AEMP) is intended to guide adaptive management strategies to minimize and mitigate any potential adverse effects of project activities (MVLB/GNWT 2019). The design and implementation of an AEMP requires the determination of initial predictions of potential adverse effects, as well as the establishment of acceptable limits of impact (e.g., at what point is action required), in order to determine what data should be collected both before and during project operations (MVLB/GNWT 2019). For remote aquatic ecosystems like Lac de Gras, predetermined “significance thresholds” or “action levels” are often defined as changes that are outside the range of natural variability, or that depart from baseline conditions. Baseline conditions are typically established based on only a few years of predevelopment monitoring, and often only as snapshots from one or a few sampling times, and thus do not provide a holistic understanding of ecosystem functioning, particularly for large northern lakes like Lac de Gras that are historically understudied systems (Cott et al. Citation2016),
An obvious advantage of a paleolimnological approach is the ability to characterize the range of natural variability or baseline conditions prior to monitoring. In situations where AEMP data show clear deviation from natural variability or baseline conditions established from sediment cores, this would provide an early-warning indication of a potential impact of mining to trigger adaptive management strategies. For example, in Lac de Gras, nitrogen isotopic composition clearly deviates from a long-term decreasing trend in sediments deposited in the current mining period, providing compelling evidence that diamond mining activities have altered nitrogen cycling. Our paleolimnological study of Lac de Gras also supports AEMP Action Level 2 exceedences for Al and Cu. In contrast, where anticipated mining impacts are similar to longer term trajectories of limnological change, establishing significance thresholds is more challenging. Based on our paleolimnological data, we recommend the Diavik AEMP review its current significance thresholds and action levels for chlorophyll a and select metals (particularly Sr, Mn, Zn) that we show to be changing since at least 1950 due to climate warming. As an initial step to assist in this process, we calculated background rates of percent change in these geochemical indicators that can be used as a benchmark for evaluating changes that have occurred (or will occur) over the period of aquatic effects monitoring. We recommend that future efforts focus on developing statistical and conceptual approaches that will strengthen our capacity to extrapolate paleolimnological inferences of natural variability to aquatic effects monitoring, within both the context of ongoing AEMP design review in the Northwest Territories, and the application of paleolimnology to lake management more generally.
Acknowledgements
We thank David Wells (Diavik Diamond Mines–Environment) and the Diavik Aquatic Effects Monitoring team for assistance with field work logistics. We also thank Lorraine Brekke and Julian Kanigan, Government of the Northwest Territories (GNWT), for assistance with study design and field work logistics. We thank associate editor Dr. Dorte Koster, Dr. Tammy Karst-Riddoch, and 2 anonymous reviewers for comments that greatly improved the quality of the article.
Additional information
Funding
References
- Appleby PG. 2001. Chronostratigraphic techniques in recent sediments In Last WM, Smol JP, editors. Tracking environmental change using lake sediments volume 1: basin analysis, coring, and chronological techniques. Dordrecht, The Netherlands: Kluwer Academic Publishers. p. 171–204.
- Appleby PG, Oldfield F. 1978. The calculation of lead-210 dates assuming a constant rate of supply of unsupported 210Pb to the sediment. Catena. 5(1):1–8. doi:10.1016/S0341-8162(78)80002-2.
- Bailey BL, Smith LJ, Blowes DW, Ptacek CJ, Smith L, Sego DC. 2013. The Diavik waste rock project: persistence of contaminants from blasting agents in waste rock effluent. App Geochem. 36:256–270. doi:10.1016/j.apgeochem.2012.04.008.
- Baki ABM, Zhu DZ, Hulsman MF, Lunn BD, Tonn WM. 2012. The hydrological characteristics of a stream within an integrated framework of lake–stream connectivity in the Lac de Gras Watershed, Northwest Territories. Can J Civ Eng. 39(3):279–292. doi:10.1139/l11-129.
- Barker AJ, Douglas TA, Jacobson AD, McClelland JW, Ilgen AG, Khosh MS, Lehn GO, Trainor TP. 2014. Late season mobilization of trace metals in two small Alaskan arctic watersheds as a proxy for landscape scale permafrost active layer dynamics. Chem Geol. 381:180–193. doi:10.1139/l11-129
- Battarbee RW, Jones VJ, Flower RJ, Cameron NG, Bennion H, Carvalho L, Juggins S. 2001. Diatoms. Chapter 8. In Smol JP, Birks HJB, Last WM, editors. Tracking environmental change using lake sediments volume 3: Terrestrial, algal, and siliceous indicators. Dordrecht, The Netherlands: Kluwer Academic Publishers. p. 155–202.
- Bindler R, Renberg I, Anderson NJ, Appleby PG, Emteryd O, Boyle J. 2001. Pb isotope ratios of lake sediments in West Greenland: inferences on pollution sources. Atmos Environ. 35(27):4675–4685. doi:10.1016/S1352-2310(01)00115-7.
- Brazeau ML, Poulain AJ, Paterson AM, Keller WB, Sanei H, Blais JM. 2013. Recent changes in mercury deposition and primary productivity inferred from sediments of lakes from the Hudson Bay Lowlands, Ontario, Canada. Environ Pollut. 173:52–60. doi:10.1016/j.envpol.2012.09.017.
- Brix KV, DeForest DK, Tear L, Grosell M, Adams WJ. 2017. Use of multiple linear regression models for setting water quality criteria for copper: a complementary approach to the biotic ligand model. Environ Sci Technol. 51(9):5182–5192. doi:10.1021/acs.est.6b05533.
- Cott PA, Szkokan-Emilson EJ, Savage PL, Hanna BW, Bronte CR, Evans MS. 2016. Large lakes of northern Canada: emerging research in a globally-important fresh water resource. J Great Lakes Res. 42(2):163–165. doi:10.1016/j.jglr.2016.02.003.
- Davison W. 1993. Iron and manganese in lakes. Earth Sci Rev. 34(2):119–163. doi:10.1016/0012-8252(93)90029-7.
- DeForest DK, Brix KV, Tear LM, Adams WJ. 2018. Multiple linear regression models for predicting chronic aluminum toxicity to freshwater aquatic organisms and developing water quality guidelines. Environ Toxicol Chem. 37(1):80–90. doi:10.1002/etc.3922.
- Deton’ Cho Stantec. 2015. Lac de Gras water chemistry, spatial variability, and temporal trends an analysis of “cumulative effects” in Lac de Gras water chemistry over the period of record. Report Prepared for: Government of Northwest Territories Public Works and Service. Project Number: 144901977. Available from. https://www.emab.ca/sites/default/files/cimp_-_report_lacdegras_20150430_fin_-_2015-16_-_stantec.pdf.
- Dredge LA, Kerr DE, Wolfe SA. 1999. Surficial materials and related ground ice conditions, Slave Province, N.W.T. Can J Earth Sci. 36(7):1227–1238. doi:10.1139/e98-087.
- ERM. 2014. Ekati diamond mine: 2014 aquatic effects monitoring program part 2—data report. Prepared for Dominion Diamond Ekati Corporation by ERM Consultants Canada Ltd, Yellowknife, Northwest Territories. Available from. http://reviewboard.ca/upload/project_document/EA1314-01_W2012L2-0001_-_Ekati_-_AEMP_-_2014_Annual_Report_-_Part_2_Data_Report_-_Mar_31_15.PDF.
- ERM. 2018. Ekati diamond mine: 2017 aquatic effects monitoring program - summary report. Prepared for Dominion Diamond Ekati ULC by ERM Consultants Canada Ltd: Yellowknife, Northwest Territories. Available from. http://registry.mvlwb.ca/Documents/W2012L2-0001/W2012L2-0001%20-%20Ekati%20-%202017%20Water%20Licence%20and%20EA%20Annual%20Report%20-%20Apr%2030_18.pdf.
- Fallu M, Allaire N, Pienitz R. 2000. Freshwater diatoms from northern Quebec and Labrador (Canada). Bibliotheca Diatomologia Band 45. Stuttgart: J. Cramer.
- Geological Survey of Canada. 2014. Surficial geology, Lac de Gras, Northwest Territories, NTS 76-D; Geological Survey of Canada, Canadian Geoscience Map 184 (preliminary, Surficial Data Model v. 2.0 conversion of Map 1870A), scale 1:125 000. doi:10.4095/293964.
- Glew JR. 1988. A portable extruding device for close interval sectioning of unconsolidated core samples. J Paleolim. 1:235–239.
- Golder Associates. 2018. Aquatic effects monitoring program 2017 annual report. Prepared for Diavik Diamond Mines (2012) Inc., Doc No. RPT-1665 Ver. 1.0.
- Griffiths K, Michelutti N, Sugar M, Douglas MS, Smol JP. 2017. Ice-cover is the principal driver of ecological change in High Arctic lakes and ponds. PLoS One. 12(3):e0172989. doi:10.1371/journal.pone.0172989.
- Hadley KR, Paterson AM, Rühland KM, White H, Wolfe BB, Keller W, Smol JP. 2019. Biological and geochemical changes in shallow lakes of the Hudson Bay Lowlands: a response to recent warming. J Paleolimnol. 61(3):313–328. doi:10.1007/s10933-018-0061-9.
- Harris D, Horwath WR, van Kessel C. 2001. Acid fumigation of soils to remove carbonates prior to total organic carbon or carbon-13 analysis. Soil Sci Soc Am J. 65(6):1853–1856. doi:10.2136/sssaj2001.1853.
- Heginbottom JA, Dubreuil MA, Harker PA. 1995. Canada-Permafrost. In National Atlas of Canada 5th ed. Ottawa: National Atlas Information Service, Natural Resources Canada, Plate 2.1, MCR 4177.
- Hodell DA, Schelske CL. 1998. Production, sedimentation, and isotopic composition of organic matter in Lake Ontario. Limnol Oceanogr. 43(2):200–214. doi:10.4319/lo.1998.43.2.0200.
- Houben AJ, French TD, Kokelj SV, Wang X, Smol JP, Blais JM. 2016. The impacts of permafrost thaw slump events on limnological variables in upland tundra lakes, Mackenzie Delta region. Fund App Lim. 189(1):11–35. doi:10.1127/fal/2016/0921.
- Hu X, Holubec I, Wonnacott J, Lock R, Olive R. 2003. Geomorphological, geotechnical and geothermal conditions at Diavik Mines. Paper presented at 8th International Conference on Permafrost, Zurich, Switzerland; 18p.
- Krammer K, Lange-Bertalot H. 1986. Bacillariophyceae 1. Teil: Naviculaceae In: Ettel H, Gerloff J, Heynig H, Mollenhauer D, editors. Süßwasserflora von Mitteleuropa 2/1. Berlin: Spektrum Akademischer Verlag.
- Krammer K, Lange-Bertalot H. 1988. Bacillariophyceae 2. Teil: Bacillariaceae, Epithemiacaeae, Surirellaceae In: Ettel H, Gerloff J, Heynig H, Mollenhauer D, editors. Süßwasserflora von Mitteleuropa 2/2. Berlin: Spektrum Akademischer Verlag.
- Krammer K, Lange-Bertalot H. 1991. Bacillariophyceae 4. Teil: Achnanthaceae, Kritische Ergänzungen zu Navicula (Lineolatae) und Gomphonema Gesamtliteraturverzeichnis Teil 1-4 In: Ettel H, Gerloff J, Heynig H, Mollenhauer D, editors. Süßwasserflora von Mitteleuropa 2/4. Berlin, Spektrum Akademischer Verlag.
- Krammer K, Lange-Bertalot H. 2000. Bacillariophyceae 3. Teil: Centrales, Fragilariaceae, Eunotiaceae In: Ettel H, Gerloff J, Heynig H, Mollenhauer D, editors. Süßwasserflora von Mitteleuropa 2/3. Berlin: Spektrum Akademischer Verlag.
- Liu X, Jiang S, Zhang P, Xu L. 2012. Effect of recent climate change on Arctic Pb pollution: a comparative study of historical records in lake and peat sediments. Environ Pollut. 160(1):161–168. doi:10.1016/j.envpol.2011.09.019.
- Malik HI, Warner KA, Saros JE. 2018. Comparison of seasonal distribution patterns of Discostella stelligera and Lindavia bodanica in a boreal lake during two years with differing ice-off timing. Diatom Res. 33(1):1–11. doi:10.1080/0269249X.2018.1464522.
- Mesquita PS, Wrona FJ, Prowse TD. 2010. Effects of retrogressive permafrost thaw slumping on sediment chemistry and submerged macrophytes in Arctic tundra lakes. Freshw Biol. 55(11):2347–2358. doi:10.1111/j.1365-2427.2010.02450.x.
- Meyers PA. 2003. Applications of organic geochemistry to paleolimnological reconstructions: a summary of examples from the Laurentian Great Lakes. Org Geochem. 34(2):261–289. doi:10.1016/S0146-6380(02)00168-7.
- Meyers PA, Teranes JL. 2002. Sediment organic matter In Smol JP, Last WM, editors. Tracking environmental change using lake sediments volume 2: physical and geochemical methods. Dordrecht, The Netherlands: Kluwer Academic Publishers. p. 239–270.
- Michelutti N, Smol JP. 2016. Visible spectroscopy reliably tracks trends in paleo-production. J Paleolimnol. 56(4):253–265. doi:10.1007/s10933-016-9921-3.
- Michelutti N, Wolfe AP, Vinebrooke RD, Rivard B, Briner J. 2005. Recent primary production increases in arctic lakes. Geophys Res Lett. 32:L19715.
- Mullan D, Swindles G, Patterson T, Galloway J, Macumber A, Falck H, Crossley L, Chen J, Pisaric M. 2017. Climate change and the long-term viability of the world’s busiest heavy haul ice road. Theor Appl Climatol. 129(3–4):1089–1108. doi:10.1007/s00704-016-1830-x.
- Paterson AM, Keller W, Rühland KM, Jones FC, Winter JG. 2014. An exploratory survey of summer water chemistry and plankton communities in lakes near the Sutton River, Hudson Bay Lowlands, Ontario, Canada. Arct Antarct Alp Res. 46(1):121–138. doi:10.1657/1938-4246-46.1.121.
- Pella E. 1990. Elemental organic analysis. Instruction Manual for the EA 1110.
- Petrone KC, Jones JB, Hinzman LD, Boone RD. 2006. Seasonal export of carbon, nitrogen, and major solutes from Alaskan catchments with discontinuous permafrost. J Geophys Res. 111:G02020.
- Rescan. 2012. Ekati Diamond Mine: water quality modeling of the koala watershed. Prepared for BHP Billiton Canada Inc. Yellowknife, Northwest Territories: Rescan Environmental Services Ltd.
- Reyes FR, Lougheed VL. 2015. Rapid nutrient release from permafrost thaw in arctic aquatic ecosystems. Arct Antarct Alp Res. 47(1):35–48. doi:10.1657/AAAR0013-099.
- Ritchie JC. 1993. Northern vegetation. In: French HM, Slaymaker O, editors. Canada’s cold environments. Montreal, Canada: McGill-Queen’s University Press; p. 93–116.
- Rollo H, Jamieson H. 2006. Interaction of diamond mine waste and surface water in the Canadian Arctic. Appl Geochem. 21(9):1522–1538. doi:10.1016/j.apgeochem.2006.05.008.
- Rühland K, Smol JP. 2005. Diatom shifts as evidence for recent subarctic warming in a remote tundra lake, NWT, Canada. Palaeogeogr Palaeoclimatol Palaeoecol. 226(1–2):1–16. doi:10.1016/j.palaeo.2005.05.001.
- Rühland KM, Paterson AM, Keller W, Michelutti N, Smol JP. 2013. Global warming triggers the loss of a key Arctic refugium. Proc Biol Sci. 280(1772):20131887. doi:10.1098/rspb.2013.1887.
- Rühland KM, Paterson AM, Smol JP. 2015. Lake diatom responses to warming: reviewing the evidence. J Paleolimnol. 54(1):1–35. doi:10.1007/s10933-015-9837-3.
- Sarkar C, Heaman LM, Pearson DG. 2015. Duration and periodicity of kimberlite volcanic activity in the Lac de Gras kimberlite field, Canada and some recommendations for kimberlite geochronology. Lithos. 218–219:155–166. doi:10.1016/j.lithos.2015.01.017.
- Saros JE, Stone JR, Pederson GT, Slemmons KE, Spanbauer T, Schliep A, Cahl D, Williamson CE, Engstrom DR. 2012. Climate-induced changes in lake ecosystem structure inferred from coupled neo- and paleoecological approaches. Ecology. 93(10):2155–2164. doi:10.1890/11-2218.1.
- Saros JE, Strock KE, McCue J, Hogan E, Anderson NJ. 2014. Response of Cyclotella species to nutrients and incubation depth in Arctic lakes. J Plank Res. 36(2):450–460. doi:10.1093/plankt/fbt126.
- Smol JP, Wolfe AP, Birks HJB, Douglas MSV, Jones VJ, Korhola A, Pienitz R, Rühland K, Sorvari S, Antoniades D, et al. 2005. Climate-driven regime shifts in the biological communities of arctic lakes. Proc Natl Acad Sci USA. 102(12):4397–4402. doi:10.1073/pnas.0500245102.
- St-Gelais NF, Jokela A, Beisner BE. 2018. Limited functional responses of plankton food webs in northern lakes following diamond mining. Can J Fish Aquat Sci. 75(1):26–35. doi:10.1139/cjfas-2016-0418.
- Vandenberg JA, Herrell M, Faithful JW, Snow AM, Lacrampe J, Bieber C, Dayyani S, Chisholm V. 2016. Multiple modeling approach for the aquatic effects assessment of a proposed northern diamond mine development. Mine Water Environ. 35(3):350–368. doi:10.1007/s10230-015-0337-5.
- Vincent WF, Laurion I, Pienitz R, Walter Anthony KM. 2013. Climate impacts on Arctic lake ecosystems. In: Goldman CR, Kumagai M, Robarts RD, editors. Climatic change and global warming of inland waters: impacts and mitigation for ecosystems and societies. West Sussex, UK: Wiley-Blackwell. p. 27–42.
- Wang L, Rioual P, Panizzo VN, Lu H, Gu Z, Chu G, Yang D, Han J, Liu J, Mackay AW. 2012. A 1000-yr record of environmental change in NE China indicated by diatom assemblages from maar lake Erlongwan. Quat Res. 78(1):24–34. doi:10.1016/j.yqres.2012.03.006.
- Wang X, Cui L, Yang S, Xiao J, Ding Z. 2019. Human‐induced changes in Holocene nitrogen cycling in North China: an isotopic perspective from sedimentary pyrogenic material. Geophys Res Lett. 46(9):4599–4608. doi:10.1029/2019GL082306.
- Winder M, Reuter JE, Schladow SG. 2009. Lake warming favours small-sized planktonic diatom species. Proc Biol Sci. 276(1656):427–435. doi:10.1098/rspb.2008.1200.
- Woodward CA, Potito AP, Beilman DW. 2012. Carbon and nitrogen stable isotope ratios in surface sediments from lakes of western Ireland: implications for inferring past lake productivity and nitrogen loading. J Paleolimnol. 47(2):167–184. doi:10.1007/s10933-011-9568-z.
