
 ?Mathematical formulae have been encoded as MathML and are displayed in this HTML version using MathJax in order to improve their display. Uncheck the box to turn MathJax off. This feature requires Javascript. Click on a formula to zoom.
Abstract
Gorney RM, June SG, Stainbrook KM, Smith AJ. 2023. Detections of cyanobacteria harmful algal blooms (cynanoHABs) in New York State, United States (2012–2020). Lake Reserv Manage. 39:21–36.
Patterns in frequency, intensity, and duration of cyanobacteria harmful algal blooms (cyanoHABs) were evaluated in New York State from 2012 to 2020. The dataset included information from formal monitoring efforts, beach closures, and public reports. The total dataset included more than 24,000 records from 655 waterbodies and included cyanoHAB reports from 477 lakes. Nearly half of those lakes (49.6%) had only 1 year in which a cyanoHAB was documented. Less than 1% (6 lakes) had cyanoHABs documented in every year of the study. We noted a significant increase in the number of cyanoHABs reports each year (P < 0.001), but not an overall increase in intensity, based on evaluation of chlorophyll levels in mid-lake samples collected on a routine basis. The analysis indicated that cyanoHABs duration did not lengthen over the study period, based on beach closure data captured on a daily observation basis. This study addresses the limitations of monitoring data for analysis of patterns in cyanoHABs, based on the structure of the programs and frequency of observations. We provide retrospective feedback on the design of monitoring programs to improve future data collection and our ability to evaluate cyanoHABs in a wide range of waterbodies.
Harmful algal blooms in freshwater systems dominated by cyanobacteria (cyanoHABs) can pose public health risks, as well as aesthetic and economic impacts (Dodds et al. Citation2009, Huisman et al. Citation2018). CyanoHABs have led to dog deaths, cases of human illness, and the degradation of water quality (Backer et al. Citation2015, Carmichael and Boyer Citation2016). By several measures, global occurrence of cyanoHABs has increased in recent decades and is becoming a common refrain in most literature on the topic (Ho et al. Citation2019).
Challenges exist in evaluating cyanoHABs over time across diverse monitoring programs, sampling methodologies, and large geographic areas (Graham et al. Citation2008). There have been several examples of long-term cyanoHABs studies from regions such as the northern temperate subarctic (Taranu et al. Citation2015), inland Ohio lakes (Gorham et al. Citation2017), Lake Erie (Ho and Michalak Citation2015, Bertani et al. Citation2017), continental studies of the United States (Loftin et al. Citation2016), Canada (Winter et al. Citation2011, Pick Citation2016), the northeastern United States (Wilkinson et al. Citation2022), and Europe (Mantzouki et al. Citation2018) that show a lack of a clear link to specific causal drivers. These studies indicate the occurrence and duration of cyanoHABs are not neatly linked to external nutrient loading, trophic state, or climatic conditions; rather, the complex interactions of these factors and their impact on the cyanoHABs are still poorly understood (Bertani et al. Citation2017, Huisman et al. Citation2018). Among these studies, there were substantial differences in monitoring program structure and in evaluation methods, so comparing them as a body of literature poses a challenge. When combining multiple datasets that were collected with different goals, or at different frequencies, it is possible to come to contrasting conclusions regarding cyanoHAB intensity, extent, or duration (Ho and Michalak Citation2015, Bertani et al. Citation2017). Bertani et al. (Citation2017) compared several Lake Erie monitoring programs and found substantial variability in interannual bloom size and predictor variables such as meteorological conditions, depending on which program data were considered.
CyanoHAB occurrence has been increasingly studied and reported, while public attention to bright green shoreline scums, driven in part by increased media coverage, has led to increased reporting of cyanoHABs to state agencies or other water management entities. Recent studies indicate that the increasing trends in blooms may not be so straightforward, and there are several landscape-scale studies of both marine and freshwater HABs that show water quality to be improving rather than declining across the landscape (Anderson et al. Citation2021, Hallegraeff et al. Citation2021, Topp et al. Citation2021, Wilkinson et al. Citation2022). Increased reporting and documentation of cyanoHABs in events that garner relatively high levels of public attention may be obfuscating our ability to parse information regarding patterns in occurrence, especially when utilizing datasets that include public reporting (Winter et al. Citation2011, Vaughan et al. Citation2021, Wilkinson et al. Citation2022).
It is likely that several processes associated with increased cyanoHABs occurrence (e.g., anthropogenic eutrophication and/or global climate change; Heisler et al. Citation2008, O’Neil et al. Citation2012, Ho et al. Citation2019, Paerl et al. Citation2020, Wilkinson et al. Citation2022) are underway in our study region; New York State, United States. Although cases of human, animal, and other potential risks related to cyanoHABs have been documented in New York State (Boyer Citation2008, Figgatt et al. Citation2017, Smith et al. Citation2019, Matthews et al. Citation2021), there is limited analysis to date to support the documentation that cyanoHABs have increased statewide. As the first thorough evaluation of a multiyear, statewide cyanoHABs dataset, the primary objective of this study was to (1) evaluate patterns in the frequency, intensity, and duration of cyanoHABs throughout New York State and to explore the differences between trends observed in episodically reported data and in regularly collected monitoring data. Further objectives are addressed in the context of the findings of objective 1, including (2) to consider the limitations of monitoring data for the purposes of trend observations and (3) to evaluate whether patterns are the result of environmental changes or increased public attention. Over the course of the timeframe of this study (2012–2020), adaptations and improvements to several statewide monitoring efforts were made. The reasonings and justifications for those adaptations are discussed in the context of the findings of the study.
Study area
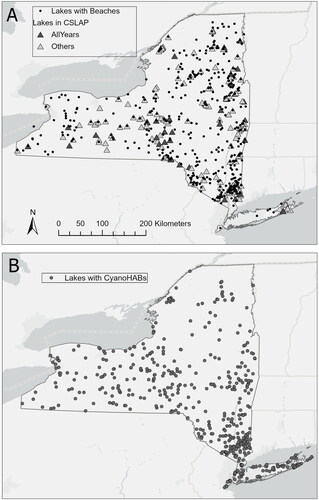
This study addressed cyanoHABs in waterbodies from the state of New York, an area of more than 14 million hectares () with a population of more than 19 million people. New York has nearly 7900 inland lakes and ponds totaling almost 300,000 ha surface area. Lakes in New York range substantially in size and trophic conditions. Most (>70%) are smaller than 2.5 ha, but several are relatively large, with nearly 50 lakes that are >400 ha. Data in this study were limited to freshwater systems and excluded open water portions of Lakes Erie and Ontario. Shoreline observations for the New York shoreline of each were included, such as closures of regulated swimming areas on those lakes. Included in this study were inland lakes, reservoirs, impoundments, ponds, and flowing water systems within New York borders; most data were from ponded waters, considered hereafter in this study as “lakes.”
Figure 1. Map of lake locations within New York, United States. (A) Triangles are locations of lakes that were sampled in the Citizen Statewide Lake Assessment Program (CSLAP). Darker shaded triangles were in the program every year of the study (2012–2020); lighter shaded triangles are all other lakes included in the program at least 1 year. Closed circles represent the location of all lakes with beaches. (B) Circles are lakes with cyanoHABs that met the New York Department of Environmental Conservation (DEC) Bloom Status criteria during the study period. Each circle represents 1 lake, regardless of Bloom Status or recurrence.
Materials and methods
We evaluated a statewide cyanoHABs dataset from 2012 to 2020, that included samples collected through monitoring programs, beach closures related to cyanoHABs, and episodic indications of cyanoHABs supplied by the public. All data points were considered individual records. Most were from a single point in time and addressed an area of shoreline on a lake. A single lake may have had just 1 record throughout the entire data period, or tens per day in the case of large lakes with extensive bloom events. The sources of reports incorporated a wide range of monitoring frequencies, sampling methodologies, and lake characteristics () and were compiled by the New York Department of Environmental Conservation (DEC). To address increased public concern, the DEC, and the New York Department of Health (DOH) had previously expanded cyanoHABs surveillance and monitoring efforts by 2012 (Figgatt et al. Citation2017). Data providers ranged in expertise from water quality professionals to members of the public. Providers included long-standing statewide water quality monitoring programs and smaller localized programs that formed recently because of increased cyanoHAB reports in specific areas, such as the New York City park system, the Finger Lakes region of central New York, and Suffolk County on Long Island (NYSDEC Citation2021a). DEC and DOH have encouraged members of the public to submit cyanoHAB reports through e-mail, reporting forms, printed outreach materials, public events, trainings, and outreach campaigns. Where possible, a digital photo was requested to verify visual observations, especially from reports provided by the public. Over the 2012–2020 timeframe, the structures and goals of the specific monitoring programs were variable (see NYSDEC Citation2021a for a thorough description), but reports and sampling data were evaluated in a uniform manner throughout the study period as described in the following. Reports were generated by beach operators, local health department staff, DEC water quality staff, citizen scientists, and others. Photos and additional cyanoHAB reports submitted by the public were evaluated by DEC or DOH staff. Subsequent site visits to substantiate visual reports with confirmatory sampling were conducted occasionally. For the purposes of this study, reports that were not pelagic cyanoHABs (e.g., marine, benthic, or filamentous green algal blooms) were excluded. Based on how the reports were collected, portions of the complete dataset were selected for specific analyses.
Table 1. Attributes of structured statewide cyanoHABs monitoring programs in New York, United States, 2012–2020. DEC staff oversee most programs; this study includes the analysis of compiled reports from all programs listed. OW: open water samples; SB: shore bloom samples.
We analyzed reports received from waterbodies (mostly lakes) in all parts of New York from 2012 to 2020 for whether a cyanoHAB was present, who provided the reports, and interannual patterns. Our approach compiled reports from many sources in as consistent a manner as possible to evaluate the frequency, intensity, and duration of cyanoHABs in New York. As cyanoHAB reports were received in real time, staff members evaluated and interpreted the reports using DEC’s cyanoHABs Bloom Status criteria to designate a status for each report (). The purpose of the Bloom Status designations (No Bloom, Suspicious, Confirmed, or Confirmed with High Toxins Blooms) was to allow for rapid interpretation and effective communication of cyanoHAB conditions and locations among state agencies and with the public (NYSDEC Citation2021a). The criteria included thresholds that were derived from the previous (1999) World Health Organization (WHO) guidance value framework for probability of health effects resulting from exposure to cyanoHABs and the cyanotoxin microcystin-LR from recreational use of lakes (Chorus and Bartram Citation1999, Watzin et al. Citation2006).
Table 2. Criteria used by DEC in the review of cyanoHAB reports for designation of Bloom Status from 2012 to 2020. Visual evidence may be surveillance reports or photographs. BG Chl is the cyanobacteria channel as measured using the FluoroProbe. Beginning in 2020, the Suspicious status designation was discontinued. DEC designated all reports that previously met the criteria of Suspicious as Confirmed.
Citizen Statewide Lake Assessment Program (CSLAP)
A subset of the reports included in this study were from lakes that were sampled by participants in the Citizen Statewide Lake Assessment Program (CSLAP), which is a volunteer water quality monitoring program managed by DEC scientists. The goal of CSLAP is to collect information representative of New York lakes, ponds, and reservoirs to support public education and outreach, and to gain an understanding of lake conditions to inform lake management plans (Matthews et al. Citation2021). Annually, the number of lakes included in CSLAP ranged from 99 to 154, gradually increasing over the study period. The annual roster of lakes included in the program varied, as CSLAP participation is voluntary, and lake associations joined or left the program at any given time for different reasons. In sum, 213 locations/sites on 185 lakes were sampled for at least 1 year during the study period.
At each lake, a full suite of water quality parameters was collected 8 times per year, between late May and early October, roughly every 2 weeks. Open water (OW) samples were collected according to protocols specified by DEC from an open water mid-lake location, generally located over the deepest part of the lake (NYSDEC Citation2021b). For some larger lakes, multiple OW locations were established. Samples were collected with a Kemmerer bottle submerged 1.5 m below the water surface. For extracted chlorophyll a analysis, a 100 mL sample was vacuum filtered (0.45 µm, mixed cellulose ester) in the field; the filter was initially preserved with MgCO3 and transported to the lab in a foil-covered centrifuge tube. Water samples were analyzed for total phosphorus (TP) and additional water quality parameters using standard methods (NYSDEC Citation2021b). Samples for FluoroProbe (FP; bbe Moldaenke, Schwentinental, Germany) chlorophyll, microscopy, and cyanotoxins (cyanoHABs parameters) were collected in plastic bottles and kept cool for transport to the laboratory. Secchi disk transparency was measured at the time of sampling.
Shoreline cyanoHABs surveys were conducted by CSLAP volunteers at each OW sampling event, or between OW events as observed. If shoreline cyanoHAB accumulations (scums) were observed, the volunteers collected grab samples, known as shoreline bloom (SB) samples. The volunteers were instructed to collect SB samples from the areas of apparent densest accumulation to document “worst case scenario” concentrations of cyanobacteria and cyanotoxins. Samples were collected by skimming the sample bottle along the surface of the water to collect both algal material and water in a plastic sampling container (Graham et al. Citation2008, NYSDEC Citation2021c). Volunteers submitted visual evidence of cyanoHABs if collection of an SB sample was not possible.
SB and OW samples were shipped on ice to the Boyer Laboratory at State University of New York, College of Environmental Sciences and Forestry (Syracuse, NY), for cyanoHABs parameters analysis. Chlorophyll concentration was estimated using the FP, which is an effective measure of algal and cyanobacteria density (Catherine et al. Citation2012). FP measurements provide estimates of chlorophyll concentration based on wavelength-specific excitation of accessory pigments (Beutler et al. Citation2002) for 4 algal classes: chlorophytes, phycocyanin-rich cyanobacteria (bg), diatoms and dinoflagellates, and phycoerythrin-rich cryptophytes and cyanobacteria. The results provide rapid estimates of community composition of various algal groups in lieu of more time-consuming and costly cell counts (Perri et al. Citation2015, Jankowiak et al. Citation2019). The FP bg concentration was used as a proxy for cyanobacterial abundance (bg_chl) for the purposes of interpreting sample results rapidly (Catherine et al. Citation2012). Qualitative microscopic scans were conducted to provide identification of major phytoplankton taxa. A 0.5 mL aliquot was visually scanned (20–40) using an inverted microscope after settling with 50 µL of Lugol’s iodine solution for 10 minutes. Dominant algal taxa were identified to genus level or higher. In 2012 and 2013, microcystin concentration was analyzed using the protein phosphatase inhibition assay (PPIA; An and Carmichael Citation1994). From 2014 to 2020, microcystin concentration was determined using liquid chromatography twin mass spectrometry (LC-MSMS; Boyer Citation2020). To account for interannual variability in monitoring efforts, a subset of the CSLAP data was used for analytical steps described in the following. The AllYears CSLAP (37 lakes) is the set of those lakes that were sampled every year (n = 9) during the study period. The set included a broad range of the physical and chemical characteristics potentially associated with the occurrence of cyanoHABs and in similar range of characteristics to the complete set of CSLAP lakes ().
Table 3. Summary statistics of the morphological and limnological characteristics of the CSLAP lakes. Every CSLAP lake was included in CSLAP for at least 1 year of the study period. AllYears CSLAP lakes were sampled every year of the study period. Trophic classifications (Eut = eutrophic, Meso = mesotrophic, Oligo = oligotrophic) were based on using long-term mean values of SD = Secchi depth, TP = epilimnetic total phosphorus, and Chl = chlorophyll a (Carlson 1977). CyanoHAB = Y indicates number and percent of lakes in each trophic classification that had evidence of a cyanoHAB at any point over the study period.
Regulated bathing beaches
Reports of beach closures, caused by of the presence of cyanoHABs, were compiled by DOH (NYSDOH Citation2021). Here we evaluated the comprehensive record of closures collected from up to 877 permitted beaches on 427 lakes in New York (). The data included were limited to beaches that are permitted by DOH District Offices or local health departments that have jurisdiction in the city or county where the beach is located and are operated in accordance with the State Sanitary Code (SSC) and New York Public Health Law (NYS Citation2011). Operational and permitting records of individual beaches are not available; therefore, the primary permitting period for the recreational season (generally from the holidays of Memorial Day through Labor Day, late May through early September) and daily operation are assumed for all beaches in all years. Swimming beaches are operated by entities such as municipalities, hotel/motels, campgrounds, children’s camps, private clubs, or state park staff. The SSC requirements include qualitative water quality standards for beach operation to protect the public from potential water hazards including cyanoHABs (NYS Citation2011).
DOH developed a cyanoHAB beach closure protocol that was implemented statewide in 2010. While beaches are operational, daily observation of the swim area is required. The protocol uses a visual assessment to initiate beach closure, as it affords a more rapid and protective response than the time and resources required to conduct water sampling and analysis (Figgatt et al. Citation2017). Beaches are reopened when the following criteria are met: The beach is free of a visible bloom for at least 1 day and analysis of a water sample indicates total microcystins toxin levels are below the reopening threshold (for the years 2012–2016: <10 µg/L; beginning in 2017: <4 µg/L; this level was revised based on the US Environmental Protection Agency [USEPA] ambient water quality criteria for microcystins).
Therefore, the dataset comprised estimated loss in recreation days, rounded to a whole day. The total closure, a surrogate measure for cyanoHAB duration, was calculated as the difference between the closure date (initial observation of a cyanoHAB) and the reopening date or annual closure of the facility (whichever came first). Several lakes have multiple beaches that may have been closed and/or reopened independently from one another.
Analyses of frequency, intensity, and duration
We compiled several measures of frequency: the number of lakes designated with each Bloom Status in each year, the total number of reports received annually from all lakes, and the total number of years that each lake had a cyanoHAB of any status (maximum possible = 9 years). A given lake may have several reports that have different statuses in a single year. In that case, the “worst” status was selected to capture that lake for an individual year. All analyses and visualizations were performed in R (R Core Team Citation2021).
Increasing bloom frequency would indicate cyanoHABs are occurring more often, in more years, and in more lakes. Increasing intensity would be indicated by routinely monitored lakes having higher concentrations of chlorophyll or higher proportions of cyanobacteria, suggesting denser cyanoHABs. Increased intensity would indicate a higher likelihood of cyanotoxin presence in concentrations with the potential to cause health effects or limit the recreational use of a lake (Chorus and Welker Citation2021). Finally, duration was evaluated as a measure of whether cyanoHABs were lasting longer. Longer durations of cyanoHABs would lead to reduced recreational use (longer beach closures) and a higher likelihood of negative ecological and economic impacts.
To address the frequency of cyanoHABs, we initially evaluated all cyanoHABs reports compiled by DEC, which allowed for comparison among reports or data providers with and without associated sampling data. Since the receipt of reports of conditions when a cyanoHAB was not present was not consistent among programs and not routinely retained by DEC over time, it was not possible to evaluate a rate of cyanoHAB occurrence over all lakes in the entire dataset. Instead, to correct for the episodic and unpredictable nature of public reporting, we narrowed the data to lakes that were routinely monitored and reported over the study period (37 AllYears CSLAP lakes and the 427 lakes with at least 1 beach present) and limited to those reports that were evaluated and met DEC Bloom Status criteria of a Suspicious or Confirmed cyanoHAB (). We calculated frequency rates as proportion of total number of lakes that had a bloom each year and used the chi-squared test for trend in proportions using the R package “rstatix” (v0.7.0, Kassambara Citation2021) to test for meaningful changes (statistical significance as P < 0.01) over time.
To explain patterns in intensity in cyanoHABs, we utilized OW and SB CSLAP sample findings. The AllYears CSLAP OW samples were collected with a consistent sampling methodology throughout most of the study period (2012–2018). SB samples were collected on an as-observed basis. The intensity measures included total FP chlorophyll concentration (tot_chl), bluegreen channels (bg_chl), and proportion of bluegreen to total chlorophyll (prop_bg)—an indication of relative cyanobacterial abundance. We utilized linear mixed effect models (LMEMs), also known as a mixed-effects analysis of variance (ANOVA), to test for variation in intensity measures explained by year as a categorical variable and each lake included as a random effect to explain each of the intensity measures. Model assumptions were tested by visually examining residual QQ plots and residual vs. predicted plots. Models were fit using the R package “lmerTest” (Kuznetsova et al. Citation2017). Next, we wanted to understand if there was any evidence of a trending change in intensity throughout the study period. The Seasonal Kendall Test (SKT) for trends was used to evaluate consistent or monotonic trends (upward or downward trends) across the AllYears CSLAP OW samples dataset using the R package “EnvStats” (kendallTrendTest with continuity correction, v2.7.0; Millard Citation2013). This nonparametric test does not require an assumption of normality and is useful for sets with multiple sampling points (Helsel and Frans Citation2006). The trend tests are powerful and robust, even when data violate most of the assumptions of parametric statistics, as is often the case when it comes to algal concentration data (Taranu et al. Citation2015).
To describe and evaluate duration trends and address whether cyanoHABs were lasting longer, we needed information regarding the onset and dissipation dates of cyanoHABs. Most cyanoHAB monitoring programs do not have this level of temporal resolution (Hardy et al. Citation2021, Vaughan et al. Citation2021). We utilized the DOH beach closure duration as a proxy for cyanoHABs duration, as most facilities did include daily observations throughout the recreation season, especially during a cyanoHAB closure. Duration was standardized among lakes as number of days between beach closure and reopening, rounded to the whole day. We used LMEMs to test for changes in duration over time (year), as they allowed us to use individual lake as a random effect and year as a continuous predictor.
Results
The findings regarding frequency were multifaceted. More than 24,000 sampling and visual report records were compiled for this study from a wide range of monitoring and reporting programs, focused on both water quality and cyanoHABs (). The observation frequency of reports ranged (daily, weekly, biweekly, monthly, or episodic) depending on local organizational capacity and public interest. For some lakes, reports were received on a scheduled basis, but for others the reporting was sporadic or only in response to cyanoHAB occurrence. Among the reports received by DEC from 627 lakes, 477 lakes (72.8%) had at least 1 report that met DEC cyanoHAB criteria and was designated with a Bloom Status ( and ). The characteristics of lakes with cyanoHABs varied substantially in surface area (from <1 to >17,300 ha) and watershed characteristics (from relatively natural to highly developed land use). In many instances, water quality information was not readily available if the lake was not included in a water quality monitoring program; this was often the case for lakes associated with public reports. The total number of episodic reports that were provided by the public (not part of a planned monitoring program) grew substantially in 2019 and 2020, when an online platform for reporting cyanoHAB reports was launched by DEC (prior to 2019: mean of 38 reports annually, maximum 52, minimum 22; for 2019 and 2020, mean of 210 reports, with 197 in 2019, 223 in 2020).
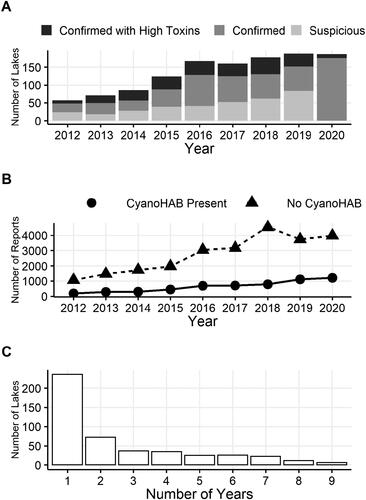
The number of lakes annually that met the DEC Bloom Status criteria of Suspicious, Confirmed, or Confirmed with High Toxins Blooms increased on an annual basis from 2012 through 2016, but in 2016–2020 leveled off to within 10% of the previous year annually (). The increases in the number of lakes documented with cyanoHABs and total number of reports over the study period () was in part related to expansions of several cyanoHAB-focused monitoring programs and increased efforts to encourage lake users to submit visual reports. Nearly half (49.6%) of the lakes included had a documented cyanoHAB in only 1 year (). Most of those lakes were from public reports rather than from existing or expanded monitoring programs. Less than 1% (6 lakes) had confirmed cyanoHABs occur every single year from 2012 to 2020.
Figure 2. (A) Summary of total number of waterbodies with reported cyanoHABs each year from 2012 to 2020, with breakdown by DEC Bloom Status. The use of Suspicious status was discontinued after 2019—all reports with credible visual evidence of a CyanoHAB were designated as Confirmed. (B) Total number of cyanoHAB reports received by DEC each year. (C) Number of years in which cyanoHABs have recurred within each individual waterbody in the statewide dataset.
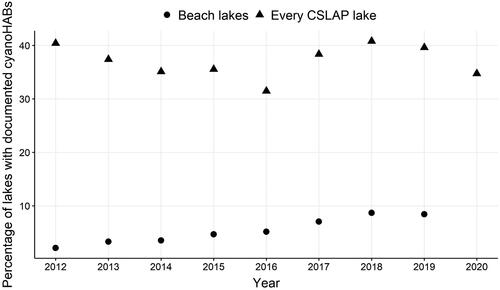
The frequency of cyanoHABs, indicated as the proportion of total number of lakes that had a cyanoHAB each year, was evaluated for 2 datasets: all lakes with beaches, and every lake that was sampled as part of CSLAP (). It should be noted that there was some overlap in the 2 datasets; 71 of the 185 CSLAP lakes had at least 1 beach, and of those, 28 (15% of CSLAP lakes) had at least 1 closure. The proportion of lakes with beaches that had cyanoHABs increased significantly (chi-squared test for trend in proportions: χ2 = 27.06, df = 1, P < 0.001), but the proportion of CSLAP lakes with cyanoHABs did not vary across years (χ 2 = 0.144, df = 1, P = 0.7042).
Figure 3. Proportions (as percentage) of total number of evaluated lakes that were documented with cyanoHABs each year in 2 monitoring programs in New York: lakes with beaches (circles) and every CSLAP lake (triangles). In 2020, many beach facilities did not open because of the COVID-19 pandemic; the total number of open facilities was not known, so an accurate proportion could not be calculated, and the data were eliminated as an outlier year.
The evaluation of cyanoHABs intensity in New York required a consistently collected dataset. In the AllYears CSLAP lakes datasets, there were few gaps in sample collection, which allowed for robust evaluation of intensity trends over time. CyanoHAB surface scum sample results present challenges to data standardization; therefore, SB samples results should be considered less indicative of changes in trends and the data were not evaluated in the same manner. The evaluation of trends in OW cyanoHAB intensity in the chlorophyll metrics (bg_chl and total) did not indicate any significant differences among years; however, this was not the case for proportion of cyanobacteria (measured as bluegreen using the FluoroProbe, LMEMs, ). The interannual variation is inconsistent, with no clear trend, neither increasing nor decreasing over the study period (). The SKT analysis based on monthly averages in the AllYears lakes indicated a decreasing (as indicated by the negative tau values) but nonsignificant change in total, bg_chl, and prop_bg over the 9 yr period ().
Figure 4. Intensity trends in chlorophyll (µg/L) as measured using FluoroProbe within the growing season: (A) bluegreen chlorophyll (BG Chl) in the AllYears CSLAP OW samples; (B) relative proportion of bluegreen chlorophyll in the AllYears CSLAP OW samples; (C) bluegreen chlorophyll (BG Chl) in the AllYears CSLAP SB samples; (D) relative proportion of bluegreen chlorophyll in the AllYears CSLAP SB samples.
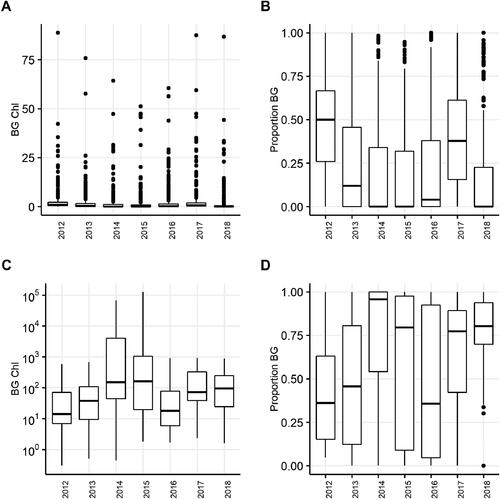
Table 4. Summary statistics of the linear mixed effect models (LMEM) testing for variation in intensity measures explained by year with each lake included as a random effect and seasonal Kendall test (SKT) intensity trend tests utilizing CSLAP AllYears data: 2407 open water (OW) samples.
The total number of cyanoHABs beach closure days (4968) occurred among 705 closures at 142 beaches on 81 lakes. Although the frequency measures (number of lakes, number of closures, number of beaches) all increased throughout the study period, the average duration of the closures (8.10 d; SD = 9.05) and annual median (range 3–7) did not increase ( and ). The results of the linear mixed effects model showed a significant change in the number of lost beach days by year (P < 0.001).
Figure 5. Summary of beach closure days during the study period, shown as box and whiskers plots, with gray points indicating average lost beach days per lake annually, and gray density distribution (right of boxplots) showing the distribution of data points. Some lakes had multiple beaches that may have closed or reopened independently of one another.
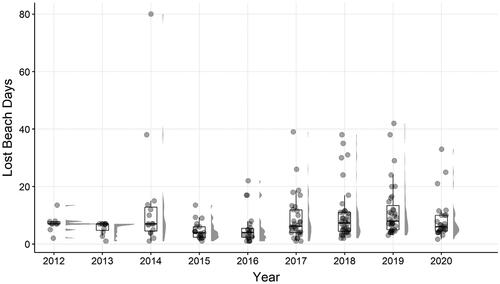
The number of closures, the number of lakes with beaches that closed, and the number of beaches impacted each year increased steadily from 2012 to 2018 before showing declines in 2019 and 2020. As a result of the COVID-19 pandemic, many beaches did not open at all or had reduced recreational use in 2020 compared to other years. All 3 measures increased in 2021, back to levels comparable to 2019 (NYSDOH Citation2021). The average beach closure length had no consistent pattern of increase or decrease over the years (). Of all the lakes that had any beach closures, 35% (28 lakes) had a single closure at 1 beach, in a single year. Twenty-one lakes had closures at multiple beaches, often in multiple years. If the dataset is restricted to those lakes, average closure length did not change substantially (7.63 d). The lake with the highest total number of closures (59) and second highest total number of days closed (496) had closures every year at up to 5 beaches (Lake Carmel, Kent, NY, surface area 81 ha). One of the highest average lengths of closure (38 d) occurred in 2014 at a lake with lengthy closures at 2 beaches related to a lakewide cyanoHAB event (Sleepy Hollow Lake, Athens, NY).
Table 5. Summary statistics of cyanoHABs beach closures in NY. Day closed: total number of days that all beaches were closed; Avg. closure length: average of all closures across all beaches; SD: standard deviation of average annual closure length. N Closures = total number of times beaches closures occurred; N Lakes = total number of lakes that had at least 1 closure; N Beaches = total number of individual beaches, as several lakes have multiple beaches (see also NYSDOH Citation2021).
Discussion
The cyanoHABs dataset compiled by DEC included reports from multiple monitoring efforts, beach closures compiled by DOH, and public reporting of cyanoHABs from hundreds of locations across New York State (). DEC has built and maintains a cyanoHABs reporting and monitoring network that is a patchwork of ambient water quality and cyanoHABs-specific programs (). Few other US states have a comprehensive cyanoHABs dataset that spans multiple years and the breadth of waterbody types, and extends across such a large and diverse geographic area. Analysis of this dataset provides insight into the patterns of cyanoHABs occurrence and insight on the limitations that monitoring program structures have in the interpretation of the data.
We found that the perceived frequency, intensity, and duration of cyanoHABS varied among the monitoring datasets. There was an increase overall in the number of lakes with reported cyanoHABs from 2012 to 2016, whereas numbers stabilized from 2017 to 2020 (). However, the cumulative number of unique lakes with at least 1 cyanoHAB report has grown annually, by 20–30 lakes per year (Gorney RM, DEC, 2022, unpubl. data). Data from the most consistently monitored lakes (CSLAP lakes and lakes with beaches) did not clearly show whether cyanoHABs are becoming more frequent (). Our findings did not suggest that cyanoHABs are becoming overall more intense () or longer in duration (). These conclusions are comparable to other recent large-scale studies of global and regional patterns in marine HABs and cyanoHABs over time (Hallegraeff et al. Citation2021, Wilkinson et al. Citation2022). These studies and our findings indicate that overall, trends in cyanoHABs are overshadowed by public attention and reflect increased reporting, not necessarily increased cyanoHAB presence. Several likely interacting causal factors are involved, including climate change, anthropomorphic eutrophication, and increased public awareness. The use of standardized monitoring methods such as routine CSLAP sampling, the DEC Bloom Status criteria, a multimetric index used in coastal Maine (Anderson et al. Citation2021), or forecasting models developed for Lake Erie (Davis et al. Citation2019), are examples of strategies to standardize information about cyanoHABs across many sources without bias by increased public attention or episodic reporting. Even with the multitude of cyanoHAB monitoring and reporting programs in New York (), our findings indicate that the current breadth of the monitoring may not be reflective of the true frequency of cyanoHABs in New York.
Trends are best evaluated with consistent, long-term datasets. In this case, the 9 yr dataset may be too short to come to strong conclusions, and this study highlights the challenges of trying to integrate and analyze data that have been collected inconsistently and episodically. Over the last decade, cyanoHAB reporting programs in New York have continued to expand, increasing the number of lakes from which DEC routinely received reports, as well as the total annual number of reports ().
Coordination and resources (staff and funding) to support cyanoHABs monitoring are required to build regional long-term datasets at a state or territory level. Currently, only a few states have formal cyanoHABs programs that report to a single entity, such as DEC in New York (Hardy et al. Citation2021). Streamlining data collection and reporting through a single entity enhances the ability of managers to evaluate and communicate cyanoHAB occurrence.
During the initial years of the New York program, it was advantageous to conduct exploratory and expansive sampling in an opportunistic manner. This led to a dataset skewed toward locations with public access, high public interest, and persistent cyanoHABs. DEC and DOH worked to increase public awareness of cyanoHABs through brochures, public meetings, training staff members at local health departments and lake associations, agency webpages, and an interactive Web-based map of current cyanoHAB report locations throughout the summer. These methods have been successful in other states as well (Hardy et al. Citation2021, Vaughan et al. Citation2021). The New York cyanoHABs program is based on visual reports; this approach is conservative, protective of public health, and not toxin focused. Beginning in 2020, the Suspicious status designation was discontinued in tandem with a planned reduction in the amount of sampling events and the unplanned COVID-19 pandemic, which limited the ability of samplers to achieve planned objectives. Since 2020, visual reports of cyanoHABs are now considered Confirmed Blooms, in addition to those reports that include sampling data that can be compared to the quantitative status criteria (). The use of visual reports to document the occurrence of a cyanoHAB allows for rapid communication of health risks, rather than waiting for testing results. The issuance of notifications is not constrained by the need to conduct site visits or to collect, transport, and analyze samples.
The findings documented here have contributed to changes in the structure of DEC water quality monitoring programs away from somewhat haphazard surface scum grab (SB) sample collection, primarily focusing on visual reporting. This shift has reduced overall resources needed to maintain DEC’s program and the public’s focus on raw data, such as elevated toxin concentrations, that may range across several orders of magnitude or take several days to be analyzed at a lab. Currently, DEC cyanoHAB monitoring and sampling efforts are tied to concurrent nutrient sampling and/or formal research studies.
Nationally, cyanoHAB monitoring programs have expanded substantially in the last 2 decades, and the goal of this study was to provide insight from 1 large state that has devoted substantial effort in that timeframe. In 2009, Graham et al. (Citation2009) summarized US state-level cyanoHAB plans, monitoring frequencies, types of analyses completed, and guidance and/or action levels. The few plans in place at that time largely utilized guidance and/or action levels based on individual states’ interpretation of the World Health Organization (WHO) framework, because of a lack of uniform federal guidance regarding appropriate levels (Watzin et al. Citation2006). The resulting criteria varied widely among US states, cyanoHAB indicators, and toxins. More than a decade after that study was published, there continues to be a patchwork nature of programmatic structures, sampling methodology, and thresholds throughout the country (Hardy et al. Citation2021), and as an example, no other state has the same guidelines or program stuctures as New York.
The USEPA has issued thresholds for drinking water and recreational contact with certain cyanotoxins; however, guidance and action levels among states remain inconsistent. This variability impacts how cyanoHABs are monitored or documented (Ho and Michalak 2015), how public health responses are structured (Metcalf et al. Citation2018), and how the data may potentially be used for assessments and management (Davis et al. Citation2019). While formal monitoring and surveillance programs are crucial to understanding the magnitude, duration, and extent of cyanoHABs (Brooks et al. Citation2016, Bertani et al. Citation2017), comparability across state lines will remain challenging if states have vastly different approaches (Srivastava et al. Citation2013). Advances in interpretation of satellite imagery show these methods can supplement ground-based monitoring efforts (Bertani et al. Citation2017, Ho et al. Citation2019). However, there remain limits to lake size that can be adequately resolved in spectral evaluation of satellite imagery (Srivastava et al. Citation2013). In this study, 26% of the 477 lakes in the statewide dataset were below 0.8 ha in surface area, were of unknown size, or were characterized as flowing water systems.
We have found that increased awareness of cyanoHABs leads to a greater interest in the development of and participation in cyanoHABs monitoring programs and greater reporting of cyanoHAB events by the public. The evaluation of cyanoHABs monitoring data from Vermont has shown that volunteer scientists can execute a program effectively and can supplement professional monitoring and episodic public reporting (Vaughan et al. Citation2021).
Landscape-level comparisons of many lakes can allow for powerful conclusions, more so than single lake or manipulative-type studies (Rigosi et al. Citation2015). To date, few studies have conducted an evaluation of cyanoHABs occurrence in a high quantity of lakes of varying sizes and trophic levels over several years. Increased awareness, anthropogenic eutrophication, the impacts of global climate change, and the impacts of invasive species are all hypothesized drivers for the observed increases in cyanoHABs (Ho and Michalak Citation2015, Pick Citation2016). Researchers have sought to evaluate several of the drivers separately or in tandem and these studies are ongoing. Testing these hypotheses requires forming and answering seemingly fundamental questions related to cyanoHABs before approaching the more complex challenges such as the modeling, prediction, or control of cyanoHABs (Graham et al. Citation2008, Ho and Michalak Citation2015). Our study evaluated the use of several statewide monitoring datasets to answer such questions and suggests guidance for states looking to expand monitoring to better characterize cyanoHABs.
Outreach, education, and event-based monitoring that is often warranted to alleviate public concerns tend to be implemented rapidly, in response to a particular bloom occurrence (Hardy et al. Citation2021). Public perceptions of health risks may not always accurately reflect conditions on the ground or the likelihood of contact (for example, cyanoHABs in October do not pose the same recreational risk as those in July). Managers must balance potential misinformation with the benefits of attention to water quality issues and should proactively plan how to harness public and political interest in a lake, which may lead to remediation action. Following an event with extensive media attention, a proliferation of local actions may occur, such as expanded nutrient reduction strategies, development of watershed management plans, mitigation or control pilot studies, changes to drinking water treatment strategies, and the expansion of cyanoHABs monitoring and prediction programs. In New York, combinations of all of these actions have occurred at cyanoHABs-impacted lakes with increasing frequency over the last few years. The sum of this cycle of increased attention, enhanced detection, and expanded efforts to reduce occurrence further obfuscates trends when considering findings from multiple monitoring programs.
Randomized site selection protocols are a tool that allows for objective site selection, as compared to regionally based citizen science programs or other monitoring programs focused on individual cyanoHAB-impacted lakes. The latter tend to self-select to include, or even focus on, lakes or specific locations that are more likely to be impacted by cyanoHABs on a recurring basis. Consistency among years and across lakes within a region is key; differences in monitoring approaches can lead to discrepancies in the relative importance, extent, or intensity of events when they are later compared to one another (Bertani et al. Citation2017). Findings from the USEPA National Lakes Assessments (NLA) provide a strong indication that cyanoHABs are becoming more widespread across a range of trophic conditions (Loftin et al. Citation2016). Percent frequencies of cyanoHABs or cyanotoxin occurrence across the landscape increased in NLA sites (Mantzouki et al. Citation2018). A randomized design controls for how public reporting may skew the findings. As a result of the findings of this study and others, beginning in 2021, DEC has incorporated a random probabilistic design for site selection in the state-run ambient lake monitoring program, and initial results indicate no widespread indication of cyanoHABs or cyanotoxins in most lakes (Gorney RM, DEC, 2022, unpubl. data).
Conclusions
Wherever or whenever possible, regional cyanoHAB monitoring programs should be designed to be consistent over years. Site selection should be expanded to capture the full range of water quality conditions and not exclusively focus on the most impacted lakes. An intentional and well-designed monitoring program will help to document cyanoHAB patterns. High temporal and/or spatial resolution data are valuable to understand some of the crucial cyanoHABs unknowns, such as bloom duration, toxin degradation rates, genetic heterogeneity of cyanobacteria, and efficacy of mitigation efforts. Ideally, a new or expanding cyanoHABs-focused monitoring program should attempt to include locations with a wide range of trophic conditions and support the collection of long-term datasets that are sampled and analyzed using a consistent methodology at set intervals over time.
Author contribution statement
RMG drafted the manuscript and ran all the statistical analyses. SGJ coordinated sampling through CSLAP 2018–2020. All authors edited the manuscript and approved the final article.
Acknowledgments
We acknowledge the hard work of, and ongoing collaboration with, our colleagues at the New York State (NYS) Department of Health and NYS Offices of Parks, Recreation and Historic Preservation. We thank those associated with CSLAP and the NYS Federation of Lake Associations, including Scott Kishbaugh, Nancy Mueller, and numerous CSLAP volunteers. Many results included here were generated by our collaborators: Christopher Gobler, Jennifer Jankowiak, and others from Stony Brook University; Gregory Boyer, Dominique Derminio, and others from SUNY ESF; and Dave Matthews, MaryGail Perkins, Gina Kehoe, and others at the Upstate Freshwater Institute. Our ongoing partnerships with the NYC Department of Parks and Recreation and several individual lake associations are crucial to document and communicate cyanoHAB occurrence in New York State. This work was supported by funds from the NYS Environmental Protection Fund.
Correction Statement
This article has been republished with minor changes. These changes do not impact the academic content of the article.
Additional information
Funding
References
- An J, Carmichael WW. 1994. Use of a colorimetric protein phosphatase inhibition assay and enzyme linked immunosorbent assay for the study of microcystins and nodularins. Toxicon. 32(12):1495–1507. doi:10.1016/0041-0101(94)90308-5.
- Anderson DM, Fensin E, Gobler CJ, Hoeglund AE, Hubbard KA, Kulis DM, Landsberg JH, Lefebvre KA, Provoost P, Richlen ML, et al. 2021. Marine harmful algal blooms (HABs) in the United States: history, current status and future trends. Harmful Algae. 102:101975. doi:10.1016/j.hal.2021.101975.
- Backer L, Manassaram-Baptiste D, LePrell R, Bolton B. 2015. Cyanobacteria and algae blooms: review of health and environmental data from the Harmful Algal Bloom-Related Illness Surveillance System (HABISS) 2007–2011. Toxins (Basel). 7(4):1048–1064. doi:10.3390/toxins7041048.
- Bertani I, Steger CE, Obenour DR, Fahnenstiel GL, Bridgeman TB, Johengen TH, Sayers MJ, Shuchman RA, Scavia D. 2017. Tracking cyanobacteria blooms: do different monitoring approaches tell the same story? Sci Total Environ. 575:294–308. doi:10.1016/j.scitotenv.2016.10.023.
- Beutler M, Wiltshire KH, Meyer B, Moldaenke C, Lüring C, Meyerhöfer M, Hansen UP, Dau H. 2002. A fluorometric method for the differentiation of algal populations in vivo and in situ. Photosynthesis research. 72(1):39–53.
- Boyer GL. 2008. Cyanobacterial toxins in New York and the lower Great Lakes ecosystems. In Cyanobacterial harmful algal blooms: state of the science and research needs. Springer. New York, NY. pp. 153–165.
- Boyer GL. 2020. LCMS-SOP determination of microcystins in water samples by high performance liquid chromatography (HPLC) with single quadrupole mass spectrometry (MS). Limnol. Oceanogr. doi:10.17504/protocols.io.bck2iuye
- Brooks BW, Lazorchak JM, Howard MD, Johnson MV, Morton SL, Perkins DA, Reavie ED, Scott GI, Smith SA, Steevens JA. 2016. Are harmful algal blooms becoming the greatest inland water quality threat to public health and aquatic ecosystems? Environ Toxicol Chem. 35(1):6–13. doi:10.1002/etc.3220.
- Carmichael WW, Boyer GL. 2016. Health impacts from cyanobacteria harmful algae blooms: implications for the North American Great Lakes. Harmful Algae. 54:194–212. doi:10.1016/j.hal.2016.02.002.
- Catherine A, Escoffier N, Belhocine A, Nasri A, Hamlaoui S, Yéprémian C, Bernard C, Troussellier M. 2012. On the use of the FluoroProbe®, a phytoplankton quantification method based on fluorescence excitation spectra for large-scale surveys of lakes and reservoirs. Water Res. 46(6):1771–1784. doi:10.1016/j.watres.2011.12.056.
- Chorus I, Bartram J. 1999. Toxic cyanobacteria in water: a guide to their public health consequences, monitoring and management. CRC Press.
- Chorus I, Welker M. 2021. Toxic cyanobacteria in water: a guide to their public health consequences, monitoring and management. 2nd ed. CRC Press.
- Davis TW, Stumpf R, Bullerjahn GS, McKay RML, Chaffin JD, Bridgeman TB, Winslow C. 2019. Science meets policy: a framework for determining impairment designation criteria for large waterbodies affected by cyanobacterial harmful algal blooms. Harmful Algae. 81:59–64. doi:10.1016/j.hal.2018.11.016.
- Dodds WK, Bouska WW, Eitzmann JL, Pilger TJ, Pitts KL, Riley AJ, Schloesser JT, Thornbrugh DJ. 2009. Eutrophication of US freshwaters: analysis of potential economic damages. Environ Sci Technol. 43(1):12–19. doi:10.1021/es801217q.
- Figgatt M, Hyde J, Dziewulski D, Wiegert E, Kishbaugh S, Zelin G, Wilson L. 2017. Harmful algal bloom–associated illnesses in humans and dogs identified through a pilot surveillance system—New York, 2015. MMWR Morb Mortal Wkly Rep. 66(43):1182–1184. doi:10.15585/mmwr.mm6643a5.
- Gorham T, Jia Y, Shum C, Lee J. 2017. Ten-year survey of cyanobacterial blooms in Ohio’s waterbodies using satellite remote sensing. Harmful Algae. 66:13–19. doi:10.1016/j.hal.2017.04.013.
- Graham JL, Loftin KA, Kamman N. 2009. Monitoring recreational freshwaters. Lakeline 29:18–24.
- Graham JL, Loftin KA, Ziegler AC, Meyer MT. 2008. Guidelines for design and sampling for cyanobacterial toxin and taste-and-odor studies in lakes and reservoirs. U.S. Geological Survey.
- Hallegraeff GM, Anderson DM, Belin C, Bottein M-YD, Bresnan E, Chinain M, Enevoldsen H, Iwataki M, Karlson B, McKenzie CH, et al. 2021. Perceived global increase in algal blooms is attributable to intensified monitoring and emerging bloom impacts. Commun Earth Environ. 2(1):1–10. doi:10.1038/s43247-021-00178-8.
- Hardy FJ, Preece E, Backer L. 2021. Status of state cyanoHAB outreach and monitoring efforts, United States. Lake Reservoir Manage. 37(3):246–260.
- Heisler J, Glibert P, Burkholder J, Anderson D, Cochlan W, Dennison W, Gobler C, Dortch Q, Heil C, Humphries E, et al. 2008. Eutrophication and harmful algal blooms: a scientific consensus. Harmful Algae. 8(1):3–13. doi:10.1016/j.hal.2008.08.006.
- Helsel DR, Frans LM. 2006. Regional Kendall test for trend. Environ Sci Technol. 40(13):4066–4073. doi:10.1021/es051650b.
- Ho JC, Michalak AM. 2015. Challenges in tracking harmful algal blooms: a synthesis of evidence from Lake Erie. J Great Lakes Res. 41(2):317–325. doi:10.1016/j.jglr.2015.01.001.
- Ho JC, Michalak AM, Pahlevan N. 2019. Widespread global increase in intense lake phytoplankton blooms since the 1980s. Nature 574(7780):667–670. doi:10.1038/s41586-019-1648-7.
- Huisman J, Codd GA, Paerl HW, Ibelings BW, Verspagen JMH, Visser PM. 2018. Cyanobacterial blooms. Nat Rev Microbiol. 16(8):471–483. doi:10.1038/s41579-018-0040-1.
- Jankowiak J, Hattenrath‐Lehmann T, Kramer BJ, Ladds M, Gobler CJ. 2019. Deciphering the effects of nitrogen, phosphorus, and temperature on cyanobacterial bloom intensification, diversity, and toxicity in western Lake Erie. Limnol Oceanogr. 64(3):1347–1370. doi:10.1002/lno.11120.
- Kassambara A. 2021. rstatix: pipe-friendly framework for basic statistical tests. R package version 0.7.0. Available from: https://CRAN.R-project.org/package=rstatix.
- Kuznetsova A, Brockhoff PB, Christensen RHB. 2017. lmerTest package: tests in linear mixed effects models. J Stat Soft. 82 (13):1–26. Available from: doi:10.18637/jss.v082.i13.
- Loftin KA, Graham JL, Hilborn ED, Lehmann SC, Meyer MT, Dietze JE, Griffith CB. 2016. Cyanotoxins in inland lakes of the United States: occurrence and potential recreational health risks in the EPA National Lakes Assessment 2007. Harmful Algae. 56:77–90. doi:10.1016/j.hal.2016.04.001.
- Mantzouki E, Lürling M, Fastner J, De Senerpont Domis L, Wilk-Woźniak E, Koreivienė J, Seelen L, Teurlincx S, Verstijnen Y, Krztoń W, et al. 2018. Temperature effects explain continental scale distribution of cyanobacterial toxins. Toxins 10(4):156. doi:10.3390/toxins10040156.
- Matthews D, Matt M, Mueller N, Jun S. 2021. Citizen science advances the understanding of CyanoHABs in New York State Lakes. Lakeline 41(2):34–38.
- Metcalf JS, Banack SA, Powell JT, Tymm FJ, Murch SJ, Brand LE, Cox PA. 2018. Public health responses to toxic cyanobacterial blooms: perspectives from the 2016 Florida event. Water Policy. 20(5):919–932. doi:10.2166/wp.2018.012.
- Millard SP. 2013. EnvStats: an R package for environmental statistics. New York (NY): Springer. Available from: https://www.springer.com>.
- [NYS]. New York State. 2011. New York Codes, Rules and Regulations VOLUME A (Title 10) Part 6 - Swimming Pools, Bathing Beaches and Recreational Aquatic Spray Grounds Title: SubPart 6-2 - Bathing Beaches; [cited 16 Dec 2022]. Available from https://regs.health.ny.gov/content/subpart-6-2-bathing-beaches.
- [NYSDEC]. New York State Department of Environmental Conservation. 2021a. Harmful algal bloom program guide, version 3. Albany (NY): New York State Department of Environmental Conservation.
- NYSDEC. 2021b. Quality assurance management plan for the New York Citizens Statewide Lake Assessment Program (CSLAP). Albany (NY): New York State Department of Environmental Conservation.
- NYSDEC. 2021c. Standard operating procedure: harmful algal blooms sampling and analysis. Albany (NY): New York State Department of Environmental Conservation.
- [NYSDOH] New York State Department of Health. 2021. Harmful blue-green algae bloom beach trends: 2009-2021 trends; [cited 30 Aug 2022]. Available from https://www.health.ny.gov/environmental/water/drinking/bluegreenalgae/beachsurveillance.htm.
- O’Neil JM, Davis TW, Burford MA, Gobler CJ. 2012. The rise of harmful cyanobacteria blooms: the potential roles of eutrophication and climate change. Harmful Algae. 14:313–334. doi:10.1016/j.hal.2011.10.027.
- Paerl HW, Havens KE, Hall NS, Otten TG, Zhu M, Xu H, Zhu G, Qin B. 2020. Mitigating a global expansion of toxic cyanobacterial blooms: confounding effects and challenges posed by climate change. Mar Freshwater Res. 71(5):579–592. doi:10.1071/MF18392.
- Perri KA, Sullivan JM, Boyer GL. 2015. Harmful algal blooms in Sodus Bay, Lake Ontario: a comparison of nutrients, marina presence, and cyanobacterial toxins. J Great Lakes Res. 41(2):326–337. doi:10.1016/j.jglr.2015.03.022.
- Pick FR. 2016. Blooming algae: a Canadian perspective on the rise of toxic cyanobacteria. Can J Fish Aquat Sci. 73(7):1149–1158. doi:10.1139/cjfas-2015-0470.
- R Core Team. 2021. R: a language and environment for statistical computing. R Foundation for Statistical Computing. Vienna, Austria. Available from https://www.R-project.org/.
- Rigosi A, Hanson P, Hamilton DP, Hipsey M, Rusak JA, Bois J, Sparber K, Chorus I, Watkinson AJ, Qin B, et al. 2015. Determining the probability of cyanobacterial blooms: the application of Bayesian networks in multiple lake systems. Ecol Appl. 25(1):186–199. doi:10.1890/13-1677.1.
- Smith ZJ, Martin RM, Wei B, Wilhelm SW, Boyer GL. 2019. Spatial and temporal variation in paralytic shellfish toxin production by benthic Microseira (Lyngbya) wollei in a freshwater New York lake. Toxins 11(1):44. doi:10.3390/toxins11010044.
- Srivastava A, Singh S, Ahn C-Y, Oh H-M, Asthana RK. 2013. Monitoring approaches for a toxic cyanobacterial bloom. Environ Sci Technol. 47(16):8999–9013. doi:10.1021/es401245k.
- Taranu ZE, Gregory-Eaves I, Leavitt PR, Bunting L, Buchaca T, Catalan J, Domaizon I, Guilizzoni P, Lami A, McGowan S, et al. 2015. Acceleration of cyanobacterial dominance in north temperate‐subarctic lakes during the Anthropocene. Ecol Lett. 18(4):375–384. doi:10.1111/ele.12420.
- Topp SN, Pavelsky TM, Stanley EH, Yang X, Griffin CG, Ross MRV. 2021. Multi-decadal improvement in US lake water clarity. Environ Res Lett.16(5):055025 10.1088/1748-9326/abf002.
- Vaughan MCH, Campbell MK, Fisher L, O’Brien B, Gorney RM, Shambaugh A, Sopher LS, Pierson O, Howe EA. 2021. Lake Champlain community scientist volunteer network communicates critical cyanobacteria information to region-wide stakeholders. Contemp Water Res. 174(1):6–20. doi:10.1111/j.1936-704X.2021.3358.x.
- Watzin MC, Miller EB, Shambaugh AD, Kreider MA. 2006. Application of the WHO alert level framework to cyanobacterial monitoring of Lake Champlain, Vermont. Environ Toxicol. 21(3):278–288. doi:10.1002/tox.20181.
- Wilkinson G, Walter JA, Buelo C, Pace M. 2022. No evidence of widespread algal bloom intensification in hundreds of lakes. Front Ecol Environ. 20(1):16–21. doi:10.1002/fee.2421.
- Winter JG, DeSellas AM, Fletcher R, Heintsch L, Morley A, Nakamoto L, Utsumi K. 2011. Algal blooms in Ontario, Canada: increases in reports since 1994. Lake Reservoir Manage. 27(2):107–114. doi:10.1080/07438141.2011.557765.