
 ?Mathematical formulae have been encoded as MathML and are displayed in this HTML version using MathJax in order to improve their display. Uncheck the box to turn MathJax off. This feature requires Javascript. Click on a formula to zoom.
Abstract
Peak stimulated growth hormone (GH) levels are known to decrease with increasing body mass index (BMI), possibly leading to overdiagnosis of GH deficiency (GHD) in children with overweight and obesity. However, current guidelines do not guide how to interpret the peak GH values of these children. This systematic review and meta-analysis aimed to study the effect of the BMI standard deviation score (SDS) on stimulated peak GH values in children, to identify potential moderators of this association, and to quantify the extent to which peak GH values in children with obesity are decreased. This systematic review was performed by the PRISMA guidelines. Medline, Embase, Cochrane, Web of Science, and Google Scholar databases were searched for studies reporting the impact of weight status on peak GH in children. Where possible, individual participant data was extracted and/or obtained from authors. Quality and risk of bias were evaluated using the Scottish Intercollegiate Guidelines Network (SIGN) checklists. The primary outcome was the association between peak GH values and BMI SDS. The pooled correlation coefficient r, 95% confidence interval (CI), and heterogeneity statistic I2 were calculated under a multilevel, random-effects model. In addition, exploratory moderator analyses and meta-regressions were performed to investigate the effects of sex, pubertal status, presence of syndromic obesity, mean age and mean BMI SDS on the study level. For the individual participant dataset, linear mixed-models regression analysis was performed with BMI SDS as the predictor and ln(peak GH) as the outcome, accounting for the different studies and GH stimulation agents used. In total, 58 studies were included, providing data on n = 5135 children (576 with individual participant data). Thirty-six (62%) studies had high, 19 (33%) medium, and 3 (5%) low risks of bias. Across all studies, a pooled r of −0.32 (95% CI −0.41 to −0.23, n = 2434 patients from k = 29 subcohorts, I2 = 75.2%) was found. In meta-regressions, larger proportions of males included were associated with weaker negative correlations (p = 0.04). Pubertal status, presence of syndromic obesity, mean age, and mean BMI SDS did not moderate the pooled r (all p > 0.05). Individual participant data analysis revealed a beta of −0.123 (95% CI −0.160 to −0.086, p < 0.0001), i.e. per one-point increase in BMI SDS, peak GH decreases by 11.6% (95% CI 8.3–14.8%). To our knowledge, this is the first systematic review and meta-analysis to investigate the impact of BMI SDS on peak GH values in children. It showed a significant negative relationship. Importantly, this relationship was already present in the normal range of BMI SDS and could lead to overdiagnosis of GHD in children with overweight and obesity. With the ever-rising prevalence of pediatric obesity, there is a need for BMI (SDS)-specific cutoff values for GH stimulation tests in children. Based on the evidence from this meta-analysis, we suggest the following weight status-adjusted cutoffs for GH stimulation tests that have cutoffs for children with normal weight of 5, 7, 10, and 20 µg/L: for overweight children: 4.6, 6.5, 9.3, and 18.6 µg/L; and for children with obesity: 4.3, 6.0, 8.6, and 17.3 µg/L.
Introduction
The prevalence of pediatric obesity has increased dramatically in the past decades, resulting in over 124 million (7%) children and adolescents living with obesity worldwide [Citation1]. Obesity is a multifactorial disease caused by an imbalance between energy intake and expenditure. Endocrine conditions, such as growth hormone deficiency (GHD), hypothyroidism, or hypercortisolism can lead to obesity but are considered rare in children and adolescents [Citation2]. According to current international guidelines for pediatric obesity, endocrine testing is recommended only in children who are short relative to their genetic potential or have decreased growth velocity in combination with weight gain [Citation2]. However, obesity itself is known to influence growth hormone diagnostics [Citation3,Citation4]. This systematic review focuses on the interpretation of growth hormone (GH) stimulation tests in children (up to age 18 years) with obesity. GH is an anterior pituitary hormone, secreted in a pulsatile pattern mostly during deep sleep [Citation5]. The main effects of GH are exerted in the liver, where it stimulates the production of insulin-like growth factor-1 (IGF-1). IGF-1 is an anabolic hormone that plays a key role in linear growth [Citation6]. Plasma levels of GH are regulated by negative feedback loops mainly involving two hypothalamic hormones, growth hormone-releasing hormone (GHRH) and somatostatin, as well as by direct negative feedback of IGF-1 on GH secretion (). GHD in children is a disease characterized by decreased linear growth, increased central adiposity, decreased fat-free mass, and metabolic derangements including insulin resistance [Citation7]. Treatment with recombinant GH is indicated to normalize linear growth and improve body composition [Citation4,Citation7]. GHD can arise as an isolated occurrence or as part of syndromes associated with short stature, such as Prader-Willi syndrome (PWS) or Turner syndrome [Citation8].
Figure 1. Schematic representation of the hypothalamic-pituitary-somatotropic axis and the effect of several GH secretagogues used in GH stimulation tests. GH secretagogues can be administered orally (indicated by the tablet icon), intramuscularly, or intravenously (indicated by the syringe icon). Clonidine and hypoglycemia, either introduced by insulin in the ITT or by glucagon administration, directly stimulate pituitary secretion of GH. Beta-adrenergic receptor agonists such as arginine and L-dopa exert their GH stimulating effect by lowering the chronic inhibitory somatostatinergic tone. At the hypothalamic level, the neuropeptide galanin stimulates the release of GHRH. The synthetic growth hormone-releasing peptide hexarelin is a ligand for the growth hormone secretagogue receptor that stimulates the production of GHRH and inhibits the release of somatostatin [Citation5]. GHRH: growth hormone-releasing hormone; GH: growth hormone; IGF-1: insulin-like growth factor-1; ITT: insulin tolerance test.
![Figure 1. Schematic representation of the hypothalamic-pituitary-somatotropic axis and the effect of several GH secretagogues used in GH stimulation tests. GH secretagogues can be administered orally (indicated by the tablet icon), intramuscularly, or intravenously (indicated by the syringe icon). Clonidine and hypoglycemia, either introduced by insulin in the ITT or by glucagon administration, directly stimulate pituitary secretion of GH. Beta-adrenergic receptor agonists such as arginine and L-dopa exert their GH stimulating effect by lowering the chronic inhibitory somatostatinergic tone. At the hypothalamic level, the neuropeptide galanin stimulates the release of GHRH. The synthetic growth hormone-releasing peptide hexarelin is a ligand for the growth hormone secretagogue receptor that stimulates the production of GHRH and inhibits the release of somatostatin [Citation5]. GHRH: growth hormone-releasing hormone; GH: growth hormone; IGF-1: insulin-like growth factor-1; ITT: insulin tolerance test.](/cms/asset/68590682-a751-4d98-a69f-5ce468c06b50/ilab_a_1956423_f0001_c.jpg)
The diagnosis of GHD is based on clinical criteria that incorporate, among others, auxologic parameters (e.g. short stature), radiologic parameters (e.g. bone age), laboratory findings (e.g. plasma IGF-1 values), and clinical signs and symptoms indicative of syndromes associated with poor growth (e.g. disproportionate stature). Due to the short half-life of GH, its direct measurement is not helpful in the diagnosis of GHD. Instead, dynamic GH stimulation tests are a key element in the diagnosis of GHD. These tests involve the administration of a GH secretagogue and subsequent serial measurement of plasma GH values ().
Current international guidelines of the Pediatric Endocrine Society and the Growth Hormone Research Society require an inadequate response in two separate GH stimulation tests to diagnose GHD [Citation3,Citation4]. These guidelines mention that peak GH levels decrease with increasing body mass index (BMI). The pathophysiologic mechanisms that are suggested to underlie this association include altered GH secretory bursts and increased GH clearance, inhibition of GH synthesis by increased insulin and/or free fatty acids levels, and increased somatostatinergic tonus [Citation7]. Consequently, the negative association of peak GH levels with BMI could lead to overdiagnosis of GHD in children with overweight or obesity. However, these current guidelines state that there is insufficient evidence to use BMI-adjusted cutoffs in children and thus they do not provide guidance on the interpretation of peak GH levels in children with overweight or obesity [Citation3,Citation4]. In adults, BMI-adjusted cutoff values for defining positive GH stimulation tests have been proposed for the glucagon stimulation test and the GHRH + arginine test [Citation9,Citation10]. Obesity-adjusted diagnostics are not available yet for children. The 2019 guideline of the Pediatric Endocrine Society emphasizes that further research on the impact of obesity on the diagnosis of GHD in children is a topic of high priority [Citation3]. However, so far, the extent to which body composition impacts the clinical value of GH stimulation tests has not been assessed systematically. Therefore, this systematic review and meta-analysis aimed to study the effect of BMI on peak GH values after stimulation tests in children, to identify potential moderators of this association, and to quantify the extent to which peak GH values after stimulation tests in children with obesity are decreased. Based on this information, we propose age,-, sex-, and weight status-adjusted cutoffs for peak GH to help clinicians and clinical chemists in interpreting peak GH values in children with overweight or obesity.
Materials and methods
This systematic review and meta-analysis were performed by the Preferred Reporting Items for Systematic Reviews and Meta-Analyses (PRISMA) statement and Meta-analysis of Observational Studies in Epidemiology (MOOSE) checklist [Citation11,Citation12].
Search strategy and selection criteria
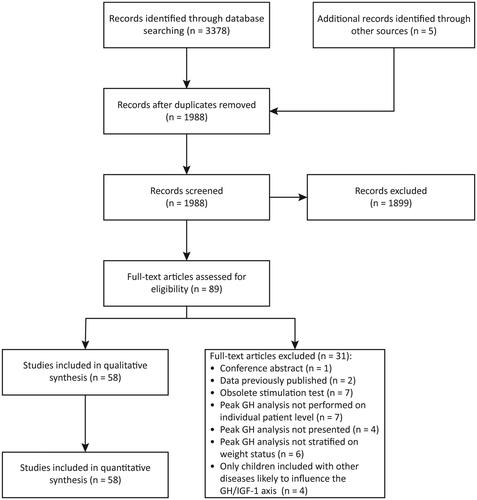
We conducted a systematic literature search to identify all published studies reporting data on GH stimulation tests in children (including adolescents) and the possible impact of weight status. A medical information specialist designed a search strategy for the Embase, Medline (Ovid), Web of Science, Cochrane Library, and Google Scholar databases from inception up to 18 March 2021. In short, the search strategy combined the keywords “weight/obesity,” “growth hormone,” “stimulation test,” and “children/adolescents.” In addition, reference lists of all included studies as well as all identified international guidelines were systematically screened for potentially relevant articles [Citation13]. The complete search strategy is presented in Supplementary Material 1, Search Strategy. Inclusion criteria were: (1) performance of a standard GH stimulation test; (2) inclusion of a pediatric (sub)population (aged 0–18 years); (3) peak GH analyzed at the individual level; and (4) peak GH analysis stratified on weight status on a continuous and/or categorical scale. Exclusion criteria were: (1) case reports; (2) review articles; (3) studies in which stimulated GH was analyzed only at the group level per time point; (4) studies in which weight status was not taken into account in the analysis of peak GH; and (5) studies that included children with other diseases that were likely to influence the GH/IGF-1 axis, e.g. central precocious puberty. The search results were exported to reference management software (Endnote version X9, Clarivate Analytics) and duplicates were removed. Then, two researchers, one physician with a background in pediatric endocrinology (OA) and one clinical chemist (DA), screened all 1862 studies independently in two stages (). First, titles and abstracts were screened independently by both investigators, blinded to each other’s screening decisions. Subsequently, the full text of all identified articles was screened by both researchers independently. In both screening stages, discrepancies between the two researchers were discussed until consensus was reached; in the case of disagreement, a third, senior investigator (EvdA or YdR) served as adjudicator.
Figure 2. The PRISMA flow diagram for the systematic review. GH: growth hormone; IGF-1: insulin-like growth factor-1.
Data extraction
Descriptive, methodological, and outcome data from the included studies were extracted using a predesigned data extraction sheet. All data was extracted by one of the two first authors (OA, DA) and were subsequently verified by the other researcher to ensure accuracy. The following data was extracted: study characteristics (sample size, inclusion and exclusion criteria, design); study population characteristics (syndromic or non-syndromic obesity, normal or short stature, pubertal stage, age, weight status, peak GH and IGF-1 SDS); applied definitions (for obesity, for inadequate response to the GH stimulation tests used, and for GHD); details regarding the GH stimulation test used and GH assay characteristics [including calibration of the assay against a World Health Organization (WHO) standard]; and the number of children with and without obesity who showed an inadequate response to the GH stimulation test. All studies reported peak GH either in µg/L or ng/mL; in this systematic review, all values are expressed in the SI units, µg/L. If original publications did not report sufficient data to allow their inclusion in our quantitative analyses, the corresponding authors of studies published from 2010 onwards were contacted twice in a two-week time frame to obtain the missing data. For all qualitative and quantitative analyses, patients were divided into three categories: patients with GHD, patients without GHD with obesity, and patients without GHD without obesity. Furthermore, we separately analyzed patients with syndromic obesity, i.e. Turner syndrome, PWS, Bardet-Biedl syndrome (BBS), pseudohypoparathyroidism type 1a (PHP1a), and Kabuki syndrome.
Individual participant dataset
We curated a dataset containing individual participant data for meta-analyses. When tables with individual-level data were given, this data was extracted manually from the studies. When studies presented a scatterplot for the relation between a weight parameter (e.g. BMI) and peak GH, all individual data points from the scatterplot were extracted using an online tool (WebPlotDigitizer version 4.3, URL: https://apps.automeris.io/wpd/). All data extractions were performed by one of the authors (OA, DA) and thoroughly checked by the other author to ensure accuracy. In total, individual participant data was available for n = 1738 stimulation tests in 1474 children from 27 studies; of these, there were n = 726 GH stimulation tests in 576 children from 22 studies with data on the BMI standard deviation score (SDS) and peak GH values (Supplementary Material 2, Individual Participant Dataset). When individual participant data was available in a study that reported a weight parameter other than BMI, e.g. ideal body weight percentage (IBW%), we transformed the reported weight parameter to BMI using the growth reference charts mentioned in the study. We used the McLaren method for these transformations because this was the recognized method to calculate ideal body weight at the time of publication of most of these studies (1960s–1980s) [Citation14]. When no external growth reference standard was specified, we used the growth reference charts of Tanner [Citation15] because these were the most widely used external growth standards during that time span. We calculated BMI SDS using the 2000 Centers for Disease Control and Prevention growth charts (for American studies from 2000 onwards) or 2006 WHO growth charts (for all other studies), for all studies with available individual participant data that did not report a BMI SDS [Citation16,Citation17].
Study quality and risk of bias assessment
The quality and risk of bias of the included studies were evaluated using the Scottish Intercollegiate Guidelines Network (SIGN) checklists for cohort, case-control, and diagnostic accuracy studies [Citation18]. Because most studies contained elements of several of these study designs, we compiled all relevant domains across the three SIGN checklists to enhance the relevance of the risk of bias assessment. All SIGN checklists contain the same conclusion domain where studies are ultimately considered to have a low risk of bias (SIGN: “high quality”), medium risk of bias (SIGN: “acceptable”), or high risk of bias (SIGN: “unacceptable”). All risk of bias assessments were performed independently by two researchers (DA, OA) blinded for each other’s decisions; inconsistencies were settled by discussion until consensus was reached.
Statistical analysis
All meta-analyses were conducted in R version 3.6.3 using the packages metafor and lme4 with a two-sided ɑ of 0.05. Before analyses, medians and interquartile ranges (IQR) were converted to means and standard deviations [Citation19]. Peak GH values were multiplied by a correction factor when a study stated that this was necessary to compare the peak GH values with data in the literature. Where needed, subgroup means were pooled [Citation20]. The overall weighted mean and standard deviation stratified on the type of GH stimulation test used were calculated using the same formulas. For analytical purposes, we divided studies that performed the stratified analysis of separate stimulation tests in each individual patient into separate subcohorts, whilst accounting for the possible non-independence of observations between subcohorts in all subsequent analyses. We aimed to perform four complementary quantitative analyses: (1) a meta-analysis of correlation coefficients between peak GH and BMI SDS, (2) linear mixed-models regression analysis on the individual participant data; (3) a meta-analysis of the relative risk (RR) of a diagnosis of GHD in children referred for short stature with obesity vs. without obesity; and (4) a comparison of the proportion of children without GHD with obesity vs. without obesity who remained below the pre-specified peak GH cutoff value.
For the meta-analysis of correlation coefficients, we calculated the bivariate correlation (Pearson’s r for normally distributed data and Spearman’s ρ otherwise) between BMI SDS and peak GH for all subcohorts of studies with individual participant data that did not report a correlation coefficient if the sample size was ≥25 patients. For studies without individual participant data, correlation coefficients were calculated for each subcohort using the standardized mean difference of peak GH between patients without GHD with obesity vs. without obesity [Citation21]. Subsequently, Fisher's r-to-z transformation was applied to all individual correlation coefficients. Finally, the estimated pooled correlation coefficient, 95% confidence interval (CI), and prediction interval were computed using a multilevel random-effects model that accounted for possible within-study (i.e. subcohort) correlation [Citation22]. Between-study heterogeneity was assessed using the I2 statistic and Cochrane’s Q test, with I2 > 25% and p < 0.05 for Cochrane’s Q test indicating heterogeneity. The possible presence of publication bias was assessed using contour-enhanced funnel plots and Egger’s regression test (p < 0.05 indicating publication bias) with the addition of sampling variance as a moderator in our multilevel model to account for within-study correlation [Citation22,Citation23]. Exploratory moderator analyses were performed with mixed-effect models for categorical parameters (e.g. type of GH stimulation test) and meta-regression with random-effects models for continuous parameters (e.g. mean age of the study participants).
Secondly, we performed linear mixed-models regression analysis on the individual participant dataset with outcome ln(peak GH) and predictor BMI SDS, accounting for the GH stimulation agent used (fixed effect), study (random effect), and the number of separate GH stimulation tests performed in an individual patient (random effect). Natural splines with 2 or 3 degrees of freedom were added to the model to investigate possible non-linearity, but the comparison of models revealed a better fit (lowest Akaike Information Criterion and Bayesian Information Criterion) in the linear model, i.e. without natural splines. The addition of interaction terms between BMI SDS and the GH stimulation agent used revealed no interaction of the GH stimulation agent used on the effect of BMI SDS on ln(peak GH). Therefore, these interaction terms were omitted from the final models.
Thirdly, we aimed to perform a meta-analysis on the RR for a diagnosis of GHD in children with obesity vs. without obesity under a random-effects model.
Finally, the proportion of patients without GHD with obesity vs. without obesity that remained below the pre-specified study-specific peak GH cutoff value were compared using χ2-tests, both across all studies as well as stratified per type of GH stimulation agent.
Results
Characteristics of the included studies
The search strategy identified 1988 articles in the selected databases after deduplication (). In total, 58 articles describing 104 subcohorts of patients met inclusion criteria and were included in this study [Citation24–81]. The main characteristics of included studies are summarized in and Supplementary Material 1, Table 1. Forty-eight studies were published between 1967 and 2010; 10 studies were published in the past decade. In total, n = 5135 children were included (median per study 30; IQR 14–77), of which 633 children (12.3%) had obesity without GHD and 2006 children (39.1%) had GHD. The mean age of children at the subcohort level ranged from 7.4–15.9 years, with a weighted mean of 10.2 ± 3.6 years (available for 47 studies, n = 4318 children). The mean BMI SDS at the subcohort level ranged from −0.8 to +4.3, with a weighted mean of 0.13 ± 1.54 (available for 25 studies, n = 2081 children). Out of the 3713 children with information available on pubertal status, 2669 (71.9%) were pre-pubertal. Sex steroid priming was either not performed or not mentioned in all studies except for one in which a subgroup of 5 boys with constitutional growth delay received an intramuscular testosterone injection before GH stimulation testing [Citation46].
Table 1. Overview of baseline characteristics of included studies. In total, 58 studies were included describing n = 5135 children.
Across all studies, 15 different stimulation tests were used, most importantly the arginine (12 studies), clonidine (15 studies), dopamine (7 studies), GHRH (17 studies), GHRH + arginine (5 studies) tests, and the insulin tolerance test (13 studies). Most studies used a radioimmunoassay to measure GH in plasma or serum [Citation26–30,Citation32–34,Citation37–43,Citation45–48,Citation50–52,Citation54–57,Citation60–66,Citation69,Citation71–77,Citation79]. In more recent studies, chemiluminescence or enzyme-linked immunometric assays were used [Citation24,Citation25,Citation35,Citation36,Citation44,Citation49,Citation67,Citation70, Citation80,Citation81]. Five studies mentioned the use of calibrated GH assays [Citation24,Citation33,Citation57,Citation61,Citation62]. Thirty-two studies pre-specified a cutoff value for inadequate peak GH response. The majority of these studies (18/32, 56%) used a cutoff value of 10 µg/L (range 5–10 µg/L). For the GHRH + arginine test, a cutoff value of 20 µg/L was used. None of the included studies used or proposed BMI-specific cutoff values for their GH stimulation tests.
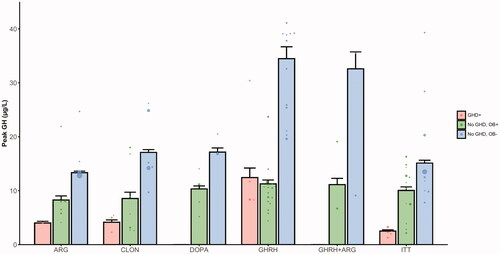
Weighted mean peak GH values for the most frequently used stimulation tests in non-syndromic children are presented in . In 16 studies, children with syndromic obesity were included: Turner syndrome in six studies (n = 470 children), PWS in six studies (n = 54 children), PHP1a in two studies (n = 18 children), Kabuki syndrome in one study (n = 18 children), and BBS in one study (n = 5 children). Weighted mean peak GH values for the most frequently used stimulation tests for these studies are presented in Supplementary Material 1, Figure 1.
Figure 3. Weighted mean peak GH values in the studies of children with non-syndromic obesity, stratified on GHD status and weight status. Data was available for n = 2518 children from k = 51 subcohorts. The dots represent the mean of individual subcohorts and the barplot represents the weighted mean peak GH ± SEM. In the case of the DOPA, GHRH, and GHRH + ARG tests, no studies with results on children with GHD were identified. GHD+: children with growth hormone deficiency; No GHD, OB+: children without GDH with obesity; No GHD, OB−: children without GDH without obesity; ARG: arginine test; CLON: clonidine test; DOPA: dopamine test; GHRH: growth hormone-releasing hormone test; GHRH + ARG: combined growth hormone-releasing hormone + arginine test; ITT: insulin tolerance test; GH: growth hormone; GHD: growth hormone deficiency; SEM: standard error of the mean.
Risk of bias
Out of the 58 studies, three were rated as having high quality (low risk of bias) and 19 as having acceptable quality (medium risk of bias), whereas the remaining 36 studies were rated as having a high risk of bias (Supplementary Material 1, Table 2). The most important reasons for risk of bias were: (1) unclear patient selection procedures; (2) no predefined peak GH threshold for the stimulation test used, and/or no clear definition of GHD; (3) not using calibrated GH assays; (4) use of IBW% or other currently abandoned anthropometric measurements to classify weight status of patients instead of BMI/BMI SDS; and (5) comparison of patients with obesity with normal stature to patients without obesity with idiopathic/familial short stature (in some studies defined by peak GH values above a pre-specified threshold without other endocrine abnormalities).
Qualitative synthesis
In general, three subtypes of studies were recognized (): (1) case-control design of children without GHD with obesity compared to children without obesity and/or children with GHD in 40 studies (n = 2945 children) [Citation26–28,Citation30,Citation31,Citation33,Citation34,Citation37–40,Citation44–48,Citation50–52,Citation54,Citation55,Citation58–65,Citation68,Citation69,Citation71–77]; (2) observational cohort design investigating the impact of BMI SDS on a continuous scale in children referred to a pediatric endocrinology center for analysis of short stature in eight studies (n = 1608 children) [Citation24,Citation42,Citation43,Citation49,Citation57,Citation67,Citation78,Citation79]; and (3) syndromic obesity (with or without a control group) in 16 studies (n = 569 children) [Citation25,Citation27,Citation29,Citation32,Citation35,Citation36,Citation56,Citation57,Citation59,Citation61,Citation63,Citation66,Citation70,Citation72,Citation80,Citation81].
The first category of studies generally aimed at comparing peak GH values in otherwise healthy children with and without obesity, with some studies additionally comparing to children with GHD. In general, children with obesity were found to have mean peak GH values in between those of children with normal weight and children with GHD (), irrespective of the stimulation agent. In several studies, the addition of a cholinergic agent such as pyridostigmine or a beta-blocker such as atenolol, led to a partial reversal of GH responsiveness [Citation31,Citation37,Citation45,Citation50,Citation75]. One study found that peak GH levels in children with obesity after hexarelin, a synthetic neuropeptide with strong GH-stimulating effects, were similar to those found in children without obesity after GHRH [Citation46]. In 14 studies, IGF-1 levels were also measured [Citation26,Citation27,Citation33,Citation44,Citation47,Citation50,Citation52,Citation54,Citation58, Citation62–64,Citation72,Citation73] and were found to be in the normal range or high in children with vs. without obesity. Perotti et al. found that the fat mass index on a dual-energy X-ray absorptiometry scan (DXA-scan) correlated more strongly to peak GH than BMI [Citation58].
The second category of studies investigated the impact of BMI on peak GH values in children referred for short stature to pediatric endocrinology clinics [Citation24,Citation42,Citation43,Citation49,Citation57,Citation67,Citation78,Citation79]. These cohorts included predominantly pre-pubertal children, with more than 70% pre-pubertal participants in seven out of eight studies (range 54–100%). In seven out of the eight studies, a majority of boys were included (range 58–70%). In two of the eight studies, only children without GHD were included [Citation43,Citation57], whereas one study included only children with GHD [Citation78]. On a continuous scale, all eight studies reported statistically significant negative correlation coefficients ranging from −0.08 to −0.29 for the relation between BMI SDS (seven studies) or BMI% (one study) and peak GH values in children without GHD [Citation43,Citation49,Citation57,Citation67,Citation79]. In two studies, the negative association between BMI and peak GH remained significant after correction for age, gender, and pubertal status [Citation79] and additionally IGF-1 values [Citation42]. In contrast, Stanley et al. [Citation67] and Lee et al. [Citation43] reported that the association was no longer statistically significant in pubertal children or both pre-pubertal and pubertal children after stratification on pubertal status.
When focusing on children with GHD, Yang et al. found a negative correlation between BMI SDS and peak GH of −0.10 [Citation78]. This phenomenon was also observed by Tanaka et al., who reported a correlation coefficient of −0.25 for IBW% vs. peak GH in a sample of 789 pre-pubertal children with GHD from the Pfizer International Growth (KIGS) Database, an international registry for children treated with GH analogs [Citation69]. However, two studies reported no association between BMI and peak GH in children with GHD [Citation49,Citation79].
The third category of studies investigated the presence of GHD in the context of genetic obesity syndromes associated with short stature and found GHD in a median of 25.8% (IQR 8.3–38.3%) of the study participants [Citation25,Citation27,Citation29,Citation32,Citation35,Citation36,Citation56,Citation57,Citation59,Citation61,Citation63,Citation66,Citation70,Citation72,Citation80,Citation81]. Pertzelan et al. suggested that patients with syndromic obesity had lower peak GH responses than patients with non-syndromic obesity, even when the degree of obesity was considered [Citation59].
Side effects of GH stimulation tests were mentioned in 20 studies. For the insulin tolerance and glucagon tests, symptoms of hypoglycemia such as nausea and vomiting were recorded [Citation28,Citation74,Citation76], which led to discontinuation of the test in one study in 2/13 children [Citation28]. In the case of clonidine testing, a transient decrease in blood pressure and drowsiness was recorded [Citation25,Citation49,Citation71]. In tests investigating GHRH alone, no side effects were mentioned [Citation47,Citation48,Citation50–52], whereas mild abdominal discomfort, borborygmi, and facial flushing were recorded as side effects when GHRH was combined with cholinergic agents or beta-blockers [Citation25,Citation27,Citation30,Citation31,Citation47,Citation48,Citation50,Citation51]. For galanin, the only side effect recorded was a temporary bad taste [Citation52,Citation53], whereas hexarelin did not induce any side effects [Citation46].
Quantitative syntheses
Correlation between peak GH and BMI SDS in patients without GHD
For 10 studies (11 subcohorts), correlation coefficients between peak GH and BMI SDS were provided in the original publications for patients without GHD or were calculated using individual participant data. For an additional 11 studies (18 subcohorts), correlation coefficients were calculated using the standardized mean difference of peak GH between patients without GHD with obesity vs. without obesity. All subcohorts for which correlation coefficients were available concerned non-syndromic children. When pooled, BMI SDS showed a moderate, statistically significant negative correlation with peak GH (pooled r = −0.32, 95% CI −0.41 to −0.23, 95% prediction interval −0.62 to 0.07, n = 2434 patients from k = 29 subcohorts; ). Study heterogeneity was large (I2 = 75.2%, Cochrane’s Q-test p < 0.0001) and was fully explained by between-study heterogeneity; within-study (i.e. subcohort) heterogeneity was found to account for 1.4*10−8% of the total variance. In the exploratory moderator analyses, the larger proportion of males included was associated with weaker negative correlations (). Furthermore, studies investigating cohorts referred for short stature showed weaker negative correlations than studies with case-control designs. The proportion of pre-pubertal patients, mean age and BMI SDS of the populations, and type of GH stimulation agent that was used did not significantly moderate the pooled r (). No clear evidence for publication bias was found through visual inspection of the funnel plot (Supplementary Material 1, Figure 2), which was supported by the results of Egger’s regression test (p = 0.10), although the funnel plot confirmed the pattern of cohort studies reporting weaker negative correlations than case-control design studies. In sensitivity analyses, correlation origin (provided by authors or calculated for this meta-analysis) and the correlation calculation method did not moderate the pooled correlation coefficient ().
Figure 4. Forest plot showing the meta-analysis of correlation coefficients between peak GH and BMI SDS in children without GHD. Data was available for n = 2434 patients from k = 29 subcohorts. CLON: clonidine; GHRH: growth hormone-releasing hormone; PD: pyridostigmine; ITT: insulin tolerance test; ARG: arginine; DOPA: dopamine; GAL: galanine; HEX: hexareline; GHRP-6: growth hormone-releasing peptide-6; Corr: correlations; CI: confidence interval; RE: random effects; df: degrees of freedom.
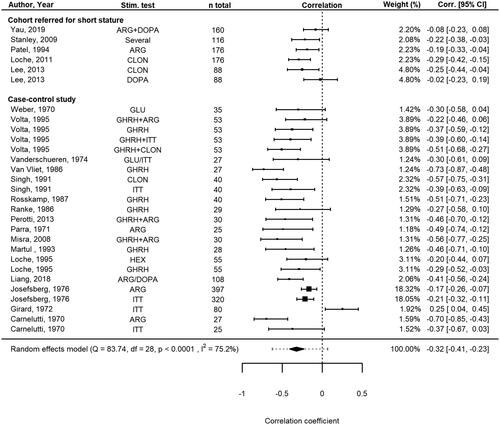
Table 2. Results of meta-regressions and subgroup analyses for the meta-analysis of correlation coefficients between peak GH and BMI SDS.
Individual participant data analysis
Data on peak GH values and BMI SDS on an individual level were available for n = 726 GH stimulation tests from 576 children from 22 studies. Linear mixed-models analysis yielded a beta coefficient of −0.123 (95% CI −0.160 to −0.086, p < 0.0001) for ln(peak GH) per one-point increase in BMI SDS. This corresponded to a decrease in peak GH by 11.6% (95% CI 8.3–14.8%) per one-point increase in BMI SDS. When focusing on the 8 studies with children referred for short stature to a pediatric endocrinology clinic, individual participant data was available from 4/8 studies (n = 457 stimulation tests from 369 children). These 4 studies showed a beta coefficient of −0.079 (95% CI −0.118 to −0.028, p = 0.0017) for ln(peak GH) per one-point increase in BMI SDS. This corresponds to a decrease in peak GH by 7.1% (95% CI 2.7–11.2%) per one-point increase in BMI SDS. In both analyses, the GH stimulation agent used did not moderate the association between ln(peak GH) and BMI SDS (p > 0.05).
Proportion of patients referred for short stature with GHD with or without obesity
In only one of the eight studies that included children referred to pediatric endocrinology clinics for short stature was data presented that allowed calculation of the RR of a diagnosis of GHD in children with obesity vs. without obesity [Citation79], making a formal meta-analysis impossible. In this study, one out of 160 (0.6%) children without GHD was classified as having obesity vs. eight out of 155 (5.2%) children who received a diagnosis of GHD. This corresponds to a RR of 1.85 (95% CI 1.43–2.40; p < 0.0001) for a diagnosis of GHD in children with obesity compared to those without obesity who were referred for short stature. When, as an alternative to a formal meta-analysis, all available data of these eight cohort studies was pooled, data on the weight category was available for n = 1508 children. Of these children, 27 out of 893 (3.0%) children without GHD were classified as having obesity vs. 36 out of 615 (5.9%) children who received a diagnosis of GHD (p = 0.007). This corresponds to a RR of 1.43 (95% CI 1.14–1.78; p = 0.002) for a diagnosis of GHD in children referred for short stature with obesity compared to children referred for short stature without obesity.
Proportion of non-syndromic patients without GHD with or without obesity remaining below the pre-specified peak GH threshold
For 20 studies (30 subcohorts, n = 2034 GH stimulation tests in non-syndromic children), data was available on the proportion of children without GHD with obesity vs. without obesity who showed an inadequate response to the GH stimulation test, i.e. remained below the pre-specified peak GH cutoff value. Across all studies, in 213/391 (54.5%) GH stimulation tests in children with obesity and 260/1643 (15.8%) GH stimulation tests in children without obesity, peak GH remained below the pre-specified cutoff value (p < 0.0001). This corresponded to an overall RR of 3.44 (95% CI 2.98–3.97; p < 0.0001) for an inadequate response to the GH stimulation test in children without GHD with obesity compared to children without obesity. When stratifying the results on the stimulation agent used, no large differences were found between the stimulation agents (). The lowest proportions of inadequate responses, in children both with and without obesity, were observed using the GHRH + arginine test. The insulin tolerance test, which is considered to be the gold standard, did not perform better than other GH stimulation tests, with over half of the children with obesity showing an inadequate response in the test ().
Table 3. Overview of non-syndromic patients without GHD with obesity and without obesity who showed an inadequate response in the GH stimulation test based on a pre-specified peak GH cutoff values.
Discussion
To our knowledge, this is the first systematic review and meta-analysis to investigate and quantify the impact of weight status on peak GH values after GH stimulation tests in children. Our results show a significant overlap between mean peak GH values of children with GHD and children with obesity without GHD. Furthermore, a moderate, negative pooled correlation of −0.32 between BMI SDS and peak GH values was found. Studies that included a larger proportion of males and studies with cohort designs showed slightly weaker negative correlations. Individual participant data analysis showed an 11.6% decrease in peak GH values per one-point increase in BMI SDS across all studies. Importantly, the negative association between BMI SDS and peak GH was already occurring within the normal range of BMI SDS and was independent of the stimulation agent used. This could lead to overdiagnosis of GHD in children with overweight or obesity.
The diagnosis of GHD in children is challenging due to the pulsatile secretion of GH, lack of anatomical substrate or concomitant hormone deficiencies in the case of idiopathic GHD, and lack of an established threshold for GH stimulation test results to distinguish partial GHD from variation in the normal range [Citation3,Citation4].
Shortly following the first publication in 1963 of a method to measure stimulated GH after insulin-induced hypoglycemia in healthy adults [Citation82], several studies reported blunted responses in children and adults with obesity, although the exact pathophysiology was not understood [Citation83]. In the following decades, several mechanisms that are currently thought to largely explain the blunted GH response to stimulation tests in obesity were identified. First, increased fat mass is associated with a decrease in both the frequency and the amplitude of GH secretory bursts and with increased GH clearance, leading to a decreased GH half-life [Citation84,Citation85]. Second, increased insulin levels are thought to play an important role, either via direct inhibition of pituitary GH synthesis and release [Citation7] or via peripheral inhibition of the production of IGF-binding protein 1 by the liver, leading to increased IGF-1 levels [Citation86]. Third, increased levels of free fatty acids (FFA) in obesity are thought to inhibit pituitary GH release either directly or partly via an increase in somatostatinergic tone [Citation87]. Fourth, it is well-known that in obesity, growth hormone-binding protein (GHBP) secretion is increased and serum levels in children are strongly correlated with BMI [Citation88]. GH immunoassays may be affected by high plasma concentrations of GHBP [Citation89], and this could lead to a potential negative bias in peak GH values, especially when using modern assays with monoclonal antibodies and shorter incubation times [Citation90]. Finally, both a chronic increase in somatostatinergic tone and a direct inhibitory effect of increased free IGF-1 levels caused by decreased levels of IGF-binding proteins 1 and 2 have been hypothesized, both in humans and animal models, but their contribution to the hyporesponsiveness of GH to stimulation tests in obesity has been disputed [Citation7]. Importantly, the blunted GH response to GH stimulation is reversible through weight loss in both adults [Citation91] and children [Citation53,Citation92]. Several studies investigated the addition of pharmaceutical agents to GH stimulation agents in obesity. The addition of acipimox, a nicotinic acid analog that causes an acute reduction of FFA levels through direct inhibition of FFA production by the liver, was shown to reverse the blunted GH response to arginine testing in adults [Citation87]. In children, other studies found a partial reversal of hyporesponsiveness to GHRH in obesity with the addition of pyridostigmine, an acetylcholinesterase inhibitor [Citation30,Citation37,Citation50], galanin, a neuropeptide widely expressed in the central nervous system and gut [Citation52], or atenolol, a selective beta1-blocker [Citation51]. As all these agents exert their effect through inhibition of somatostatin, these clinical findings strengthen the hypothesis of an increased somatostatinergic tonus in obesity. Of note, all studies investigating the addition of pharmaceutical agents in GH stimulation tests had a case-control design comparing individuals with obesity vs. without obesity. Their usefulness in cohort studies of children referred for short stature has not yet been investigated, and current clinical guidelines do not mention their potential use [Citation3,Citation4]. Therefore, the addition of these agents to GH stimulation tests in the current clinical practice of children referred for short stature is probably limited until more data becomes available.
Our meta-regression results show that the negative correlation between BMI SDS and peak GH values in children without GHD was significantly moderated by the study design. This finding is of particular clinical importance because most studies investigating this relationship were small case-control studies that compared children with obesity vs. without obesity. When focusing only on cohort studies performed in children referred for short stature without GHD, BMI SDS showed a more modest negative correlation with peak GH of −0.18 and a 7.1% decrease in peak GH values per one-point increase in BMI SDS. Furthermore, meta-regression showed that the proportion of males included was associated with weaker negative correlations. Current pediatric guidelines do not mention sex in the interpretation of GH stimulation test results of children referred for short stature [Citation3,Citation4]. Moreover, recently published studies in children with short stature do not report sex differences in results of GH stimulation tests [Citation93], although sex differences have been reported in adults undergoing GHRH + arginine tests [Citation94]. Given that the weighted mean age of participants was 10.2 years, i.e. around the “pre-pubertal dip” of growth velocity, our finding may be explained by the lack of sex steroid priming in all but one of the studies. Sex steroid priming is known to increase the specificity of GH stimulation tests and can prevent inappropriate diagnosis of GHD and the subsequent need for GH treatment in children with constitutional delay of growth and puberty [Citation4,Citation95]. As such, the 2016 guideline by the Pediatric Endocrine Society advocates the use of sex steroid priming in all pre-pubertal children from age 11 years (boys) or 10 years (girls) onwards [Citation4]. In contrast, however, the 2019 guideline from the Growth Hormone Research Society states that the efficacy of priming for improving the diagnostic performance of GH stimulation testing, in general, is unclear [Citation3]. It could be argued, especially in children with overweight or obesity who are already at risk of showing blunted peak GH responses, that sex steroid priming before GH stimulation tests may have additional benefits to reduce false-positive test results, but this remains to be investigated. Moreover, it is important to standardize the stimulation testing procedure itself, including the route of administration, quantity of stimulation agents, and timing of blood draws [Citation96].
All in all, the negative association between peak GH values and BMI SDS, which is already present in the normal range of BMI SDS, could lead to overdiagnosis of GHD in children with overweight or obesity. A formal meta-analysis of the relative risk of a diagnosis of GHD in children with short stature with obesity vs. without obesity was not possible due to the lack of reported data stratified on both weight status and GHD status. Our analyses, when pooling available data across all these studies, suggest an increased risk of a diagnosis of GHD in children with obesity, as can be expected because peak GH values were used to define GHD in most of the studies that pre-defined GHD. On the other hand, GH treatment registry studies investigating the response to GH treatment found no differences in delta growth velocity or delta height SDS in children with overweight and obesity compared to children with normal weight [Citation97]. This suggests that children with overweight and obesity are not more often misclassified as GH deficient than children with normal weight. It is important to realize that the combination of short stature and obesity is rare, and in our meta-analysis, only 63/1508 (4.2%) children referred for short stature with available data on weight status had obesity. Obesity itself is characterized by slightly increased linear growth during childhood and normal adult height [Citation98]. The combination of short stature or decreased growth velocity and obesity or unexplained weight gain should therefore prompt the clinician’s attention to a potential underlying medical cause for the child’s obesity, e.g. hypercortisolism or genetic obesity syndromes [Citation2,Citation4]. A recent study investigating underlying medical causes of obesity indeed found that lower height SDS was one of the most important predictors of genetic obesity syndromes (mean height SDS −0.4 vs. +0.6 in children with obesity without an underlying medical cause), although only a minority of children with genetic obesity syndromes (4/18, 22%) in this study had short stature [Citation99]. In our meta-analysis, a diagnosis of GHD was made in a median of 25% of children with syndromes associated with short stature, most of which are also associated with obesity. Therefore, clinicians should be aware of the relatively high likelihood of GHD in children with obesity, short stature, and features indicative of an underlying syndrome, such as congenital anomalies, dysmorphic features, or developmental delays.
Importantly, GHD is a clinical diagnosis relying on a combination of auxologic, radiologic, and clinical findings in addition to GH stimulation tests. An ideal GH stimulation test would aid in the diagnosis of GHD by distinguishing healthy children from children with GHD with minimal side effects, be easy to perform, and show reproducibility of the test results [Citation100–102]. However, none of the currently used stimulation tests in children fulfill these criteria, and it has even been argued that GH stimulation tests should not be used in the diagnostic workup of GHD in children [Citation103]. Furthermore, based on our current analyses, a pattern favoring a single stimulation agent was not observed, as 16% of children without GHD without obesity and 55% of children with obesity across all studies showed a peak GH value below the pre-specified cutoff of the study. Even in the case of the insulin tolerance test, which is considered the gold standard test to identify GHD [Citation7,Citation102] (although it is rarely performed due to the risks associated with insulin-induced severe hypoglycemia [Citation3,Citation4,Citation7,Citation104]), over half of the children with obesity remained below the peak GH threshold. This highlights the need for novel, more potent stimulation agents. Synthetic neuropeptides such as hexarelin and macimorelin are examples of stronger stimulation agents that act through the growth hormone secretagogue receptor [Citation105], with the latter already included in the 2019 American Association of Clinical Endocrinologists and American College of Endocrinology guidelines for adult GHD [Citation46,Citation104]. Final results from pediatric studies investigating macimorelin are expected shortly [Citation106], but the impact of BMI on the results of GH stimulation tests with these agents as well as their performance in cases of hypothalamic dysfunction (as opposed to pituitary dysfunction) as a cause of GHD remain to be investigated in both adults and children [Citation3,Citation104]. As well as innovations in GH stimulation testing, stratification of patients based on pretest likelihood estimated from auxologic, radiologic, and anatomic data with subsequent calculation of post-test likelihood based on IGF-1 SDS, as recently proposed, could further aid clinical decision-making regarding GH stimulation tests [Citation107].
Important for the correct interpretation of GH stimulation tests is the standardization of the GH assays used. Current immunoassays, especially those using a monoclonal antibody, are more specific for GH than some older assays [Citation102,Citation108,Citation109]. GH has a wide variety of molecular isoforms that are bound differently by the antibodies used in the assays, especially when using polyclonal antibodies. The first standardization of GH took place in 1969 with the WHO International Reference Preparation 66/127, which contained a variety of GH isoforms. Today, calibration takes place on the 22-kD GH isoform (WHO International Standard (IS) 98/574 or WHO IS 88/624) [Citation90]. Regardless, there is a need for universal harmonization of GH assays [Citation102]. As an example, in the Netherlands, GH assay harmonization took place in the early 2010s and resulted in a decrease of imprecision from 22 to 6.7% using calibrators based on the WHO IS 88/624 [Citation110,Citation111]. Most of the cutoffs for GH stimulation tests were determined in older studies using radioimmunoassays with polyclonal antibodies. In addition to known variation among assays and laboratories, cutoffs need to be revised when using more specific immunoassays [Citation3,Citation4,Citation102]. Even greater adjustments are needed when mass spectrometry is used to assay GH [Citation112].
What peak GH cutoff values should be used for children referred for short stature with overweight and obesity? Our individual participant data analysis showed a decrease in peak GH values of 7.1% per one-point increase in BMI SDS in these children. To calculate the corresponding weight-status adjusted cutoffs, the following equation can be used:
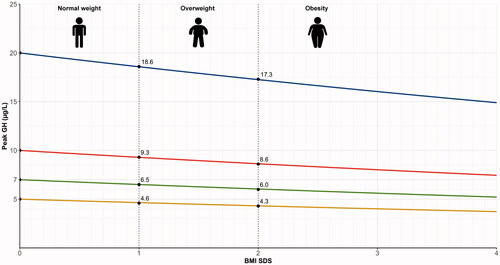
When, by WHO definitions, overweight and obesity in children ≥2 years are defined as a BMI SDS ≥1 (85th percentile) and ≥2 (97.5th percentile) [Citation1,Citation17], this translates into peak GH cutoff values of 9.3 μg/L for overweight and 8.6 μg/L for obesity if the cutoff value for normal weight is set at 10 μg/L (). If the cutoff value for normal weight is set at 7 μg/L, the proposed cutoff values would be 6.5 and 6.0 μg/L for overweight and obesity, respectively. For the GHRH + arginine test in which a cutoff of 20 μg/L is used, the cutoff for overweight would be 18.6 μg/L and for obesity 17.3 μg/L. Importantly, these cutoff values need to be validated prospectively. Gender and puberty status should always be included in future studies so that it is possible to investigate the effect of sex and puberty status on these weight-status adjusted cutoffs.
Figure 5. Weight status-adjusted cutoffs for children with overweight and obesity based on our meta-analysis results. Adjusted cutoffs based on BMI SDS (BMI z-score adjusted for age and sex) are provided for stimulation tests with cutoffs for children with normal weights of 5, 7, 10, or 20 µg/L.
Strengths and limitations
A strength of our systematic review and meta-analysis is its elaborate design that included rigorous extraction of individual participant data in a large subgroup of patients. Where possible, we contacted corresponding authors for additional information. Furthermore, we applied several complementary meta-analytic methods which showed consistent outcomes, thus improving the scientific rigor.
One limitation of this systematic review was that most studies included had a small sample size. To overcome this, we extracted individual participant data where possible and adopted a minimum group size of 25 patients in our meta-analysis of correlations to minimize the risk of small sample bias. Unfortunately, individual participant data was not available for all studies and because most studies were performed decades ago, requested data was not always available. Therefore, we used validated statistical methods, such as the calculation of correlation coefficients via the standardized mean difference, to obtain the required data for our meta-analyses from the originally reported data [Citation21] and performed sensitivity analyses to confirm that these different statistical methods did not moderate our meta-analytic findings. Another limitation is that most of the included publications were case-control studies. These studies often included children with and without obesity with normal stature, and GH stimulation tests would normally not be performed in these populations. Furthermore, the risk of bias assessment showed that the majority of the studies included had a high risk bias. To overcome these issues, we performed sensitivity analyses restricted to cohort studies with children referred for short stature. These sensitivity analyses showed similar results although the effect sizes were slightly smaller and likely less biased. Another limitation was that many studies used radioimmunoassays to determine GH concentrations. Radioimmunoassays are known to be less specific for the 22-kD GH isoform than current assays with monoclonal antibodies. Therefore, we used the peak GH threshold provided by the authors for our analyses of the proportions of children with and without obesity that failed the GH stimulation tests.
Conclusions
In conclusion, we systematically reviewed the current literature on the effect of weight status on GH stimulation test results in children. Our meta-analyses showed a significant negative correlation between BMI SDS and peak GH concentration in children, with a one-point increase in BMI SDS corresponding to an 11.6% decrease in peak GH values. Given the increasing prevalence of pediatric obesity, our study highlights the need for BMI SDS-specific cutoff values for GH stimulation tests in children with short stature. Based on the results of the current meta-analysis, we propose weight-status adjusted cutoffs for GH stimulation tests and provide a general equation to calculate weight status-adjusted cutoffs for GH stimulation tests in children using age- and sex-adjusted BMI SDS. Future studies should prospectively validate these cutoffs in children with short stature.
| Abbreviations | ||
| BBS | = | Bardet-Biedl syndrome |
| BMI | = | body mass index |
| CI | = | confidence interval |
| FFA | = | free fatty acids |
| GH | = | growth hormone |
| GHBP | = | growth hormone-binding protein |
| GHD | = | growth hormone deficiency |
| GHRH | = | growth hormone-releasing hormone |
| IBW% | = | ideal body weight percentage |
| IGF-1 | = | insulin-like growth factor-1 |
| IQR | = | interquartile ranges |
| ITT | = | insulin tolerance test |
| MOOSE | = | meta-analysis of observational studies in epidemiology |
| PHP1a | = | pseudohypoparathyroidism type 1a |
| PRISMA | = | preferred reporting items for systematic reviews and meta-analyses |
| PWS | = | Prader-Willi syndrome |
| RR | = | relative risk |
| SDS | = | standard deviation score |
| SIGN | = | Scottish Intercollegiate Guidelines Network |
| WHO | = | World Health Organization |
Supplementary_Material_2_-_individual_participant_dataset.xlsx
Download MS Excel (199.9 KB)Supplementary_Material_1.docx
Download MS Word (684.6 KB)Acknowledgments
The authors would like to thank Dr. Chiara Guzzetti, Dr. Sandro Loche, Dr. Ji-Eun Lee, and Dr. Aram Yang for providing additional information on their manuscript, and Elise Krabbendam, medical information specialist, for her help with the systematic literature search.
Disclosure statement
The authors report no conflict of interest.
Data availability statement
All data supporting the analyses in this paper are provided in the manuscript, Supplementary Material 1, and Supplementary Material 2, Individual Participant Dataset.
Additional information
Funding
References
- World Health Organization (WHO). Obesity and overweight fact sheet. 2020 [cited 2020 Jan 8]. Available from: https://www.who.int/en/news-room/fact-sheets/detail/obesity-and-overweight
- Styne DM, Arslanian SA, Connor EL, et al. Pediatric obesity-assessment, treatment, and prevention: an endocrine society clinical practice guideline. J Clin Endocrinol Metab. 2017;102(3):709–757.
- Collett-Solberg PF, Ambler G, Backeljauw PF, et al. Diagnosis, genetics, and therapy of short stature in children: a growth hormone research society international perspective. Horm Res Paediatr. 2019;92(1):1–14.
- Grimberg A, DiVall SA, Polychronakos C, et al. Guidelines for growth hormone and insulin-like growth factor-I treatment in children and adolescents: growth hormone deficiency, idiopathic short stature, and primary insulin-like growth factor-i deficiency. Horm Res Paediatr. 2016;86(6):361–397.
- Low MJ. Neuroendocrinology (Chapter 7). In: Melmed S, Polonsky KS, Larsen PR, eds. Williams textbook of endocrinology. 12th ed. Philadelphia (PA): W.B. Saunders; 2011. p. 103–174.
- Baron J, Sävendahl L, De Luca F, et al. Short and tall stature: a new paradigm emerges. Nat Rev Endocrinol. 2015;11(12):735–746.
- Kreitschmann-Andermahr I, Suarez P, Jennings R, et al. GH/IGF-I regulation in obesity-mechanisms and practical consequences in children and adults. Horm Res Paediatr. 2010;73(3):153–160.
- Mazzanti L, Tamburrino F, Bergamaschi R, et al. Developmental syndromes: growth hormone deficiency and treatment. Endocr Dev. 2009;14:114–134.
- Dichtel LE, Yuen KC, Bredella MA, et al. Overweight/obese adults with pituitary disorders require lower peak growth hormone cutoff values on glucagon stimulation testing to avoid overdiagnosis of growth hormone deficiency. J Clin Endocrinol Metab. 2014;99(12):4712–4719.
- Corneli G, Di Somma C, Baldelli R, et al. The cut-off limits of the GH response to GH-releasing hormone-arginine test related to body mass index. Eur j Endocrinol. 2005;153(2):257–264.
- Liberati A, Altman DG, Tetzlaff J, et al. The PRISMA statement for reporting systematic reviews and meta-analyses of studies that evaluate healthcare interventions: explanation and elaboration. BMJ. 2009;339:b2700.
- Stroup DF, Berlin JA, Morton SC, et al. Meta-analysis of observational studies in epidemiology: a proposal for reporting. J Am Med Assoc. 2000;283(15):2008–2012.
- Bramer WM. Reference checking for systematic reviews using endnote. J Med Libr Assoc. 2018;106(4):542–546.
- Phillips S, Edlbeck A, Kirby M, et al. Ideal body weight in children. Nutr Clin Pract. 2007;22(2):240–245.
- Smith DW. Growth and its disorders: basics and standards, approach and classifications, growth deficiency disorders, growth excess disorders, obesity. Major Probl Clin Pediatr. 1977;15:1–155.
- Kuczmarski RJ, Ogden CL, Grummer-Strawn LM, et al. CDC growth charts: United States. Adv Data. 2000;8(314):1–27.
- World Health Organization (WHO). WHO child growth standards. World Health Organization; 2006 [cited 2020 Oct 22]. Available from: https://www.who.int/childgrowth/publications/technical_report_pub/en/
- Scottish Intercollegiate Guidelines Network. SIGN methodology checklists Edinburgh. [cited 2020 Oct 22]. Available from: https://www.sign.ac.uk/what-we-do/methodology/checklists/
- Wan X, Wang W, Liu J, et al. Estimating the sample mean and standard deviation from the sample size, median, range and/or interquartile range. BMC Med Res Methodol. 2014;14:135.
- Higgins JPT, Thomas J, Chandler J, et al. Cochrane handbook for systematic reviews of interventions version 6.1 Cochrane; 2020 [cited 2020 Oct 22]. Available from: www.training.cochrane.org/handbook
- Borenstein M, Hedges LV, Higgins JPT, et al. Converting among effect sizes. Chapter 7. In: Introduction to meta-analysis. Chichester: John Wiley & Sons; 2009. p. 45–49.
- Viechtbauer W. Conducting meta-analyses in R with the metafor package. J Stat Softw. 2010. DOI:https://doi.org/10.18637/jss.v036.i03.
- Sterne JA, Egger M. Funnel plots for detecting bias in meta-analysis: guidelines on choice of axis. J Clin Epidemiol. 2001;54(10):1046–1055.
- Barrett J, Maranda L, Nwosu BU. The relationship between subnormal peak-stimulated growth hormone levels and auxological characteristics in obese children. Front Endocrinol. 2014 2014;5:35.
- Beccaria L, Benzi F, Sanzari A, et al. Impairment of growth hormone responsiveness to growth hormone releasing hormone and pyridostigmine in patients affected by Prader-Labhardt-Willi syndrome. J Endocrinol Invest. 1996;19(10):687–692.
- Bideci A, Cinaz P, Hasanoglu A, et al. Serum levels of insulin-like growth factor-I and insulin-like growth factor binding protein-3 in obese children. J Pediatr Endocrinol Metab. 1997;10(3):295–299.
- Cappa M, Grossi A, Borrelli P, et al. Growth hormone (GH) response to combined pyridostigmine and GH-releasing hormone administration in patients with Prader-Labhard-Willi syndrome. Horm Res. 1993;39(1–2):51–55.
- Carnelutti M, Del Guercio MJ, Chiumello G. Influence of growth hormone on the pathogenesis of obesity in children. J Pediatr. 1970;77(2):285–293.
- Cavallo L, Gurrado R, Bernasconi S, et al. Endogenous growth hormone secretion does not correlate with growth in patients with Turner's syndrome. J Pediatr Endocrinol Metab. 1999;12(5):623–627.
- Cordido F, Casanueva FF, Dieguez C. Cholinergic receptor activation by pyridostigmine restores growth hormone (GH) responsiveness to GH-releasing hormone administration in obese subjects: evidence for hypothalamic somatostatinergic participation in the blunted GH release of obesity. J Clin Endocrinol Metab. 1989;68(2):290–293.
- Cordido F, Dieguez C, Casanueva FF. Effect of central cholinergic neurotransmission enhancement by pyridostigmine on the growth hormone secretion elicited by clonidine, arginine, or hypoglycemia in normal and obese subjects. J Clin Endocrinol Metab. 1990;70(5):1361–1370.
- Costeff H, Holm VA, Ruvalcaba R, et al. Growth hormone secretion in Prader-Willi syndrome. Acta Paediatr Scand. 1990;79(11):1059–1062.
- Coutant R, Lahlou N, Bouvattier C, et al. Circulating leptin level and growth hormone response to stimulation tests in obese and normal children. Eur J Endocrinol. 1998;139(6):591–597.
- Croughs W, Schopman W, Tiddens HAWM. Plasma growth hormone response to insulin induced hypoglycemia. Helv Paediatr Acta. 1968;23(5):464–477.
- de Sanctis L, Bellone J, Salerno M, et al. GH secretion in a cohort of children with pseudohypoparathyroidism type Ia. J Endocrinol Invest. 2007;30(2):97–103.
- Germain-Lee EL, Groman J, Crane JL, et al. Growth hormone deficiency in pseudohypoparathyroidism type 1a: another manifestation of multihormone resistance. J Clin Endocrinol Metab. 2003;88(9):4059–4069.
- Ghigo E, Mazza E, Corrias A, et al. Effect of cholinergic enhancement by pyridostigmine on growth hormone secretion in obese adults and children. Metabolism. 1989;38(7):631–633.
- Girard J, Stahl M, Nars PW, et al. Endocrine disturbances in childhood obesity: growth-hormone and cortisol response to insulin induced hypoglycemia. Klin Wochenschr. 1972;50(14):706–710.
- Josefsberg Z, Kauli R, Keret K. Growth hormone response to insulin tolerance test and arginine stimulation in obese children and adolescents. Pediatr Adolesc Endocrinol. 1976;1:146–152.
- Kaplan SL, Abrams CA, Bell JJ, et al. Growth and growth hormone. I. Changes in serum level of growth hormone following hypoglycemia in 134 children with growth retardation. Pediatr Res. 1968;2(1):43–63.
- Komatsu F. Growth hormone secretion in children. Part II: The responses of growth hormone secretion with insulin induced hypoglycemia in various diseases. Pediatr Int. 1973;15(1):39–50.
- Lee HS, Hwang JS. Influence of Body Mass index on growth hormone responses to classic provocative tests in children with short stature. Neuroendocrinology. 2011;93(4):259–264.
- Lee J, Yoon J, Kang MJ, et al. Influence of body mass index on the growth hormone response to provocative testing in short children without growth hormone deficiency. J Korean Med Sci. 2013;28(9):1351–1355.
- Liang S, Zhang D, Qi J, et al. Reduced peak stimulated growth hormone is associated with hyperuricemia in obese children and adolescents. Sci Rep. 2018;8(1):7931.
- Loche S, Balzano S, Bozzola M, et al. Secretion of growth hormone releasing hormone in obese children. J Endocrinol Invest. 1992;15(6):453–457.
- Loche S, Cambiaso P, Carta D, et al. The growth hormone-releasing activity of hexarelin, a new synthetic hexapeptide, in short normal and obese children and in hypopituitary subjects. J Clin Endocrinol Metab. 1995;80(2):674–678.
- Loche S, Cappa M, Borrelli P, et al. Reduced growth hormone response to growth hormone-releasing hormone in children with simple obesity: evidence for somatomedin-C mediated inhibition. Clin Endocrinol. 1987;27(2):145–153.
- Loche S, Cappa M, Faedda A, et al. The effect of pirenzepine on the growth hormone response to growth hormone-releasing hormone in obese children. Acta Medica Auxologica. 1993;25(3):163–167.
- Loche S, Guzzetti C, Pilia S, et al. Effect of body mass index on the growth hormone response to clonidine stimulation testing in children with short stature. Clin Endocrinol. 2011;74(6):726–731.
- Loche S, Pintor C, Cappa M, et al. Pyridostigmine counteracts the blunted growth hormone response to growth hormone-releasing hormone of obese children. Acta Endocrinol. 1989 May;120(5):624–628.
- Loche S, Pintus S, Carta D, et al. The effect of atenolol on the growth hormone response to growth hormone-releasing hormone in obese children. Acta Endocrinol. 1992;126(2):124–127.
- Loche S, Pintus S, Cella SG, et al. The effect of galanin on baseline and GHRH-induced growth hormone secretion in obese children. Clin Endocrinol. 1990;33(2):187–192. Aug
- Martul P, Pineda J, Pombo M, et al. New diagnostic tests of GH reserve. J Pediatr Endocrinol. 1993;6(3–4):317–323.
- Misra M, Bredella MA, Tsai P, et al. Lower growth hormone and higher cortisol are associated with greater visceral adiposity, intramyocellular lipids, and insulin resistance in overweight girls. Am J Physiol Endocrinol Metab. 2008;295(2):E385–E392.
- Parra A, Schultz RB, Graystone JE, et al. Correlative studies in obese children and adolescents concerning body composition and plasma insulin and growth hormone levels. Pediatr Res. 1971;5(11):605–613.
- Pasquino AM, Bernardini S, Cianfarani S, et al. GH assessment and three years' hGH therapy in girls with Turner syndrome. Horm Res. 1992;38(3–4):120–124.
- Patel L, Skinner AM, Price DA, et al. The influence of body mass index on growth hormone secretion in normal and short statured children. Growth Regul. 1994;4(1):29–34.
- Perotti M, Perra S, Saluzzi A, et al. Body fat mass is a strong and negative predictor of peak stimulated growth hormone and bone mineral density in healthy adolescents during transition period. Horm Metab Res. 2013;45(10):748–753.
- Pertzelan A, Keret R, Bauman B, et al. Responsiveness of pituitary hGH to GRH1-44 in juveniles with obesity. Acta Endocrinol. 1986;111(2):151–153. Feb
- Pintor C, Loche S, Puggioni R, et al. Growth hormone response to hpGRF-40 in different forms of growth retardation and endocrine-metabolic diseases. Eur J Pediatr. 1986;144(5):475–481.
- Pirazzoli P, Mazzanti L, Bergamaschi R, et al. Reduced spontaneous growth hormone secretion in patients with Turner's syndrome. Acta Paediatr. 2007;88(6):610–613. Jun
- Ranke MB, Gruhler M, Rosskamp R, et al. Testing with growth hormone-releasing factor (GRF(1-29)NH2) and somatomedin C measurements for the evaluation of growth hormone deficiency. Eur J Pediatr. 1986;145(6):485–492.
- Reiter JC, Craen M, Van Vliet G. Decreased growth hormone response to growth hormone-releasing hormone in Turner's syndrome: Relation to body weight and adiposity. Acta Endocrinol. 1991;125(1):38–42.
- Rosskamp R, Becker M, Soetadji S. Circulating somatomedin-C levels and the effect of growth hormone-releasing factor on plasma levels of growth hormone and somatostatin-like immunoreactivity in obese children. Eur J Pediatr. 1987;146(1):48–50.
- Singh SK, Agrawal JK, Rai M, et al. Growth hormone response to clonidine in obese children. Indian Pediatr. 1991;28(7):737–740.
- Soliman AT, Rajab A, AlSalmi I, et al. Empty sellae, impaired testosterone secretion, and defective hypothalamic-pituitary growth and gonadal axes in children with Bardet-Biedl syndrome. Metabolism. 1996;45(10):1230–1234.
- Stanley TL, Levitsky LL, Grinspoon SK, et al. Effect of body mass index on peak growth hormone response to provocative testing in children with short stature. J Clin Endocrinol Metab. 2009;94(12):4875–4881.
- Tanaka K, Inoue S, Shiraki J, et al. Age-related decrease in plasma growth hormone: Response to growth hormone-releasing hormone, arginine, and L-dopa in obesity. Metabolism. 1991;40(12):1257–1262.
- Tanaka T. Growth hormone secretion and the therapeutic effects of human growth hormone: first Japanese results of the Kabi Pharmacia International Growth Study/International Cooperative Growth Study. Acta Paediatr Scand Suppl. 1991;379:126–135.
- Thacker MJ, Hainline B, St Dennis-Feezle L, et al. Growth failure in Prader-Willi syndrome is secondary to growth hormone deficiency. Horm Res. 1998;49(5):216–220.
- Topper E, Gil-Ad I, Bauman B, et al. Plasma growth hormone response to oral clonidine as compared to insulin hypoglycemia in obese children and adolescents. Horm Metab Res. 2008;16(S1):127–130.
- Vaccaro F, Cianfarani S, Pasquino AM, et al. Is obesity-related insulin status the cause of blunted growth hormone secretion in Turner's syndrome? Metabolism. 1995;44(8):1033–1037.
- Van Vliet G, Bosson D, Rummens E, et al. Evidence against growth hormone-releasing factor deficiency in children with idiopathic obesity. Acta Endocrinol Suppl. 1986;279:403–410.
- Vanderschueren-Lodeweyckx M, Wolter R, Malvaux P, et al. The glucagon stimulation test: effect of plasma growth hormone and on immunoreactive insulin, cortisol, and glucose in children. J Pediatr. 1974;85(2):182–187.
- Volta C, Bernasconi S, Iughetti L, et al. Growth hormone response to growth hormone-releasing hormone (GHRH), insulin, clonidine and arginine after GHRH pretreatment in obese children: evidence of somatostatin increase? Eur J Endocrinol. 1995;132(6):716–721.
- Weber B, Helge H, Quabbe H-J. Glucagon-induced growth hormone release in children. Acta Endocrinol. 1970;65(2):323–341.
- Wegienka LC, Grodsky GM, Karam JH, et al. Comparison of insulin and 2-deoxy-D-glucose-induced glucopenia as stimulators of growth hormone secretion. Metabolism. 1967;16(3):245–256.
- Yang A, Cho SY, Kwak MJ, et al. Impact of BMI on peak growth hormone responses to provocative tests and therapeutic outcome in children with growth hormone deficiency. Sci Rep. 2019;9(1):16181.
- Yau M, Chacko E, Regelmann MO, et al. Peak growth hormone response to combined stimulation test in 315 children and correlations with metabolic parameters. Horm Res Paediatr. 2019;92(1):36–44.
- Casamitjana L, Giménez-Palop O, Corripio R, et al. Glucagon stimulation test to assess growth hormone status in Prader-Willi syndrome. J Endocrinol Invest. 2021;44(3):621–629.
- Schott DA, Gerver WJ, Stumpel CT. growth hormone stimulation tests in children with Kabuki syndrome. Horm Res Paediatr. 2016;86(5):319–324.
- Roth J, Glick SM, Yalow RS, et al. Hypoglycemia: a potent stimulus to secretion of growth hormone. Science. 1963;140(3570):987–988.
- May J. Obesity and plasma levels of insulin and growth hormone. Nutr Rev. 1965;23:102–104.
- Veldhuis JD, Iranmanesh A, Ho KK, et al. Dual defects in pulsatile growth hormone secretion and clearance subserve the hyposomatotropism of obesity in man. J Clin Endocrinol Metab. 1991;72(1):51–59.
- Langendonk JG, Meinders AE, Burggraaf J, et al. Influence of obesity and body fat distribution on growth hormone kinetics in humans. Am J Physiol. 1999;277(5):E824–E829.
- Conover CA, Lee PD, Kanaley JA, et al. Insulin regulation of insulin-like growth factor binding protein-1 in obese and nonobese humans. J Clin Endocrinol Metab. 1992;74(6):1355–1360.
- Maccario M, Procopio M, Grottoli S, et al. Effects of acipimox, an antilipolytic drug, on the growth hormone (GH) response to GH-releasing hormone alone or combined with arginine in obesity. Metabolism. 1996;45(3):342–346.
- Saitoh H, Kamoda T, Nakahara S, et al. Serum concentrations of insulin, insulin-like growth factor(IGF)-I, IGF binding protein (IGFBP)-1 and -3 and growth hormone binding protein in obese children: fasting IGFBP-1 is suppressed in normoinsulinaemic obese children. Clin Endocrinol. 1998;48(4):487–492.
- Hansen TK, Fisker S, Hansen B, et al. Impact of GHBP interference on estimates of GH and GH pharmacokinetics. Clin Endocrinol. 2002;57(6):779–786.
- Bidlingmaier M, Strasburger CJ. Growth hormone assays: current methodologies and their limitations. Pituitary. 2007;10(2):115–119.
- Rasmussen MH, Hvidberg A, Juul A, et al. Massive weight loss restores 24-hour growth hormone release profiles and serum insulin-like growth factor-I levels in obese subjects. J Clin Endocrinol Metab. 1995;80(4):1407–1415.
- Argente J, Caballo N, Barrios V, et al. Multiple endocrine abnormalities of the growth hormone and insulin-like growth factor axis in prepubertal children with exogenous obesity: effect of short- and long-term weight reduction. J Clin Endocrinol Metab. 1997;82(7):2076–2083.
- Dori EB, Avnon Ziv C, Auerbach A, et al. The inter – test variability of growth hormone stimulation tests and factors affecting this variability. Growth Horm IGF Res. 2020;55:101361.
- Markkanen HM, Pekkarinen T, Hämäläinen E, et al. Gender has to be taken into account in diagnosing adult growth hormone deficiency by the GHRH plus arginine test. Growth Horm IGF Res. 2017;35:52–56.
- Galazzi E, Improda N, Cerbone M, et al. Clinical benefits of sex steroids given as a priming prior to GH provocative test or as a growth-promoting therapy in peripubertal growth delays: results of a retrospective study among ENDO-ERN centres. Clin Endocrinol. 2021;94(2):219–228.
- Barth JH. An evidence-base for laboratory endocrinology? Clin Biochem Rev. 2008;29(3):97–101.
- Reinehr T, Bechtold-Dalla Pozza S, Bettendorf M, et al. Impact of overweight on effectiveness of treatment with human growth hormone in growth hormone deficient children: analysis of German KIGS data. Exp Clin Endocrinol Diabetes. 2011;119(9):544–548.
- Farooqi IS. Genetic and hereditary aspects of childhood obesity. Best Pract Res Clin Endocrinol Metab. 2005;19(3):359–374.
- Kleinendorst L, Abawi O, van der Voorn B, et al. Identifying underlying medical causes of pediatric obesity: Results of a systematic diagnostic approach in a pediatric obesity center. PLOS One. 2020;15(5):e0232990.
- Chihara K, Shimatsu A, Hizuka N, et al. A simple diagnostic test using GH-releasing peptide-2 in adult GH deficiency. Eur J Endocrinol. 2007;157(1):19–27.
- Popovic V. Approach to testing growth hormone (GH) secretion in obese subjects. J Clin Endocrinol Metab. 2013;98(5):1789–1796.
- Henry RK. Childhood growth hormone deficiency, a diagnosis in evolution: the intersection of growth hormone history and ethics. Growth Horm IGF Res. 2020;55:101358.
- Gandrud LM, Wilson DM. Is growth hormone stimulation testing in children still appropriate? Growth Horm IGF Res. 2004;14(3):185–194.
- Yuen KCJ, Biller BMK, Radovick S, et al. American Association of Clinical Endocrinologists and American College of Endocrinology Guidelines for management of growth hormone deficiency in adults and patients transitioning from pediatric to adult care. Endocr Pract. 2019;25(11):1191–1232.
- Müller TD, Nogueiras R, Andermann ML, et al. Ghrelin. Mol Metab. 2015;4(6):437–460.
- EU Clinical Trials Register. Clinical trial results: open label, group comparison, dose escalation trial to investigate safety, tolerability, pharmacokinetics and pharmacodynamics of macimorelin acetate after single oral dosing of 0.25 mg/kg, 0.5 mg/kg, and 1 mg/kg in pediatric patients with suspected growth hormone deficiency (GHD); 2021 [cited 2021 Apr 8]. Available from: https://www.clinicaltrialsregister.eu/ctr-search/trial/2018-001988-23/results
- Wit JM, Bidlingmaier M, de Bruin C, et al. A proposal for the interpretation of serum IGF-I concentration as part of laboratory screening in children with growth failure. J Clin Res Pediatr Endocrinol. 2020;12(2):130–139.
- Schilbach K, Bidlingmaier M. Laboratory investigations in the diagnosis and follow-up of GH-related disorders. Arch Endocrinol Metab. 2019;63(6):618–629.
- Ellis A, Seth J, Al-Sadie R, et al. An audit of the laboratory interpretation of growth hormone response to insulin-induced hypoglycaemia in the assessment of short stature in children. Ann Clin Biochem. 2003;40(Pt 3):239–243.
- Ross HA, Lentjes E, Menheere PP. The consensus statement on the standardization and evaluation of growth hormone and insulin-like growth factor assays lacks a recommendation to attempt efficacious harmonization. Clin Chem. 2011;57(10):1463; author reply 1463–1464.
- Ross HA, Lentjes EW, Menheere PM, et al. Harmonization of growth hormone measurement results: the empirical approach. Clin Chim Acta. 2014;432:72–76.
- Wagner IV, Paetzold C, Gausche R, et al. Clinical evidence-based cutoff limits for GH stimulation tests in children with a backup of results with reference to mass spectrometry. Eur J Endocrinol. 2014;171(3):389–397.