
 ?Mathematical formulae have been encoded as MathML and are displayed in this HTML version using MathJax in order to improve their display. Uncheck the box to turn MathJax off. This feature requires Javascript. Click on a formula to zoom.
ABSTRACT
We review the functionality of sucrose during the manufacture of biscuits from the perspective of sugar replacement. Besides to providing sweetness, sucrose has important functionalities concerning structure and texture formation. These functionalities also need to be mimicked in reformulated biscuits. First, we review the hypotheses concerning the development of structure and texture of biscuits during manufacturing, which are conveniently summarized in a qualitative way using the Complex Dispersed Systems methodology. Subsequently, we represent the changes of the state of the biscuit during manufacturing in the supplemented state diagram, which indicates the important phase transitions occurring during mixing and baking. We propose that when reformulated biscuits follow similar paths in the state diagram, similar structures and textures can be obtained. Physical theories exist for predicting these phase transitions for existing sucrose-rich biscuits and also reformulated biscuits containing extensive sweeteners as sugar replacers. More accurate predictions of structure and texture can be eventually obtained if they are combined with computational models, including heat and moisture transfer.
1. Introduction
In bakery products such as cookies and cakes, sugar is one of the main components, contributing up to 30-40% of the total recipe. Due to increasing health concerns associated with excessive caloric intake and the availability of energy-dense foods, intense scientific research is performed regarding the replacement of sugars with more healthy alternatives. However, the reformulation of confectionery and bakery products with a substantial reduction in sugars has proven difficult due to the multiple functionalities that sugars exert in bakery products, next to simply providing sweetness (Davis Citation1995, Pareyt and Delcour Citation2008, Mariotti and Lucisano Citation2014). Sucrose, the most commonly used sugar in bakery products, has a major impact on phase transitions of biopolymers such as starch and gluten (Kawai et al. Citation2016, van der Sman Citation2016b). It also affects the boiling point of water, and the sorption of water (van der Sman and Meinders Citation2011, van der Sman Citation2013a). Furthermore, the crystalline nature of sucrose contributes to the texture of these products (Pareyt and Delcour Citation2008, Pareyt et al. Citation2009b). Research shows that sucrose cannot simply be replaced by a single compound. Instead, a mixture of compounds must be used to provide the various functions provided by sucrose in the original formulation (Zoulias, Oreopoulou, and Kounalaki Citation2002, Struck et al. Citation2014, Riedel, Böhme, and Rohm Citation2015).
Hence, the first step in an effective sugar replacement strategy is to understand the functionalities of sucrose in the typical product. Ingredient functionality is recently reviewed for sugar-snap cookies and cakes (Pareyt and Delcour Citation2008, Wilderjans et al. Citation2013). Mariotti and Lucisano (Citation2014) have focused on the functionality of sucrose with respect to the reformulation of bakery products in general. In contrast, we focus on the functionality of sucrose in the broader class of biscuits, and its description by qualitative and semi-quantitative tools like the Complex Dispersed System (CDS) methodology, and the supplemented state diagram.
Our premise concerning the replacement of sucrose in biscuits is that the induced sweetness and color can be decoupled from its contribution to structural and textural properties. The sweetening function of sucrose is usually addressed by using small amounts of intensive sweeteners like stevia, while color is largely modulated by the amount of reducing sugars (Struck et al. Citation2014). However, mimicking structural and textural properties requires good knowledge of the role of sucrose in the food structuring process. Therefore, we will pursue a more precise description of the food structuring process of biscuits using the CDS methodology, which is applied earlier to expanded snacks (van der Sman and Broeze Citation2013) and emulsion-based sauces (This Citation2005). Furthermore, a semi-quantitative description of the food structuring process is given via the illustration of the processing pathway in the supplemented state diagram (Slade et al. Citation1993, van der Sman and van der Goot Citation2009, van der Sman and Broeze Citation2013). Our ansatz is that when 1) the food structuring process, as described in CDS, and 2) the processing pathway in the supplemented state diagram can be mimicked by replacers, the sugar can be functionally replaced with a minimal change in biscuit structure and texture.
In this paper we first discuss the basic formulations and the processing steps in biscuit manufacturing. Subsequently, we review the ingredient functionalities and interactions and the physical-chemical transformations occurring during both dough mixing and biscuit baking. Based on this overview, we have captured the evolution in biscuit structure during dough mixing and baking using the CDS methodology. We discuss the quantitative changes in the state of the biscuit system during mixing and baking using the supplemented state diagram. Finally, we propose a sugar replacement approach based on precise control over the important phase transitions, which need to be followed for ensuring unaltered structure and texture properties of biscuits with sugar replacers.
2. Biscuit manufacturing
Biscuits are composed of three main dry ingredients, namely flour, sugar, and fat. Water is supplemented in limited amounts as a solvent, together with other minor ingredients like leavening agents, salt, and emulsifiers. The fat can contain liquid oil and solid fat crystals - which will be distinguished in our discussion on the ingredient functionality. Emulsifiers are often regarded as part of the fat system. Depending on the ratio of flour, sugar and fat, biscuits are distinguished in different categories.
Biscuits are manufactured according to three main processing steps (Pareyt and Delcour Citation2008, Misra and Tiwari Citation2014):
| • | mixing and forming, | ||||
| • | baking, and | ||||
| • | cooling. | ||||
Mixing is one of the critical steps of biscuit making. The objective is to make a cohesive dough that can be sheeted or molded and formed. Gluten should form a minimal network, just sufficient for dough handling and forming. In fact, extensive gluten development is usually undesired for the purposes of sheeting and forming. Therefore, often a soft wheat flour is used, since it contains less gluten than normal flour. After mixing, the dough is allowed to rest in order to make the dough more firm and less sticky (Pareyt and Delcour Citation2008). This is attributed to a more homogeneous moisture distribution, as flour particles need time to take up moisture. A minimum resting of 30 minutes is usually required for gluten hydration (Manley Citation2011). Subsequently, the dough is formed. The method of forming can be different for specific types of cookies: semi-sweet biscuits are usually sheeted, while molding is applied for soft dough biscuits. During sheeting, rollers apply a compressive normal force to make a sheet of dough with a uniform thickness. Subsequently, the specific biscuit shapes are cut from the dough sheet via cutting rollers. Shape retention is dependent on the extent of gluten network formation and the resulting dough elasticity. Sheeting stretches the gluten network in a particular direction, and the shape will tend to relax back in the machining direction. After forming, the next step in biscuit manufacturing is baking. In subsequent order the baking promotes 1) the reaction of chemical leavening agents, 2) the melting of sugar crystals, 3) the aggregation of the gluten proteins, 4) the evaporation of water, and 5) the Maillard and caramelization reactions leading to the browning of the biscuit. Industrial ovens are commonly divided into different temperature zones in order to better control the chemical reactions and/or physical transformations described (Misra and Tiwari Citation2014). Good control of temperature and moisture control are also important. If the surface dries out too much, it becomes too rigid thus preventing the further rise of the biscuit (Cauvain and Young Citation2009). After baking the biscuits enter the cooling tunnel, where there is little further structure development. Due to the lowering of temperature, the biscuits will enter the glassy state - making them shelf stable. Cooling must be done with care. If the cooling rate is too fast, thermal stresses will develop. This leads to fracture of the biscuits (also known as checking) (Kim and Okos Citation1999, Saleem et al. Citation2005). After cooling, the biscuits are packaged and stored under ambient conditions. During storage the recrystallization of sugars can proceed, leading to the increased hardness of the biscuits (Maache-Rezzoug et al. Citation1998, Belcourt and Labuza Citation2007).
Biscuit formulations, ingredients functionalities and physical-chemical transformation involved in the different steps of biscuit manufacturing are discussed in further details in the following sections.
2.1. Biscuit classification based on formulation
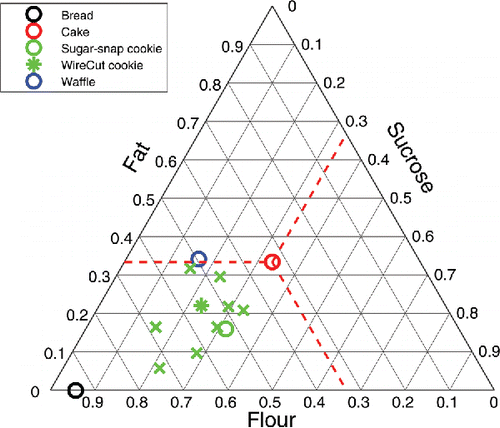
There are three main types of biscuits which are distinguished according to flour, sugar and fat contents: 1) sweet, and semi-sweet biscuits from hard dough, 2) biscuits from short dough, and 3) biscuits from soft dough (Manley Citation2011). The hard-sweet biscuits have sugar and fat contents less than 20% of the amount of flour. In short dough biscuits, sugar and fat content are greater than 20% and can be even up to 100-200% of the amount of flour. Soft dough cookies are very rich in fat (65-75% of flour weight), and egg white can be added. The AACC (American Association of Cereal Chemists) has also listed several cookie recipes as research standards, the so-called wire-cut cookies, and sugar-snap cookies, while various other recipes can be found in the literature. An overview of the different cookie formulations can be conveniently presented in a simplex diagram via depicting their ratio of flour:sucrose:fat (van Steertegem et al. Citation2014), as shown in . For comparison, we have also included bread, cake, and waffles in the diagram. Particularly for cakes, one can expect that common ingredients such as flour, sugar, and fat have similar functionalities (Brooker Citation1993, Wilderjans et al. Citation2013).
Figure 1. Recipes of various bakery products, including biscuits as encountered in literature (indicated with green crosses) (bal, Chevallier et al. Citation2000b, Pareyt and Delcour Citation2008, fus, Moiraghi et al. Citation2011, Laguna et al. Citation2011, Rodríguez-García et al. Citation2013). The wire cut and sugar snap cookie follow the AACC methods. The dashed red lines indicate how the composition of cake can be read from the axis. Observe that these lines run parallel to the one of the axes.
2.2. Dough making, dough structure, and ingredients functionalities
Mixing of ingredients is the main step in dough preparation and it fulfills multiple purposes (Manley Citation2011):
| • | blending the ingredients to a uniform paste, | ||||
| • | dispersion of air into the fat phase of the dough, | ||||
| • | dispersion of the fat phase into the water phase of the dough, | ||||
| • | (partial) dissolution of sugar crystals into the water phase, | ||||
| • | prevention of gluten matrix development, and | ||||
| • | prevention of complete melting of fat crystals. | ||||
There are two main methods by which ingredients are mixed: 1) one method involving a creaming step prior to adding water and flour, and 2) the all-in-one mixing method, where all ingredients are mixed at once. In the creaming step sugar and fat are mixed first, in order to trap and stabilize air bubbles. Due to the absence of gluten during the creaming step, one can use high mixing intensities for the emulsification of the cream. Subsequently, water is added, and finally, the flour and baking powder are added. Sometimes, all ingredients except flour are mixed at once in the creaming step (Manohar and Rao Citation1999). The creaming step is said to give less gluten network formation than the all-in-one method (Manohar and Rao Citation1999). When the latter is used, sugar is usually pre-dissolved in order to prevent excessive hydration of gluten (Manley Citation2011). Investigation of the above mixing methods together with others(Manohar and Rao Citation1999) has indicated that the creaming step method usually renders a better biscuit quality than the all-in-one method.
The process conditions like mixing time, temperature and mixing speed have important consequences for the structure development (Charun et al. Citation2000). Over mixing can promote undesired gluten development. Furthermore, the mechanical energy input must be kept in check, otherwise, the dough can be heated too much via viscous dissipation (Charun et al. Citation2000, Jacob and Leelavathi Citation2007). The latter will lead to melting of the solid fat if the dough temperature rises above 35oC. This is disadvantageous for dough development, since solid fat is said to hinder the development of the gluten network. Often the dough temperature is not actively controlled, but active temperature control can provide opportunities for decoupling the mixing and heating effect. If the dough temperature remains low, higher mechanical energy input can help incorporating air into the dough.
2.2.1. Mixing with creaming step
During creaming air bubbles are incorporated in the mixture of sugars and fat. The fat phase consists of liquid oil and fat crystals, with the oil being the continuous phase. The air phase is dispersed in the oil (Kweon et al. Citation2014), and it is stabilized by sugar and fat crystals via steric hindrance (Brooker Citation1993).
Increasing the amount of fat leads to increased aeration, whereas increasing the sugar level does not influence the aeration (Pareyt et al. Citation2009b). Sugar crystals make fat crystals smaller via abrasion during the creaming step, thus enhancing their stabilizing action on air bubbles and increasing aeration (Hesso et al. Citation2015). The increased aeration is generally reflected in the higher amounts of porosity in the baked biscuits.
Upon addition of water, sugar crystals may remain coated with oil, and thereby hinder the dissolution of sugar (Abboud, Rubenthaler, and Hoseney Citation1985). After subsequent addition of flour, the fat crystals will hinder the formation of the gluten network. Gluten development is further hindered if the flour is mixed with the cream before the addition of water (Maache-Rezzoug et al. Citation1998, Jacob and Leelavathi Citation2007).
Since the creaming method takes two steps, the mechanical energy input is better optimized compared to the all-in-one method. Due to the absence of flour, the mechanical energy input during the creaming step can be considerably higher than in the final step where flour is added. Hence, in the latter the mixing can be minimized, only to obtain a cohesive dough.
2.2.2. All-in-one mixing
In the all-in-one mixing, air bubbles are dispersed in the water phase, in contrast to the creaming method where the air is dispersed in the fat phase. In the water phase, the interface of air bubbles is mainly stabilized by proteins, and not by fat crystals as in the creaming method. In cake batter with all-in-one mixing, the air bubbles are temporarily stabilized by egg proteins (Brooker Citation1993). Biscuit dough does not contain egg proteins, but the gliadin proteins from the gluten fraction of flour do have good foaming properties around neutral pH conditions (Thewissen et al. Citation2011).
In the all-in-one method, the mixing times can range from 90-300 s. This long mixing time promotes a stronger development of the gluten network than in the creaming method, leading to a reduction of biscuit spread and porosity.
2.2.3. Dough structure
Concerning the final structure of the dough, most studies have focused on short dough biscuits and a few different hypotheses have been proposed (Pareyt and Delcour Citation2008). According to Baltsavias, Jurgens, and van Vliet (Citation1999a) short dough structure depends on the fat volume fraction and fat type and it can range from bi-continuous to a hydrophilic continuous matrix in which the fat phase is dispersed. Reducing fat content or replacing solid fat with liquid oil results in fat dispersed systems, while increasing fat content or solid fat content promotes a bi-continuous system (Renzetti, de Harder, and Jurgens Citation2016, Renzetti and Jurgens Citation2016). The bi-continuous structure can be depicted as two interpenetrating continuous phases: one with oil and fat, and the other composed of a sugar solution. Air bubbles and flour particles are dispersed into this system. In practice, the bi-continuous hypothesis holds for high-fat biscuits (Pareyt and Delcour Citation2008, Rodríguez-García et al. Citation2013). At fat levels commonly used in short dough, Chevallier et al. (Citation2002) have described the dough system as a suspension of proteins, starch granules and flour particles in a liquid continuous sugar solution. It is assumed that the lipid phase is emulsified, and thus constitutes a dispersed phase in the sugar solution. However, it must be kept in mind that little water is added and that the sugar solution is composed of both dissolved as well as crystalline sugar. Investigations with confocal microscopy (CSLM) of biscuit dough with high and low fat content confirmed that the dough structures described above are both correct (Rodríguez-García et al. Citation2013). It should be noted that in both cases the hydrophilic continuous phase is a mixture of a sugar solution and an emulsion (Pareyt, Brijs, and Delcour Citation2010).
Contrary to bread and pasta, there is no gluten network giving cohesion to the final dough structure (Chevallier et al. Citation2000a). In fact, gluten only interacts via hydrogen bonds and physical entanglements while no proper network is formed (Pareyt, Brijs, and Delcour Citation2010). Dissolving dough in various solvents can provide information on the contribution of ingredients to the cohesion of dough. When the lipid phase is dispersed in the sugar solution it does not contribute to dough cohesion. Starch granules are partially swollen and remain as a dispersed phase of the dough. Hence, the cohesion of the dough is attributed to the continuous phase of the sucrose syrup. The cohesion is mediated via hydrogen bonds between the syrup phase and the flour particles (Chevallier et al. Citation2000a).
2.2.4. Flour functionality and water partitioning
Wheat flour can be described as a biopolymeric mixture of starch, gluten proteins and some fibers (mostly arabinoxylans). Biscuits from short dough are made from so-called soft wheat flour, with less than 10% of protein. Soft wheat flour is also low in damaged starch and soluble arabinoxylans (pentosans). The low amounts of gluten proteins, damaged starch, and arabinoxylans result in a low water holding capacity of the dough (Kweon et al. Citation2009). During flour milling, some flour particles can be damaged, creating dextrins that can be solubilized, and affect the viscosity of the matrix. Furthermore, during milling of soft wheat, the gluten proteins are easily separated from the starch granules (Pareyt and Delcour Citation2008). Despite being hindered by the low moisture contents and by the high fat content, gluten hydration can considerably contribute to the structure and mechanical behavior of biscuit dough during processing. Similarly, as for gluten and flour particles, the starch granules are also a dispersed phase in the sugar solution. The oil phase can coat the starch granules thus hindering the adsorption of water, leading to less hard and less tough biscuits. However, definitely not every granule is coated with oil and both oil and water compete for access to the starch granule interface, which is probably neutral wetting (O’Brien et al. Citation2003). For a proper understanding of dough structure and mechanical behavior, it is of key importance to know the partitioning of water over the various hydrophilic compounds (starch, gluten, fibers, and sugar). In scientific literature, the partitioning is often investigated via the Solvent Retention Capacity (SRC) method (Kweon et al. Citation2014).
As dough contains multiple hygroscopic ingredients, there is competition for water during mixing. Flour constituents majorly contribute to moisture sorption in the dough. At water activities of 0.6 water sorption capacity of flour constituents can be ranked based on vapour sorption measurements (Roman-Gutierrez, Guilbert, and Cuq Citation2002, Roman-Gutierrez et al. Citation2003), as: water-soluble pentosans > damaged starch > starch > water-insoluble pentosans > gluten. The sorption behavior accounts for the ability of the flour components to establish direct interactions with the water molecules. Based on the analysis of sorption isotherms of hard and soft wheat flours and their constituents, the theoretical distribution of water between flour components was reported as 88% in starch, 10% in gluten and 2% in pentosans (Roman-Gutierrez, Guilbert, and Cuq Citation2002, Roman-Gutierrez et al. Citation2003). Water absorption rates can also play a role in flour and gluten hydration during mixing. For instance, water-insoluble pentosans are characterized by significantly higher values of initial adsorption rates and apparent water diffusion coefficients compared to the other wheat flour constituents (Roman-Gutierrez et al. Citation2003). These components can be thus considered as a critical wheat component during hydration of wheat flour and they may behave as transient water containers during mixing. On the contrary, ingredients present in their crystalline form such as sugars do not initially absorb water. However, they are expected to dissolve slowly due to the limited amount of water. Their dissolution rate is strongly dependent on crystal grain size, and the amount of water added to the dough (Kweon et al. Citation2009, ;Citation2014).
In the conditions of liquid hydration as in the biscuit dough, the hydration of the flour components may depend not only on their sorption behavior but also on their ability to trap water inside swelling macromolecular networks. For such reasons, the interaction of polymeric dough constituents with water is often characterized via the Water Holding Capacity (WHC or Solvent Retention Capacity). Recently, it is shown that WHC of many food materials can be described by Flory-Rehner theory (van der Sman Citation2012, van der Sman et al. Citation2013, van der Sman Citation2015), which shows that in addition to moisture sorption behavior, the elastic properties of macromolecular networks is also of importance for WHC.
WHC can be considered as a measure for the hydration of the flour and its components, including gluten. Consequently, it can have a strong correlation with the rheology of the dough (Baltsavias, Jurgens, and van Vliet Citation1999b) and with its baking behavior. In fact, WHC correlates well with the biscuit spreading, even better than rheological measurements (Duyvejonck et al. Citation2011). The WHC can be influenced via the choice of flour type (either soft or hard), and intensity of milling. Furthermore, the addition of soluble fibers increases the WHC of the dough (Villemejane et al. Citation2013), and thus the hydration and development of gluten network. Upon addition of fibers, more water needs to be added to obtain similar rheological properties as a reference dough.
2.2.5. Sugar dissolution
Dissolved sugars will thermodynamically interact with the hydrophilic biopolymers, influencing their WHC. If their dissolution is sufficiently slow, part of the water will be absorbed by starch, gluten, and pentosans (arabinoxylans). The dissolved sugars impart the viscosity and mobility of water, thus influencing the kinetics of gluten hydration. In the all-in-one mixing method, sugars can be pre-dissolved in water, instead of added in crystalline state (Kweon et al. Citation2014), strongly limiting the gluten development. Other factors which control the hydration rate of gluten are the temperature of the added water (which can be ice cold) (Kweon et al. Citation2009, ;Citation2014) and the pH of the dough, which can change due to the action of leavening agents (Kweon et al. Citation2014).
Reports on the sugar dissolution in the dough are contradicting. While Chevallier et al. (Citation2000a) has detected with calorimetry (DSC) that all sugars are dissolved, Abboud and Hoseney (Citation1984) do show that crystals are present . However, this can be explained by differences in the ratio of flour:sugar:water. In the formulation of (Abboud and Hoseney Citation1984) the sugars cannot fully solubilize, on the other hand, thermodynamics allows for the sugars to be fully dissolved in the formulation investigated by (Chevallier et al. Citation2000a). At any rate it is evident that dissolution of sucrose during mixing takes time, and thus it influences the hydration and development of gluten (Kweon et al. Citation2009). The dissolution is so slow that local sugar concentrations remain high, which leads to sugar recrystallization during baking (Chevallier et al. Citation2000a). Current investigations using the thermodynamics of the Flory-Huggins theory imply that sugars do not mix with ungelatinized starch granules. Hence, sucrose remains in the extragranular continuous phase.
2.2.6. Hydrophobic phase functionality
Fat exerts two main functions in the development of biscuit dough structure during mixing: 1) it competes with water for the flour surface, thus hindering gluten network development; 2) it enhances air inclusion in the dough, thus modulating density. The fatty-acid composition as well as their position in the triglyceride molecule, crystal structure, polymorphism, solid fat content (SFC), and processing conditions determine the physical properties of the fat and consequently its functionality (Renzetti, de Harder, and Jurgens Citation2016, Renzetti and Jurgens Citation2016). SFC and the crystal structure of the solid fat are particularly important for the biscuit dough structure. In plastic shortenings, the particle crystal network stabilizes the oil phase and is directly responsible for the mechanical behavior (plasticity) of the fat. For such reasons, fats for bakery applications are generally characterized in terms of SFC as a function of temperature. Plastic behavior is observed when the SFC is about 20-30%. In order to provide the dough with the desired consistency while limiting the amount of water required, the SFC needs to be in this range at the mixing temperature conditions of the dough (which can be raised by the mechanical energy input). Increasing SFC leads to a finer dispersion of the fat phase, enhancing the coating of the gluten network (Sciarini et al. Citation2013), thus limiting shrinkage after lamination. However, it should be kept in mind that mixing induces structural changes to the particle network of fat crystals. Hence, both SFC and the work of mixing (softening the dough) largely determine fat functionality in the mixing stage (Renzetti, de Harder, and Jurgens Citation2016, Renzetti and Jurgens Citation2016). The melting point of the solid fat fraction is also an important property of the shortening. If the melting point of the fat is too high, combined with a high SFC, the fat crystals remain aggregated, which will render a stiff dough.
Fat plasticity also modulates air inclusion during creaming. A mixture of liquid and solid fat at the temperature of mixing is essential to enhance aeration. If SFC is too high, there is too little oil for air incorporation or coating of the gluten (Brooker Citation1993, Jacob and Leelavathi Citation2007). Furthermore, oil coating of proteins enables fat crystals to attach to air bubbles, thus providing a reserve of interfacial material during baking (Brooker Citation1993). The type of fat crystal also influences the aeration of the cream. The smaller β′ polymorphs provide better aeration with smaller bubbles than the large β polymorphs (Brooker Citation1993).
2.2.7. Summary of sucrose functionality during dough mixing stage
The above description of biscuit dough structure and mixing indicates a central role of the sugar solution in modulating dough biscuit properties. It is shown to have multiple functionalities by interacting with the different dough components during the various steps of dough mixing. We summarize the reported functionalities in , together with references supporting this functionality.
Table 1. Sugar functionality during mixing.
2.3. Biscuit baking
2.3.1. Baking objectives
The baking step during the manufacturing of biscuits has the following objectives (Chevallier et al. Citation2002, Pareyt and Delcour Citation2008, Misra and Tiwari Citation2014):
| • | generation of blowing gas CO2 by the leavening agents, | ||||
| • | generation of the foamy structure of the biscuit (via bubble expansion), | ||||
| • | spreading of the expanding biscuit, | ||||
| • | fixation and stabilization of the resultant porous structure of the biscuit, | ||||
| • | removal of moisture, acting as blowing gas and plasticizer, and | ||||
| • | browning of the biscuit. | ||||
To attain the above objectives several chemical and physical transformations must occur during baking (Chevallier et al. Citation2002, Pareyt and Delcour Citation2008, Misra and Tiwari Citation2014). We have listed the transitions in more or less subsequent order, following on the evolution of biscuit dough temperature as a function of baking time (see also ):
| • | melting of fat, Figure 2. Structure development in biscuits during various stages of baking, associated with physical/chemical transitions. Dough structure at end of mixing is elaborated based on insights from dough making, Section 2.2. 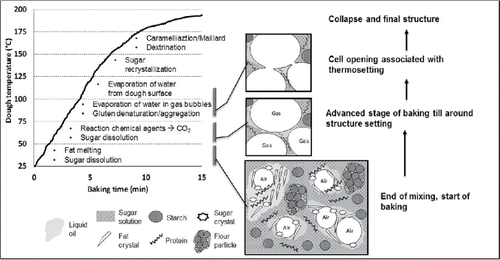 | ||||
| • | further dissolution (melting) of sucrose crystals, | ||||
| • | reaction of chemical leavening agents with water, generating CO2, | ||||
| • | evaporation of water into expanding gas bubbles, | ||||
| • | denaturation/aggregation of gluten proteins, | ||||
| • | slight partial gelatinization of native starch, | ||||
| • | bubble wall rupture and coalescence, | ||||
| • | collapse of foam due to depletion of leavening agents and/or moisture, | ||||
| • | recrystallization of sugar, | ||||
| • | hydrolysis of sucrose into glucose and fructose (reducing sugars), | ||||
| • | browning of surface via Maillard reaction and caramelization, and | ||||
| • | starch hydrolysis (dextrination). | ||||
As a result of these physical and chemical transformations, the crispy/crunchy solid foam structure typical of biscuits is obtained. We suppose that the foamy structure develops in a similar way as in bread (Babin et al. Citation2006), following three stages: 1) free growth of individual bubbles, 2) bubble interaction, and 3) prevalent coalescence. In the first stage, the bubbles are small and spherical and have relatively thick walls. The growth of individual bubbles is independent of each other. The first stage ends when the bubbles touch upon each other, and their shape deviates from the spherical shape and becomes more hexagonal. The bubble walls are quite stretched and thin. Depending on the development of the gluten, the wall stretching will be countered by strain hardening. Upon reaching structure setting temperatures, the bubble wall will rupture, and then the bubbles coalesce. In general, biscuits have quite an open pore structure, indicating extensive bubble coalescence (Pareyt and Delcour Citation2008). During biscuit baking, these three steps are part of the whole collection of the physical and chemical transformations associated with the baking process. In , we have explicitly depicted these three stages of foam formation.
The first stage of the baking process starts with the growth of individual bubbles, originating from the pre-existing air bubbles, and which are included in the dough during the mixing stage. The initial air bubbles present in the dough are expanded via leavening gases (CO2 and NH3) and water vapor.
At this early stage of bubble formation, sucrose crystals still present in the dough start dissolving as the result of the increasing temperature and the addition of water on the dough surface via condensation (Chevallier et al. Citation2002). Fat melting also occurs at this stage until temperatures around 55oC are reached, at which point all fat is turned into liquid oil. The melting process is not influenced by other ingredients in the dough (Chevallier et al. Citation2000b). The melting fat enhances the viscous behavior of the dough as compared to the elastic properties, which causes the spreading of the biscuit. Concomitantly, sugar crystals dissolution exerts two functionalities: 1) it increases the solvent volume (i.e. the solvent being the water-sugar solution), which contributes to biscuit spreading; 2) it increases the viscosity of the solvent.
During the expansion stage, the bubbles are isolated and fat and sugar melting precedes the bulk of bubble expansion. The gases have to diffuse through the aqueous matrix into the expanding bubbles. Hence, the bubble growth can be kinetically retarded by dissolved sugar (via enhancing viscosity and thus diffusion coefficient) and fat (serving as a gas diffusion barrier). Sucrose does not influence the chemical leavening reaction thermodynamically (Chevallier et al. Citation2000b).
Further, into the baking process, the expanding foam structure undergoes a thermosetting transition which largely contributes to the fixation of the porous structure and which is usually referred to as Tonset (Chevallier et al. Citation2000b). In literature, it has been debated which mechanism controls the setting of the dough (Slade et al. Citation1993, Chevallier et al. Citation2002, Pareyt and Delcour Citation2008). This setting of the matrix has been mistakenly associated with an ”apparent” glass transition (Slade et al. Citation1993). Instead, recent experimental evidence shows that gluten denaturation and aggregation are the actual cause and the thermosetting transition is more appropriately viewed as a gelling transition (Pareyt and Delcour Citation2008). In fact, the aggregated gluten forms a continuous network with some elasticity (Pareyt, Brijs, and Delcour Citation2009a; Citation2010).
Experimentally, it is found that during dough setting the amount of insoluble protein rises fast at temperatures above 85oC, which is the thermosetting temperature of gluten at the moisture content of the dough (Chevallier et al. Citation2002). This rise in protein insolubility is explained by the aggregation of gluten via disulfide bonds. Furthermore, via enzymatic hydrolysis, it is found that starch granules have swollen to a certain degree, especially in the center of the biscuit where moisture content remains (relatively) high compared to the surface. Microstructural investigation with polarized microscopy has indicated that starch granules at the center of the biscuit have lost their birefringence (Chevallier et al. Citation2002).
Similarly to bread baking, the thermosetting of the dough is accompanied by cell opening leading to the partial rupture of the cell walls. The cell opening allows the water vapor enclosed in the bubble to escape, thus limiting moisture condensation upon cooling and preventing the foam structure from collapsing. Cell opening is promoted via structural inhomogeneities, such as hydrophobic fillers (van der Sman Citation2016a). After denaturation, the gluten proteins become more hydrophobic, lowering the adhesion of the matrix to the flour particles. It is also argued that the partial gelatinization of starch is involved in the setting/partial cell rupture, as it acts as a water sink and a structural inhomogeneity (Chevallier et al. Citation2000a).
Upon setting, the cellular biscuit matrix can still deform, because it is not yet in the glassy state but still in a gel state. Typically, the biscuit dough reaches a maximum in height after Tonset (Chevallier et al. Citation2000b), followed by a decrease in height due to loss of moisture via evaporation and cell opening. In literature, this decrease in height has been named collapse, but it is not as sudden as normal collapse phenomena as discussed in physics. Collapse happens due to depletion of blowing agents, as the matrix is still rubbery and too weak to support its own weight. The degree of gluten polymerization via disulfide cross-linkages largely modulates the level of collapse (Pareyt, Brijs, and Delcour Citation2010). Despite of the gluten network in the dough being undeveloped, a gluten network is formed at this stage of the baking process. The thermosetting of this gluten network largely controls the final biscuit structure.
In the final stages of baking, following dough thermosetting and cell opening, the decrease in moisture content, particularly at the surface, favors two physicochemical transformations: 1) partial recrystallization of sugar, which has been associated with surface cracking (Pareyt et al. Citation2009b) and 2) sucrose hydrolyzation into glucose and fructose (invert sugar). Surface cracking can already arise in the stage of collapse (Manley Citation2011).
Sucrose hydrolysis provides reducing sugars for Maillard reactions and thus browning of the surface. At this stage, caramelization can also contribute to browning (Chevallier et al. Citation2002). Some authors also report that starch hydrolysis (dextrination) can take place during the last stages of baking (Chevallier et al. Citation2002). However, it should be noted that at temperatures around 120oC, the moisture content in the biscuit is low, which would limit hydrolysis. Low moisture content raises the glass transition temperature, which hinders the hydrolytic reaction kinetically.
Upon cooling, the final biscuit structure is set, following a transition to the glassy state of the sugar-water matrix (Slade et al. Citation1993). There is debate among authors regarding the description of the final biscuit structure. Some authors depict it as a composite matrix of protein aggregates, lipids and sugars embedding starch granules, but without an extended gluten network (Chevallier et al. Citation2000a) (Manley Citation2011). In their opinion, biscuit structure is held together by a continuous phase of molten sugars. Others suggest the formation of a protein network as result of the baking process, as supported by microstructural investigation with cryoSEM showing starch granules embedded in a continuous protein matrix of denatured proteins (Rodríguez-García et al. Citation2013). Likely, both descriptions are valid and variations in biscuit composition and processing conditions contribute to the observed differences in the final biscuit structure.
2.3.2. Ingredient functionality and interactions during baking
Following the physical and chemical transformation associated with the different stages of baking, the present section aims to provide further details on the contribution of ingredient functionalities and particularly their interactions on biscuit structure formation. Given the prime focus of the review, an overview of sugar functionality and its interactions in the matrix is provided at the end to highlight the key aspects related to the baking process.
In the early stages of baking associated with bubble expansion, a primary function of the melting fat is to limit bubble coalescence, by forming an oily layer in between the air and water interface (Brooker Citation1993, Chevallier et al. Citation2000b). For achieving optimal functionality, it is important that the fat melting temperature profile is in the same temperature range where the gas bubbles expand due to leavening agents. As the expanding bubble interface grows larger, the melting crystals will provide new material to coat the interface. The expanding bubble interface increases its contact with the aqueous phase, and the remaining oil will form droplets in the water phase. As previously reported, it has been suggested that the oil layer coating is also a barrier to diffusion of the leavening agents into the bubbles (Chevallier et al. Citation2000b). However, Pareyt et al. (Citation2009b)have not found any evidence that fat hinders the biscuit rise via interaction with leavening agents. The barrier function of oil probably depends on its continuity, which depends on the level of fat and oil (Baltsavias, Jurgens, and van Vliet Citation1999a). Before thermosetting conditions are reached, the contribution of fat in modulating biscuit spread is generally reported as a relevant functionality during baking. Increasing fat content increases spread (Pareyt et al. Citation2009b), which in turn leads to a linear increase in spreading with decreasing gluten level (Pareyt and Delcour Citation2008). Hence, the contribution of fat to spread can be better understood in relation to its influence on gluten proteins. During fat melting, oil coating of the flour particles is enhanced, but still, not all flour particles are coated. Due to its coating property Wade (Citation1988) views the fat as part of the protein-starch system. Reduction of the fat level leads to an increase in the elasticity of the dough and biscuit, resulting in reduced spread (Pareyt et al. Citation2009b). The fat hinders the entanglement of the gluten proteins and consequently contributes to modulate dough rheology. However, fat does not influence the setting temperature of the gluten (as it is not hygroscopic) (Pareyt, Brijs, and Delcour Citation2010). An additional indirect effect of fat on spreading can be related to air incorporation in the dough. Increased fat level also means increased incorporation of air during creaming, which leads to an increase in the porosity of the baking biscuit (Pareyt et al. Citation2009b). Increased incorporatio of air bubbles mean a decreased total viscosity of the dough, leading to enhanced spreading (Jacob and Leelavathi Citation2007).
Together with fat melting, sugar dissolution during baking contributes to enhancing the viscous behavior of the dough by increasing solvent volume. In fact, the rate of spreading, final diameter and height of biscuit and the setting time linearly increase with sugar level (Pareyt et al. Citation2009b). It is also accompanied by a higher oven rise and more profound collapse.
The spreading and expansion process is completed when the temperature reaches the condition for gluten thermosetting. It is the primary function of gluten to enable setting of the expanding dough. Gluten aggregation will increase the viscoelastic properties of the dough and stiffens it (Pareyt, Brijs, and Delcour Citation2010). Ath this point, the gas bubbles will not expand anymore. Moreover, it is assumed that cell opening (partial rupture of the bubble via a small hole in the cell wall) is promoted by the gluten aggregation. Setting time does not depend on gluten level. On the contrary, dough setting is mainly related to the gluten denaturation temperature, which is modulated by moisture content and dissolved sugar. Sugar influences the thermodynamic phase transitions of gluten and starch (Chevallier et al. Citation2000b, Kweon et al. Citation2009, van der Sman Citation2016b) and thus the setting of the dough. Increasing sugar content increases protein and starch melting temperatures while increasing water content decreases it (van der Sman Citation2016b). Also, the sugar level influences its own dissolution. For most biscuit types it holds that the sugars are fully dissolved at the moment of gluten/starch transitions (Chevallier et al. Citation2000b).
At the end of baking the moisture content has become so low, that the sucrose syrup forms a viscous supersaturated solution (Belcourt and Labuza Citation2007). If the water in the syrup has sufficient mobility, and in absence of crystallization inhibitors like raffinose, then the sucrose can recrystallize. The influence of sucrose crystallization on surface cracking has been the subject of debate. While Slade et al. (Citation1993) have attributed cracking to collapse of dough, it is now recognized to be due to sugar recrystallization (Pareyt et al. Citation2009b). Research has shown that increased addition of sugar promotes more cracking. The sugar crystals are probably initiation sites for fractures. If the surface is dried out and near the glassy state, and the interior is expanding or contracting (during collapse) - the surface can only yield via fracturing, which can dissipate the stress build up due to expansion (Pareyt and Delcour Citation2008). The recrystallization also liberates water for hydration of other compounds in the formulation and contributes to the final structure setting of the biscuit (Belcourt and Labuza Citation2007).
2.3.3. Summary of sucrose functionality during baking
From the above discussion we have summarize all sugar functionality regarding the transformation during baking and its interactions within the dough matrix in , along with the main literature references.
Table 2. Sugar functionality during baking.
Table 3. Symbols used in the CDS formalism.
2.4. Biscuit quality
To further understand the importance of ingredient functionality and interactions during biscuit making, it is important to capture the most relevant quality parameters of biscuits. The important sensorial traits of biscuits are colour, aroma, taste, visual appearances of surface and cross-section (after breaking), and textural attributes like firmness, crispiness, and dryness. It is often assumed that the textural quality is correlated to physical measurements like spread and fracture strength, as obtained via bending tests (Manohar and Rao Citation2002, Laguna et al. Citation2012, ;Citation2013). Hence, many studies use the physical factors as textural quality indicators. These physical factors comprise of spread, volume, shape retention, hardness, crispiness, color and surface cracking. We have shown in the previous sections, that sugar contributes to all these quality factors (Pareyt et al. Citation2009b).
In terms of morphology, the important geometric properties measured for baked biscuits are their diameter (relating to spread), the ratio of width to length, and height. Spreading during baking is desired, as it leads to thin crispy biscuits. In practice, spread is taken as the main quality indicator, since it correlates with the elastic recovery of the dough, i.e. gluten development. Also, the asymmetry in length and width is an important factor, as in sheeting elastic dough renders oval-shaped biscuits, due to elongation of the gluten network. The height is more determined by the amount of generated leavening gas, and the collapse of dough during baking.
In terms of texture, a distinction should be made between biscuit hardness and fracture strength. Biscuit hardness is generally instrumentally measured by a 3 point bending test. It provides information regarding the maximum force at fracture. Next, to the biscuit strength, its hardness is modulated by both dimensions and structure and it is strongly influenced by the height of the biscuit (Manohar and Rao Citation2002). Instrumental hardness can be related to the perceived hardness during the first bite.
On the contrary, fracture strength is a dimension independent property of the material, which is largely controlled by structure and composition (Baltsavias, Jurgens, and van Vliet Citation1999c, Renzetti and Jurgens Citation2016). Specifically, modulating factors are 1) volume fraction of air, 2) volume fraction of fat, 3) morphology of the cellular structure (i.e. cell wall thickness and anisotropy) 4) sugar recrystallization, 5) hydration of gluten, 6) amount of starch granules.
When the amount of total fat is reduced, one observes an increase of the elastic modulus and fracture stress. The correlation between biscuit porosity and total fat content might play an important role. Variation of fat/sugar levels combined with X-ray tomography analysis shows that air incorporation is mainly determined by fat levels (Pareyt et al. Citation2009b). However, no correlation is found between porosity and bubble size, or number of bubbles (Pareyt et al. Citation2009b). Increasing fat levels enhance the number of aerated bubbles in the dough, which results in larger porosity and final cell size in the baked cookie. High porosity is associated with biscuits which are easier to fracture (Baltsavias, Jurgens, and van Vliet Citation1999c). The amount of spreading, as modulated by fat levels, also influences the shape and direction of bubbles. Fat also influences the strength of the cell walls (Pareyt et al. Citation2009b) and make the biscuit more friable by coating the starch granules (Maache-Rezzoug et al. Citation1998). On the contrary, sugar levels have no influence on the number of bubbles, but via their modulation of the dough viscosity, they influence the growth of bubbles, and thus the bubble size distribution.
The glassy sucrose syrup is also thought to determine the strength of the matrix, which is modulated by various fillers, namely sugar crystals, oil droplets and starch granules. It is assumed that sugar crystals do not initiate fractures, as the hardness of starch granules and sugar crystals are comparable to glassy sucrose. Instead, fat and air cells can be regarded as soft fillers, where fracturing can initiate. Undissolved sugar crystals and sugar recrystallization give a more crumbly, crispy texture (Kweon et al. Citation2009) (Pareyt and Delcour Citation2008). According to some authors, the cohesion in the biscuit matrix and hence the modulation of its texture is controlled via hydrogen bonding of various compounds (Slade et al. Citation1993). Recrystallization imparts cohesion and also liberates water, that will lower the crispiness. Yet, Baltsavias, Jurgens, and van Vliet (Citation1999c) relate biscuit texture to the glassy state of the syrup matrix, and not to recrystallization.
As previously indicated, dough composition and mixing conditions strongly influence the extent of protein polymerization and network formation during baking. While Chevallier et al. (Citation2000b) have stated that gluten network does not modulate biscuit texture, others have suggested that biscuit texture is sensitive to the association of wheat proteins (Gaines Citation1990). More recently, Pareyt, Brijs, and Delcour (Citation2010) have demonstrated that biscuit break strength is modulated at the molecular level by the extent of gliadin-glutenin cross-linking, as observed in presence of reducing and oxidizing agents. Sugars are likely to contribute to this process by controlling the partitioning of moisture in the biscuit matrix and hence affecting the level of gluten hydration. In fact, an increase of sucrose leads to softer cookies (Pareyt et al. Citation2009b).
Biscuit color is mainly related to the amount of browning during baking, which is modulated by the level of dissolved reducing sugar, but also by the amount of water (diluting the reagents) (Chevallier et al. Citation2002). Leavening agents must be fully volatilized when browning occurs because the pH can change the browning reactions. Low acid conditions promote browning, while basic conditions (high pH) inhibit browning (Gökmen et al. Citation2008).
3. CDS methodology and state diagram approach
Due to the multiple functionalities exerted by sugar in biscuit manufacturing, it is important to capture the main transformations and changes in food structure during the various processing stages. This is due to the fact that food structure is one of the most important properties that control the mechanical behavior and textural sensory quality of food (van der Sman and van der Goot Citation2009, Renzetti and Jurgens Citation2016). CDS, the Complex Dispersed System terminology (This Citation2005), has already shown its value in describing the functionality of ingredients in potato-based expanded snacks (van der Sman and Broeze Citation2013). We apply it here to describe the evolution of biscuit structure and capture the related sugar functionalities.
With CDS the structure of the system will be indicated with several symbols, extending the notation commonly used for emulsions. O/W means oil dispersed into water. Hence, ’/’ will be used be denote a dispersion such as D/C, with D the dispersed phase, and C the continuous phase. Materials which are at the interface between different phases are indicated with the ’@’ symbol, meaning stabilized by or enclosed by. (O@Z)/W, means oil droplets stabilized by emulsifier (Z) dispersed into water. Several materials are soluble in a liquid phase, for which we will use ’+’, meaning mixed with. Hence, W + C represents a sugar solution. According to one hypothesis in high-fat cookies, the fat phase and water phase are bicontinuous. This will be indicated by the symbol ’||’, with (F/O)||(W + C) meaning the fat phase (with fat crystals (F) dispersed into liquid oil O parallel to a sugar solution W + C.
We will use the following symbols for the ingredients in the biscuit: C=sugar, S=starch, P=protein, O=oil, F=fat, W=water, V=vapour, A=air, G=leavening gas, R=leavening reagent (). Sugar and starch can be in the crystalline state, which will be indicated with the suffix, Cx, Sx. In the dry flour, the native starch is embedded in the endosperm protein structure, which will be denoted as Sx@P. The protein will denature during baking, which will be indicated via a suffix: Pd. Some of the liquid fat can be replaced by emulsifiers (Misra and Tiwari Citation2014), but in our CDS notation, we will not make a distinction between them. Salt is also added, and various other minor ingredients. We will view them as part of the aqueous solution W.
3.1. Structure formation during mixing with creaming step
We capture here the dough structure formation process by means of CDS, following the description of dough mixing with the creaming step. In the first step of creaming, crystalline sugar Cx, and shortening O/F are mixed, with the incorporation of air A. As a result, air bubbles, fat crystals, and sugar crystals are dispersed in the liquid oil phase, with the air phase stabilized by fat and sugar crystals by steric hindrance ():(1)
(1) Next, water (W) and leavening agents (Rx) are added. The leavening agents are often crystalline, but dissolve fast:
(2)
(2) Part of the crystalline sugars dissolve in water, but this is a slow process. Hence, crystalline sugars remain in the oil phase. Air bubbles remain stabilized by fat and sugar crystals and they remain dispersed in the oil phase (Brooker Citation1993). Overall, the hydrophobic phase is dispersed in the water-sugar solution.
In the final step flour is added. Wheat flour can be described as a mixture of endosperm particles, isolated proteins and starch granules (Sx@P+Sx + P). For simplification, we assume that in soft wheat flour proteins and starch granules are fully separated during milling (otherwise, the endosperm particles, Sx@P, can be added to or can replace the isolated proteins):(3)
(3) Due to slow dissolution of sugars part of the added water can hydrate the proteins (denoted as W/P). A significant part of the proteins remains unhydrated due to coating by the oil phase (denoted as protein phase dispersed in the oil phase). The oil phase, starch granules and hydrated proteins are viewed as dispersed phases in the liquid continuous sugar solution (Chevallier et al. Citation2002). Part of the sugar crystals is still dissolving. The cohesion of the dough is rendered by hydrogen bonding between hydrophilic compounds in the continuous phase: (Sx + W/P)/(W + R + C). The final dough structure corresponding to the CDS description is schematically depicted in .
3.2. Structure formation during baking of biscuits in CDS notation
The transformations and structure development during the baking stage, as discussed above, are summarized below by means of CDS. The starting material is the short dough obtained at the end of the mixing stage:(4)
(4) As depicted in , in the first baking stages the sugar crystals dissolve and fat crystals melt (F → O). At this stage, the air bubbles are only coated with the liquid oil. The flour proteins (or alternatively the endosperm particles, Sx@P) are still dispersed in the oil phase:
(5)
(5) When the dough temperature reaches 60oC, there is a large production of the leavening gas (G), which diffuses towards the air bubbles, resulting in expansion. Simultaneously, moisture from the dough is evaporating, filling the bubbles with water vapor V. The enlarged bubbles are stabilized by a coating of the hydrophobic phase, the oil and the proteins from the wheat flour:
(6)
(6) Once temperatures in the range of 80-90oC are reached, the gluten proteins start to denature and aggregate to a continuous network around the gas bubbles. The bubbles will partially rupture, allowing the gases to escape. The possible partial gelatinization of the starch is excluded from our description. Hence, starch granules are assumed to remain in the native state: Sx. The open cellular structure which is formed at this stage is assumed to be refilled with air A (i.e. the gas atmosphere of the baking oven). The open cellular structure is now also a continuous phase, giving the biscuit a bi-continuous structure:
(7)
(7) After the gluten setting the structure of the biscuit does not change much. Due to the rising temperature, the biscuit will lose moisture and might collapse. Upon cooling several phase transitions will occur, namely the (possible) recrystallization of sugar and fat, and the glass transition of the continuous phase of the sugar syrup W + C → Cg. (The water bound in the glassy matrix is commonly not denoted in CDS). The latter will make the biscuit structure stable under shelf-life conditions.
(8)
(8)
3.3. Dough making and biscuit baking in the supplemented state diagram
Understanding biscuit structure formation during manufacturing is greatly enhanced if the evolution of the state of the biscuit is plotted in the supplementary state diagram (Slade et al. Citation1993), similar to what we have done for expanded starchy snacks (van der Sman and Broeze Citation2014a, ;Citation2014b). In such diagrams, the glass transition and all phase transitions like freezing, boiling, and gelatinization are plotted. The supplemented state diagram is a useful tool, because 1) during phase transitions like boiling the state of the food system follows the phase transition line, and 2) the phase transition lines often bound regions, where the food system shows different structures during its manufacturing (van der Sman and van der Goot Citation2009).
Based on the above review of the dough mixing and baking processes, the following phase transitions are useful to include in the supplemented state diagram:````
| • | the dissolution of sucrose crystals, | ||||
| • | the protein denaturation/aggregation, | ||||
| • | the start/end of starch gelatinization, | ||||
| • | the (re)crystallization of sucrose, and | ||||
| • | the glass transition of the matrix. | ||||
During mixing and baking fat melting can occur. However, the fat melting process is independent of moisture level and it does not influence other phase transitions. Hence, it is not useful to plot fat melting in the state diagram. Furthermore, during biscuit baking, the boiling point of water is often not reached and leavening agents are sufficient for bubble growth (Baldino et al. Citation2014).
Due to the fact that both moisture content and the amount of dissolved sugar are changing during dough making and baking, one cannot plot the supplemented state diagram for the biscuit system as a 2-D graph. However, by decoupling the dough mixing and baking stage, together with some simplifying assumptions, we can sketch two supplemented state diagrams for each stage. In the mixing stage we assume that the moisture content remains constant, and only the amount of dissolved sugar changes. While in the baking stage we assume that all sugars are dissolved, and only the moisture content changes. This assumption is likely to hold for temperatures above 75oC, which is just below the gluten setting temperature.
For the mixing stage, the supplemented state diagram is assumed to resemble starkly that of the pure sucrose/water system (Slade et al. Citation1993), as shown in . The melting behavior of sugar and potential replacers directly depend on physical properties such as melting point and enthalpy of melting (dissolution) (van der Sman Citation2017). The melting of sugar has some dependence on the (water) activity of the matrix, as shown for the case of sucrose in its state diagram (). It is constructed following the Flory-Huggins theory (van der Sman Citation2017). We have also included experimental data of the sucrose phase transitions available from literature(Roos and Karel Citation1991, Lerici, Piva, and Rosa Citation1983, Catte et al. Citation1994, Blond et al. Citation1997, Gaïda, Dussap, and Gros Citation2006, Starzak and Mathlouthi Citation2006).
Figure 3. a) Supplemented state diagram of sucrose, showing phase transitions and glass transition temperatures as function of mass fraction of water yw, and b) Supplemented state diagram of flour showing phase transitions as function of effective volume fraction of plasticizers φw, eff. Processing pathways are indicated with arrows in both state diagrams.
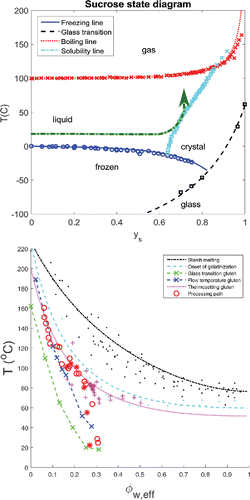
For the baking stage, the phase transitions related to the main biopolymers in the flour, i.e. gluten and starch will be depicted in the state diagram. It is suggested that the supplemented state diagram of flour resembles that of the starch/water system (Cuq, Abecassis, and Guilbert Citation2003, van der Sman and van der Goot Citation2009, van der Sman and Meinders Citation2011), with the thermosetting of gluten following the onset of starch gelatinization, but at several degrees Celsius lower (van der Sman and van der Goot Citation2009). It should be noted that the state diagram usually describes the phase transitions of a biopolymer in a binary system with water as solvent. In the biscuit dough, the aqueous solution comprising water and solutes such as sugars and sugar replacers should be accounted as the total solvent. The properties of such solvent to act as plasticizer and solvent for biopolymers relate to the number of hydroxyl groups available for intermolecular hydrogen bonds, NeffOH (van der Sman Citation2013b). Therefore, the volume fraction of water φw in the state diagram is better replaced by an effective volume fraction of the total solvent, φw, eff, composed of the mixture of water and sugars (van der Sman Citation2016b).
Based on these considerations, the state diagram for the baking stage in has been constructed to include 1) the onset of starch gelatinization, 2) the end of melting for starch, 3) the glass transition of gluten, 4) the flow temperature of gluten and 5) the thermosetting of gluten. In the state diagram for flour, we have taken the assumption that water is equally partitioned between gluten and starch, which is a reasonable assumption as the isotherms and water dynamics of starch and gluten are very comparable - especially compared to that of sucrose (Roman-Gutierrez, Guilbert, and Cuq Citation2002, Wang et al. Citation2004, van der Sman Citation2017). Hence, transitions for both gluten and starch can be drawn in the same state diagram.
The lines in the graph of are predictions following the Flory-Huggins theory (van der Sman and Meinders Citation2011), with the symbols representing experimental data. The starch data is obtained from our previous paper (van der Sman and Meinders Citation2011), while the glass transition data for gluten is obtained from Bier, Verbeek, and Lay (Citation2014). The thermosetting temperature of gluten and gliadin is taken from the studies (Toufeili, Lambert, and Kokini Citation2002, Kokini et al. Citation1994, Madeka and Kokini Citation1994, ;Citation1996, Icoz and Kokini Citation2008), where we have also taken the data for zein (assuming zein has similar behavior as gluten).
The flow temperature for gluten is also provided as experimental data from Bengoechea et al. (Citation2007). The flow temperature is defined as the temperature where the material starts to flow through an orifice hole, as measured with a PTA (Phase Transition Analyzer). Often, it is found that there is a constant difference between the flow temperature and the glass transition, independent of moisture content. The data in the state diagram, , seems to confirm this. The flow temperature can be compared to a collapse temperature as in pharmaceutical products, and also to a critical viscosity required for flow, or deformation of the biopolymer matrix (van der Sman and Broeze Citation2014b).
In the state diagram we have also included data on the state of the biscuit during baking, as measured by Chevallier et al. (Citation2002) and Fahloul et al. (Citation1994). Although the formulations of their biscuits differ, we have transformed their composition data towards the effective volume fraction of solvent using the expressions for φw, eff given in our earlier work (van der Sman Citation2016b). These processing paths are indicated by red symbols.
In the processing pathway during baking several stages can be distinguished: 1) the temperature rise at constant moisture content, until the gluten thermosetting temperature, 2) a path along the gluten thermosetting temperature line, where moisture is lost, and 3) a path along the flow temperature of gluten. At conditions where gluten thermosets, the gas bubbles in the biscuit starts to open (Chevallier et al. Citation2002), thus leading to the observed moisture loss. The gluten thermosetting will be moisture content dependent, similar to protein denaturation (van der Sman Citation2016b), and it has a certain kinetics (Domenek et al. Citation2002). Hence, the state of the system will follow this phase transition line, until it intersects with the line of critical viscosity, similar to expanding starchy snacks (van der Sman and Broeze Citation2014b) (i.e. the flow temperature of gluten). In the third part of the pathway, the biscuit continues to dry and thereby follows the flow temperature line. We like to note that from the processing pathways we infer that the starch remains ungelatinized, as stated in earlier hypotheses.
Hence, important phase transitions in biscuit baking are 1) the thermosetting of gluten, and 2) the glass transition (or equivalently the flow temperature). Coincidentally, both phase transitions can be described using the effective volume fraction of solvent φw, eff, which accounts for the quantity and quality of the solvent, based on the different hydroxyl groups in the plasticizers present in the biscuit formulation (namely sugars and water).
4. Sucrose replacement in biscuits
In this section we discuss the above reviewed functionality of sucrose from the perspective of its replacement, aiming to ensure that biscuit structure, texture, and morphology remain unaltered in the reformulated biscuits. The functionality of sucrose during the stages of dough mixing and biscuit baking is summarized in and . Its contribution to the structure formation process is described by representating processing steps with the CDS methodology. Overviewing these tables and the CDS description, it strikes us that the majority of the sucrose functionality in relation to the structuring process derives from the fact that dissolved sucrose acts as plasticizer/co-solvent, moderating the viscosity and viscoelastic behavior of the dough and phase transitions of the biopolymers and water. It is only in the first stages of mixing the sucrose functionality is derived from its crystalline state, and its subsequent dissolution. During mixing the dissolved sucrose acts as a hygroscopic compound competing for water with the hydrophilic biopolymers, where the competition with gluten is important for limiting hydration and consequently the gluten network formation during mixing. During baking, the hygroscopicity of sugar is also moderating the evaporation of water, which is important for the growth of the gas bubbles.
In the introduction, we have argued that the sugar replacement strategies should especially focus on mimicking the sucrose functionality concerning morphology, i.e. spread and volume, and texture. Reviewing the types of compounds used for sugar replacement (Alonso and Setser Citation1994, Kweon et al. Citation2009, Pareyt et al. Citation2011, Laguna et al. Citation2013, Mariotti and Lucisano Citation2014, Struck et al. Citation2014), we observe that they can be classified as extensive or intensive sweeteners. Extensive sweeteners are bulking ingredients such as polyols, oligosaccharides, dextrins which are often used in a one-to-one replacement of sugar. In terms of their functionality, extensive sweeteners mainly act as plasticizers/co-solvents, although some (e.g. polyols) also have some sweetening function. On the contrary, intensive sweeteners are mainly used for their sweetening and consequently added in small amounts. For such reason, it can be safely assumed that they do not contribute to the structure, texture, and morphology of biscuits.
We hold the hypothesis that if reformulated biscuits with alternative plasticizers follow similar paths through the supplemented state diagram, the texture of the reference sucrose-rich biscuit can be mimicked. Hence, this requires in-depth knowledge about the interaction of sucrose and its replacers as plasticizers with water and biopolymers. Recently, we have made much progress in this understanding, where we have found that there is much universal behaviour amongst sugars and polyols. First of all, the hygroscopicity of these plasticizers can be quantified using the Flory-Huggins theory (van der Sman and Meinders Citation2011, van der Sman Citation2017). We have found that the Flory-Huggins interaction parameter between water and plasticizer primarily depends on the molecular weight. Flory-Huggins theory extended with free-volume theory also accounts for the interaction of mixtures of biopolymers, plasticizers and water (van der Sman Citation2013a, van der Sman et al. Citation2013). The amount of plasticization of sugars and polyols can be characterized by the amount of hydroxyl-group per molecule, available for intermolecular hydrogen bonding (van der Sman Citation2013b). Using this quantity we can also quantify the behaviour of mixtures of sugars, polyols and water as effective solvent of biopolymers (van der Sman Citation2016b), which can be used to map the phase transitions of the biopolymers onto a single state diagram, as shown above in . Only, in the crystallization/dissolution behaviour there is little universal behaviour amongst the sugars and polyols (van der Sman Citation2017). The melting point and enthalpy of melting depend on the particular shape of the molecule. Yet, these quantities are known for many of the sugars and polyols (Peres and Macedo Citation1996, Ferreira, Brignole, and Macedo Citation2003, Carneiro et al. Citation2013, van der Sman Citation2017). The melting point depression can be well predicted with Flory-Huggins theory (van der Sman Citation2017).
Much of the thermodynamics of mixtures of biopolymers with extensive sweeteners, sugars and water can be predicted, which is helpful in sugar replacement strategies. This means that a number of key physical parameters of the mixtures, as derived from the thermodynamic theories, can be computed. Such parameters can be already used in the product development practice as quantitative guidelines to optimize the formulations of sugar reduced biscuits or other sweet bakery products like breakfast cake (Jurgens et al. Citation2016, Kramer et al. Citation2016).
In order to achieve a complete prediction of the change of the state of the system during mixing and baking, knowledge of kinetics of moisture/sugar diffusion must also be included. A predictive theory has also been developed for this property (He, Fowler, and Toner Citation2006, van der Sman and Meinders Citation2013), based on free volume theory and the generalized Stokes-Einstein relation. Regarding the self-diffusion of water in sugar/oligosaccharide solutions, we have observed universal behavior, where the diffusion coefficient is independent of the molecular weight of the sugar. The self-diffusion coefficient is described by the generalized Stokes-Einstein relation, which takes the size of the sugar molecule and the viscosity of the solution, which can be modeled as a function of T/Tg (van der Sman and Meinders Citation2013) - which is again a universal function. The theory is assumed to hold also for polyols (He, Fowler, and Toner Citation2006).
The required building blocks for predicting the path of reformulated biscuits during dough mixing and biscuit baking are existent. It only takes combining them into a complete computational model including heat and moisture transfer, like that of Baldino et al. (Citation2014), for predicting the final texture after baking. Such a model will be the subject of our future research effort.
5. Conclusions
In this paper, we have reviewed the statements made concerning the functionalities of sucrose during biscuit manufacturing. We have especially focused on the functionality with regards to the structuring process and the final biscuit shape and texture, which are the most challenging aspects to mimic in reformulated biscuits. The role of sucrose in the structure and texture development can be conveniently represented in a qualitative way with the Complex Dispersed Systems methodology. Furthermore, more quantitative insights can be obtained via plotting the change of the state of the system during manufacturing in the supplemented state diagram. Much of the phase transitions happening during the manufacturing, and their governing physical parameters associated with the dough formulation, can be predicted using the above cited theories.
The evolution of the system can be measured in principle experimentally (Fahloul et al. Citation1994, Chevallier et al. Citation2002). However, it is very laborious. If a numerical model incorporating the predictive thermodynamic theories is developed, it can be used as a quantitative guideline for optimization of sugar reduced formulations in an effective and efficient manner, with shorter product development time. Furthermore, the model will provide guidance to the development of novel sugar replacement strategies (e.g. by the inclusion of dietary fibers) and novel sugar replacers. The construction of such a model is the subject of our current research effort.
Acknowledgments
The authors thank the Dutch Ministry of Economic Affairs and Mondelez for funding this research, which has been part of the Strategic Innovation Programme. Also, we acknowledge the help of Jerome Diaz with proof reading of the manuscript.
Additional information
Funding
References
- Abboud, A. M., and R. C. Hoseney. 1984. Differential scanning calorimetry of sugar cookies and cookie doughs. Cereal Chemistry 61(1):34–37.
- Abboud, A. M., G. L. Rubenthaler, and R. C. Hoseney. 1985. Effect of fat and sugar in sugar-snap cookies and evaluation of tests to measure cookie flour quality. Cereal Chem 62(2):124–29.
- Alonso, S., and C. Setser. 1994. Functional replacements for sugars in foods. Trends in Food Science & Technology 5(5):139–46.
- Babin, P., G. Della Valle, H. Chiron, P. Cloetens, J. Hoszowska, P. Pernot, A. L. Réguerre, L. Salvo, and R. Dendievel. 2006. Fast x-ray tomography analysis of bubble growth and foam setting during breadmaking. Journal of Cereal Science 43(3):393–97.
- Baldino, N., D. Gabriele, F. R. Lupi, B. de Cindio, and L. Cicerelli. 2014. Modeling of baking behavior of semi-sweet short dough biscuits. Innovative Food Science & Emerging Technologies 25:40–52.
- Baltsavias, A., A. Jurgens, and T. van Vliet. 1999a. Properties of short-dough biscuits in relation to structure. Journal of Cereal Science 29(3):245–55.
- Baltsavias, A., A. Jurgens, and T. van Vliet. 1999b. Rheological properties of short doughs at large deformation. Journal of Cereal Science 29(1):33–42.
- Baltsavias, A. A. Jurgens, and T. van Vliet. 1999c. Fracture properties of short-dough biscuits: effect of composition. Journal of Cereal Science 29(3):235–44.
- Belcourt, L. A., and T. P. Labuza. 2007. Effect of raffinose on sucrose recrystallization and textural changes in soft cookies. Journal of Food Science 72(1):C065–C071.
- Bengoechea, C., A. Arrachid, A. Guerrero, S. E. Hill, and J. R. Mitchell. 2007. Relationship between the glass transition temperature and the melt flow behavior for gluten, casein and soya. Journal of Cereal Science 45(3):275–84.
- Bier, J. M., C. J. R. Verbeek, and M. C. Lay. 2014. Thermal transitions and structural relaxations in protein-based thermoplastics. Macromolecular Materials and Engineering 299(5):524–39.
- Blond, G., D. Simatos, M. Catté, C. G. Dussap, and J. B. Gros. 1997. Modeling of the water-sucrose state diagram below 0 c. Carbohydrate Research 298(3):139–45.
- Brooker, B. E. 1993. The stabilisation of air in cake batters-the role of fat. Food Structure 12(3):285–296.
- Carneiro, A. P., C. Held, O. Rodríguez, G. Sadowski, and E. A. Macedo. 2013. Solubility of sugars and sugar alcohols in ionic liquids: measurement and pc-saft modeling. The Journal of Physical Chemistry B 117(34):9980–95.
- Catte, M. C. G. Dussap, C. Achard, and J. B. Gros. 1994. Excess properties and solid-liquid equilibria for aqueous solutions of sugars using a uniquac model. Fluid Phase Equilibria 96:33–50.
- Cauvain, S. P., and L. S. Young. 2009. Bakery food manufacture and quality: Water control and effects. West Sussex, United Kingdom: John Wiley & Sons.
- Charun, E., J. Abécassis, A. S. Contamine, T. M. Roulland, B. Vergnes, and M. H. Morel. 2000. Effects of temperature and mechanical input on semisweet biscuit (cookie) quality and dough characteristics 1. Cereal Chemistry 77(3):265–71.
- Chevallier, S., P. Colonna, A. Buléon, and G. Della Valle. 2000a. Physicochemical behaviors of sugars, lipids, and gluten in short dough and biscuit. Journal of Agricultural and Food Chemistry 48(4):1322–26.
- Chevallier, S., P. Colonna, G. Della Valle, and D. Lourdin. 2000b. Contribution of major ingredients during baking of biscuit dough systems. Journal of Cereal Science 31(3):241–52.
- Chevallier, S., G. Della Valle, P. Colonna, B. Broyart, and G. Trystram. 2002. Structural and chemical modifications of short dough during baking. Journal of Cereal Science 35(1):1–10.
- Cuq, B., J. Abecassis, and S. Guilbert. 2003. State diagrams to help describe wheat bread processing. International Journal of Food Science & Technology 38(7):759–66.
- Davis, E. A. 1995. Functionality of sugars: Physicochemical interactions in foods. The American Journal of Clinical Nutrition 62(1):170S–7S.
- Domenek, S., M. H. Morel, J. Bonicel, and S. Guilbert. 2002. Polymerization kinetics of wheat gluten upon thermosetting. a mechanistic model. Journal of Agricultural and Food Chemistry 50(21):5947–54.
- Duyvejonck, A. E., B. Lagrain, B. Pareyt, C. M. Courtin, and J. A. Delcour. 2011. Relative contribution of wheat flour constituents to solvent retention capacity profiles of european wheats. Journal of Cereal Science 53(3):312–18.
- Fahloul, D., G. Trystram, A. Duquenoy, and I. Barbotteau. 1994. Modelling heat and mass transfer in band oven biscuit baking. LWT-Food Science and Technology 27(2):119–24.
- Ferreira, O., E. A. Brignole, and E. A. Macedo. 2003. Phase equilibria in sugar solutions using the a-unifac model. Industrial & Engineering Chemistry Research 42(24):6212–22.
- Ben, Gaïda, L., C. G. Dussap, and J. B. Gros. 2006. Variable hydration of small carbohydrates for predicting equilibrium properties in diluted and concentrated solutions. Food Chemistry 96(3):387–401.
- Gaines, C. S. 1990. Influence of chemical and physical modification of soft wheat protein on sugar-snap cookie dough consistency, cookie size, and hardness. Cereal Chemistry 67(1):73–77.
- Gökmen, V., Ö. A. Açar, A. Serpen, and F. J. Morales. 2008. Effect of leavening agents and sugars on the formation of hydroxymethylfurfural in cookies during baking. European Food Research and Technology 226(5):1031–37.
- He, X., A. Fowler, and M. Toner. 2006. Water activity and mobility in solutions of glycerol and small molecular weight sugars: Implication for cryo-and lyopreservation. Journal of Applied Physics 100:074702.
- Hesso, N., A. Marti, P. Le-Bail, C. Loisel, S. Chevallier, A. Le-Bail, and K. Seetharaman. 2015. Conformational changes of polymers in model batter systems. Food Hydrocolloids 51:101–107.
- Icoz, D. Z., and J. L. Kokini. 2008. State diagrams of food materials. In Food materials science, 95–121. Aguilera, J.M., and Lillford, Peter J., Eds., Springer, New York.
- Jacob, J., and K. Leelavathi. 2007. Effect of fat-type on cookie dough and cookie quality. Journal of Food Engineering 79(1):299–305.
- Jurgens, A., M. W. J. Noort, S. Renzetti, and J. R. de Harder. 2016. Food products with reduced sugar content, October 27 2016. WO Patent App. PCT/NL2016/050,286.
- Kawai, K., K. Hando, R. Thuwapanichayanan, and Y. Hagura. 2016. Effect of stepwise baking on the structure, browning, texture, and in vitro starch digestibility of cookie. LWT-Food Science and Technology 66:384–89.
- Kim, M. H., and M. R. Okos. 1999. Some physical, mechanical, and transport properties of crackers related to the checking phenomenon. Journal of Food Engineering 40(3):189–98.
- Kokini, J. L., A. M. Cocero, H. Madeka, and E. De Graaf. 1994. The development of state diagrams for cereal proteins. Trends in Food Science & Technology 5(9):281–88.
- Kramer, M., E. van Parys, J. vander Stichele, S. van Abeelen, M. Noort, A. Jurgens, and S. Renzetti. 2016. Breakfast cake with reduced sugar content. EP Patent 16166527 A 20160422.
- Kweon, M., L. Slade, H. Levine, R. Martin, and E. Souza. 2009. Exploration of sugar functionality in sugar-snap and wire-cut cookie baking: Implications for potential sucrose replacement or reduction. Cereal Chemistry 86(4):425–33.
- Kweon, M., L. Slade, H. Levine, and D. Gannon. 2014. Cookie-versus cracker-baking—what's the difference? Flour functionality requirements explored by src and alveography. Critical Reviews in Food Science and Nutrition 54(1):115–38.
- Laguna, L., A. Salvador, T. Sanz, and S. M. Fiszman. 2011. Performance of a resistant starch rich ingredient in the baking and eating quality of short-dough biscuits. LWT-Food Science and Technology 44(3):737–46.
- Laguna, L., C. Primo-Martín, A. Salvador, and T. Sanz. 2013. Inulin and erythritol as sucrose replacers in short-dough cookies: Sensory, fracture, and acoustic properties. Journal of Food Science 78(5):S777–S784.
- Laguna, L., P. Varela, A. Salvador, T. Sanz, and S. M Fiszman. 2012. Balancing texture and other sensory features in reduced fat short-dough biscuits. Journal of Texture Studies 43(3):235–45.
- Lerici, C. R., M. Piva, and M. D. Rosa. 1983. Water activity and freezing point depression of aqueous solutions and liquid foods. Journal of Food Science 48(6):1667–69.
- Maache-Rezzoug, Z., J. M. Bouvier, K. Allaf, and C. Patras. 1998. Effect of principal ingredients on rheological behaviour of biscuit dough and on quality of biscuits. Journal of Food Engineering 35(1):23–42.
- Madeka, H., and J. L. Kokini. 1994. Changes in rheological properties of gliadin as a function of temperature and moisture: development of a state diagram. Journal of Food Engineering 22(1-4):241–52.
- Madeka, H., and J. L. Kokini. 1996. Effect of glass transition and cross-linking on rheological properties of zein: Development of a preliminary state diagram. Cereal Chemistry 73(4):433–38.
- Manley, D. 2011. Manley's technology of biscuits, crackers and cookies. Elsevier, Woodhead Publishing, Oxford.
- Manohar, R. S., and P. H. Rao. 1999. Effect of mixing method on the rheological characteristics of biscuit dough and the quality of biscuits. European Food Research and Technology 210(1):43–48.
- Manohar, R. S., and P. H. Rao. 2002. Interrelationship between rheological characteristics of dough and quality of biscuits; use of elastic recovery of dough to predict biscuit quality. Food Research International 35(9):807–13.
- Mariotti, M., and M. Lucisano. 2014. Sugar and sweeteners. In Bakery products science and technology, 2nd ed. pp. 199–221. Zhou, W., Hui, Y. H., Leyn, I. D., Pagani, M. A., Rosell, C. M., Selman, J. D. and Therdthai, N., eds. John Wiley & Sons, West Sussex, UK.
- Misra, N. N., and B. K. Tiwari. 2014. Biscuits. In Bakery products science and technology, 2nd ed. pp. 585–601. Zhou, W., Hui, Y. H., Leyn, I. D., Pagani, M. A., Rosell, C. M., Selman, J. D. and Therdthai, N., eds. John Wiley & Sons, West Sussex, UK.
- Moiraghi, M., L. Vanzetti, C. Bainotti, M. Helguera, A. León, and G. Pérez. 2011. Relationship between soft wheat flour physicochemical composition and cookie-making performance. Cereal Chemistry 88(2):130–36.
- O’Brien, C. M., D. Chapman, D. P. Neville, M. K. Keogh, and E. K. Arendt. 2003. Effect of varying the microencapsulation process on the functionality of hydrogenated vegetable fat in shortdough biscuits. Food Research International 36(3):215–21.
- Pareyt, B., and J. A. Delcour. 2008. The role of wheat flour constituents, sugar, and fat in low moisture cereal based products: A review on sugar-snap cookies. Critical Reviews in Food Science and Nutrition 48(9):824–39.
- Pareyt, B., K. Brijs, and J. A. Delcour. 2009a. Sugar-snap cookie dough setting: the impact of sucrose on gluten functionality. Journal of Agricultural and Food Chemistry 57(17):7814–18.
- Pareyt, B., F. Talhaoui, G. Kerckhofs, K. Brijs, H. Goesaert, M. Wevers, and J. A. Delcour. 2009b. The role of sugar and fat in sugar-snap cookies: Structural and textural properties. Journal of Food Engineering 90(3):400–408.
- Pareyt, B., K. Brijs, and J. A. Delcour. 2010. Impact of fat on dough and cookie properties of sugar-snap cookies. Cereal Chemistry 87(3):226–30.
- Pareyt, B., M. Goovaerts, W. F. Broekaert, and J. A. Delcour. 2011. Arabinoxylan oligosaccharides (axos) as a potential sucrose replacer in sugar-snap cookies. LWT-Food Science and Technology 44(3):725–28.
- Peres, A. M., and E. A. Macedo. 1996. Thermodynamic properties of sugars in aqueous solutions: correlation and prediction using a modified uniquac model. Fluid Phase Equilibria 123(1):71–95.
- Renzetti, S., and A. Jurgens. 2016. Rheological and thermal behavior of food matrices during processing and storage: Relevance for textural and nutritional quality of food. Current Opinion in Food Science 9:117–25.
- Renzetti, S., R. de Harder, and A. Jurgens. 2016. Puff pastry with low saturated fat contents: The role of fat and dough physical interactions in the development of a layered structure. Journal of Food Engineering 170:24–32.
- Riedel, R., B. Böhme, and H. Rohm. 2015. Development of formulations for reduced-sugar and sugar-free agar-based fruit jellies. International Journal of Food Science & Technology 50(6):1338–44.
- Rodríguez-García, J., L. Laguna, A. Puig, A. Salvador, and I. Hernando. 2013. Effect of fat replacement by inulin on textural and structural properties of short dough biscuits. Food and Bioprocess Technology 6(10):2739–50.
- Roman-Gutierrez, A. D., S. Guilbert, and B. Cuq. 2002. Distribution of water between wheat flour components: A dynamic water vapour adsorption study. Journal of Cereal Science 36(3):347–55.
- Roman-Gutierrez, A. D., F. Mabille, S. Guilbert, and B. Cuq. 2003. Contribution of specific flour components to water vapor adsorption properties of wheat flours. Cereal Chemistry 80(5):558–63.
- Roos, Y., and M. Karel. 1991. Amorphous state and delayed ice formation in sucrose solutions. International Fournal of Food Science & Technology 26(6):553–66.
- Saleem, Q., R. D. Wildman, J. M. Huntley, and M. B. Whitworth. 2005. Improved understanding of biscuit checking using speckle interferometry and finite-element modelling techniques. In Proceedings of the Royal Society of London A: Mathematical, Physical and Engineering Sciences, vol. 461, 2135–2154. The Royal Society.
- Sciarini, L. S., F. van Bockstaele, B. Nusantoro, G. T. Pérez, and K. Dewettinck. 2013. Properties of sugar-snap cookies as influenced by lauric-based shortenings. Journal of Cereal Science 58(2):234–40.
- Slade, L., H. Levine, J. Ievolella, and M. Wang. 1993. The glassy state phenomenon in applications for the food industry: Application of the food polymer science approach to structure–function relationships of sucrose in cookie and cracker systems. Journal of the Science of Food and Agriculture 63(2):133–76.
- Starzak, M., and M. Mathlouthi. 2006. Temperature dependence of water activity in aqueous solutions of sucrose. Food Chemistry 96(3):346–70.
- Struck, S. D. Jaros, C. S. Brennan, and H. Rohm. 2014. Sugar replacement in sweetened bakery goods. International Journal of Food Science & Technology 49(9):1963–76.
- Thewissen, B. G., I. Celus, K. Brijs, and J. A. Delcour. 2011. Foaming properties of wheat gliadin. Journal of Agricultural and Food Chemistry 59(4):1370–75.
- This, H. 2005. Modelling dishes and exploring culinary precisions: The two issues of molecular gastronomy. British Journal of Nutrition 93(S1):S139–46.
- Toufeili, I., I. A. Lambert, and J. L. Kokini. 2002. Effect of glass transition and cross-linking on rheological properties of gluten: development of a preliminary state diagram. Cereal Chemistry 79(1):138–42.
- van der Sman, R. G. M. 2012. Thermodynamics of meat proteins. Food Hydrocolloids 27(2):529–35.
- van der Sman, R. G. M. 2013a. Moisture sorption in mixtures of biopolymer, disaccharides and water. Food Hydrocolloids 32(1):186–94.
- van der Sman, R. G. M. 2013b. Predictions of glass transition temperature for hydrogen bonding biomaterials. The Journal of Physical Chemistry B 117(50):16303–313.
- van der Sman, R. G. M. 2015. Biopolymer gel swelling analysed with scaling laws and flory–rehner theory. Food Hydrocolloids 48:94–101.
- van der Sman, R. G. M. 2016a. Filler functionality in edible solid foams. Advances in Colloid and Interface Science 231:23–35.
- van der Sman, R. G. M. 2016b. Sugar and polyol solutions as effective solvent for biopolymers. Food Hydrocolloids 56:144–49.
- van der Sman, R. G. M. 2017. Predicting the solubility of mixtures of sugars and their replacers using the flory–huggins theory. Food & Function 8(8):360–71.
- van der Sman, R. G. M., and J. Broeze. 2013. Structuring of indirectly expanded snacks based on potato ingredients: A review. Journal of Food Engineering 114(4):413–25.
- van der Sman, R. G. M., and J. Broeze. 2014a. Effects of salt on the expansion of starchy snacks: A multiscale analysis. Food & Function 5(12):3076–82.
- van der Sman, R. G. M., and J. Broeze. 2014b. Multiscale analysis of structure development in expanded starch snacks. Journal of Physics: Condensed Matter 26(46):464103.
- van der Sman, R. G. M., and M. B. J. Meinders. 2011. Prediction of the state diagram of starch water mixtures using the flory–huggins free volume theory. Soft Matter 7(2):429–42.
- van der Sman, R. G. M., and M. B. J. Meinders. 2013. Moisture diffusivity in food materials. Food Chemistry 138:1265–74.
- van der Sman, R. G. M., and A. J. van der Goot. 2009. The science of food structuring. Soft Matter 5(3):501–10.
- van der Sman, R. G. M., E. Paudel, A. Voda, and S. Khalloufi. 2013. Hydration properties of vegetable foods explained by flory–rehner theory. Food Research International 54(1):804–11.
- van Steertegem, B., B. Pareyt, K. Brijs, and J. A. Delcour. 2014. The role of gluten proteins in production and quality of a yeast leavened sugar and fat rich wheat based food model system. Food Research International 62:991–7.
- Villemejane, C., P. Roussel, S. Berland, P. Aymard, and C. Michon. 2013. Technological and sensory tools to characterize the consistency and performance of fibre-enriched biscuit doughs. Journal of Cereal Science 57(3):551–9.
- Wade, P. 1988. Biscuit, cookies and crackers: The principles of the craft. vol. i.
- Wang, X., S. G. Choi, and W. L. Kerr. 2004. Water dynamics in white bread and starch gels as affected by water and gluten content. LWT-Food Science and Technology 37(3):377–84.
- Wilderjans, E., A. Luyts, K. Brijs, and J. A. Delcour. 2013. Ingredient functionality in batter type cake making. Trends in Food Science & Technology 30(1):6–15.
- Zoulias, E. I., V. Oreopoulou, and E. Kounalaki. 2002. Effect of fat and sugar replacement on cookie properties. Journal of the Science of Food and Agriculture 82(14):1637–44.