
Abstract
A database of embryo-fetal developmental toxicity (EFDT) studies of 379 pharmaceutical compounds in rat and rabbit was analyzed for species differences based on toxicokinetic parameters of area under the curve (AUC) and maximum concentration (Cmax) at the developmental lowest adverse effect level (dLOAEL). For the vast majority of cases (83% based on AUC of n = 283), dLOAELs in rats and rabbits were within the same order of magnitude (less than 10-fold different) when compared based on available data on AUC and Cmax exposures. For 13.5% of the compounds the rabbit was more sensitive and for 3.5% of compounds the rat was more sensitive when compared based on AUC exposures. For 12% of the compounds the rabbit was more sensitive and for 1.3% of compounds the rat was more sensitive based on Cmax exposures. When evaluated based on human equivalent dose (HED) conversion using standard factors, the rat and rabbit were equally sensitive. The relative extent of embryo-fetal toxicity in the presence of maternal toxicity was not different between species. Overall effect severity incidences were distributed similarly in rat and rabbit studies. Individual rat and rabbit strains did not show a different general distribution of systemic exposure LOAELs as compared to all strains combined for each species. There were no apparent species differences in the occurrence of embryo-fetal variations. Based on power of detection and given differences in the nature of developmental effects between rat and rabbit study outcomes for individual compounds, EFDT studies in two species have added value over single studies.
Introduction
In regulatory non-clinical testing for pharmaceutical compounds, it is recommended to perform developmental toxicity studies in two species, with rat and rabbit being the most commonly used species (ICH S5(R2) Citation2005). This practice has been observed for over three decades and has resulted in a large number of studies conducted using these species, which allow a comparison of rat versus rabbit developmental toxicity study results with the same pharmaceutical compounds. A comparative analysis of the data accumulated to date provides a unique opportunity to answer several related questions. For instance, which species is, in retrospect, the most sensitive for detecting developmental toxicity potential of a compound? Are there situations in which testing in a single species would suffice? Can we designate one of the two species as a default first choice, and might the first study inform sufficiently about the need for a second species study? A comparison of the sensitivity for identifying developmental toxicity hazard between rat and rabbit studies is feasible given the relatively well-standardized animal study protocols applied. Thus, rat and rabbit data can be compared based on systemic exposure kinetics. To allow for inclusion of compounds without kinetic data, similar comparisons were conducted using human equivalent dose (HED).
In this study, we have performed comparisons between rat and rabbit studies based on available pharmacokinetic data, in which exposure was evaluated by examination of the area under the concentration-time curve (AUC) and maximum observed systemic concentration (Cmax). Moreover, we have compared rat and rabbit developmental toxicity study results based on conversion of the developmental Lowest-Observed-Adverse-Effect Level (dLOAEL) using standard HED transformation factors (FDA Citation2005). The rationale for this approach is to normalize doses to body surface area as a way to approximate equivalent exposure between species and to enable an interspecies comparison of sensitivity. Furthermore, we have addressed additional aspects that might affect the maternal systemic exposure comparison, such as maternal toxicity, mode of action, clinical indication, developmental effect severity, and strain differences.
This analysis was performed using a database that was built through a collaborative effort between the Dutch National Institute for Public Health and the Environment (RIVM), the International Life Sciences Institute (ILSI), Health and Environmental Sciences Institute (HESI), Developmental and Reproductive Toxicology (DART), Technical Committee, the Dutch Medicines Evaluation Board (CBG-MEB), and the US Environmental Protection Agency (US EPA). The database structure of the US EPA ToxRefDB (Knudsen et al. Citation2009; Martin et al. Citation2009) was used and expanded to add pharmacokinetic information (Cmax and AUC). Developmental toxicity study data were acquired through European Medicines Agency (EMA) human medicinal product registration data and through product data acquired from the pharmaceutical industry as detailed below (see “Methods - Data sources” section). A companion manuscript on this database analysis addresses the comparison of the type and severity of developmental and maternal effects observed among studies (Theunissen et al., Citation2016). Detailed information on the background of the two-species developmental toxicity database project can be found there and in a previously published workshop report (Theunissen et al. Citation2014). The current manuscript provides an analysis of the same data from the perspective of pharmacokinetics. The combined analyses presented in these two manuscripts can be used as an important background resource in the discussion on enhancing efficiency in hazard identification, improving risk assessment, and potentially reducing animal use in embryo-fetal developmental toxicity studies in the pharmaceutical industry.
Methods
Data sources
Information on rat and rabbit developmental toxicity studies was collected for human pharmaceuticals. Quantitative data [e.g. Common Technical Document (CTD) tables or equivalently informative tabulated data from study reports] from developmental toxicity studies that met ICH S5(R2) guideline were used to populate the database. Written summaries were also used as a supplementary source of information. Data were acquired through two different sources: (1) EMA human medicinal product registration data were derived from the databases of the CBG-MEB in the Netherlands (including registered, withdrawn and rejected compounds that were submitted for marketing authorization between 2004 and 2012); and (2) Product data were acquired from industry through a survey conducted by a subcommittee of the HESI DART Technical Committee, the Second Species working group. Data submitted from participating HESI DART companies included registered compounds, compounds for which development was discontinued, and compounds in development at the time this report was being prepared. All HESI DART compounds in the database were anonymized by HESI staff, both as to chemical name/structure and company of origin, and sent to RIVM for inclusion in the database. The HESI DART dataset was cross-referenced to the EMA dataset for duplicate compounds, which were later removed from the final database.
The modified toxicology reference database
All data were entered by RIVM staff using the format of US EPA’s Toxicology Reference Database (ToxRefDB) stand-alone data entry tool (Microsoft Access based), enhanced to include toxicokinetic information. The EPA ToxRefDB database was originally designed for the ToxCast project to store data from regulatory toxicological animal test results (Martin et al. Citation2009). The ToxRefDB entry tool stores detailed study design, dosing, and observed treatment-related effects using a standardized vocabulary (Martin et al. Citation2009). The standardized vocabulary for developmental toxicity endpoints in the ToxRefDB is based on the DevTox lexicon (Makris et al. Citation2009), joined with standardized terms from the OECD-OPPTS vocabulary (OECD Citation2001), generating a thesaurus of 984 non-redundant terms applying to maternal and developmental endpoints in the original description of that database (Knudsen et al. Citation2009; Martin et al. Citation2009). The public version of ToxRefDB (http://www.epa.gov/ncct/toxcast/data.html, latest release date October 2014) has information on prenatal developmental toxicity studies for approximately 600 chemicals that include 59 failed pharmaceutical compounds donated to the ToxCast program. These 59 compounds were not eligible for the present analysis due to the lack of kinetic data for these entries. The enhanced database used for the present study is not currently part of the public version of ToxRefDB but will be made available as soon as proprietary data are released for publication.
Toxicokinetic information
The stand-alone ToxRefDB tool for this project was enhanced by the US EPA with the option to collect toxicokinetic information. When available from the embryo-fetal developmental toxicity (EFDT) study, information was entered on AUC and Cmax data reflecting adult systemic exposure to the parent compound or its active metabolite. Use of toxicokinetics data allowed interspecies comparisons of maternal systemic exposure levels, which was deemed more relevant for pharmaceuticals than the externally administered dose. Kinetics information was not available for all compounds within the acquired prenatal developmental toxicity studies. For these compounds, when possible, kinetics data were retrieved from other available studies, preferably from (non-)pregnant female animals from the same strain at similar doses and exposure duration. Although the most appropriate kinetics data available were used, it should be taken into account that pregnant females are kinetically distinct from their non-pregnant counterparts (e.g. increased blood volume, decrease in plasma protein-binding and increase in glomerular filtration rate) (Loebstein et al. Citation1997). When kinetics data were available only at doses not tested in the developmental toxicity study, interpolation from other available kinetics data was performed to estimate an expected maternal systemic exposure at the developmental lowest observed adverse effect level (dLOAEL).
Effect type categorization
Developmental and maternal LOAELs within a given study were derived based on results in the individual EFDT studies. To obtain uniformity in the derivation of the LOAEL among studies, maternal toxicity LOAEL (mLOAEL) and EFDT LOAEL (dLOAEL) were entered into the database after verification of the source data. The Dutch CBG-MEB and experts in the HESI DART Second Species work group discussed ambiguous cases prior to including them in the data set. Ambiguous cases were scarce, and mostly included typographical errors and obvious misreads of the data. Critical effects determining the mLOAEL were related to adverse changes in maternal body weight (gain), food consumption, clinical signs, maternal gross pathology, maternal organ weight, and/or maternal mortality. Critical effects determining the dLOAEL related to adverse changes in fetal body weight, litter size, number of live and dead fetuses, resorptions, post-implantation loss, abortions, and/or fetal abnormalities (malformations and variations).
In order to compare the occurrence of the various manifestations of EFDT between species, findings defining EFDT were classified into four categories. These included: (1) embryo-fetal death (e.g. number of live/dead fetuses, decreased litter size, resorptions, post-implantation loss, and pregnancy losses), (2) growth retardation (e.g. fetal body weight reduction), (3) malformation (dysmorphogenesis), and (4) variation (changes over background incidence of morphological heterogeneity normally occurring within the species/strain). This 4-fold grouping is a generally employed specification of classical manifestations of developmental toxicity. Structural anomalies in the ToxRefDB lexicon (n = 984 terms) were categorized, where appropriate, as malformations or variations based on the consensus of three HESI member companies’ current lexicons for fetal alterations (Bristol-Myers Squibb, New Brunswick, NJ; Charles River Laboratories, Horsham, PA; GlaxoSmithKline, King of Prussia, PA). Malformations and embryo-fetal death were considered severe effects and were combined for some analyses, whereas growth retardation and variations were considered less severe manifestations of EFDT, and these were also combined for some analyses. Severity was defined operationally against the regulatory context, for which embryo-fetal death and malformations are usually interpreted as definitive manifestations of developmental toxicity, whereas growth retardation and variations, dependent on their incidence and magnitude may be considered less severe manifestations of developmental toxicity. This classification allowed the general comparative assessment as done in this study, but analysis of specific case comparisons would require more in-depth assessment of available data.
Mode of action and clinical indication
Information on mode of action (MoA) and clinical indication was acquired through the European Public Assessment Reports for the EMA compounds (n = 176 for MoA and indication) and through a survey for the HESI DART compounds (MoA, n = 28; indication, n = 42).
Database analysis and statistics
For data analysis, relational data were extracted from the Microsoft Access based ToxRefDB stand-alone data entry tool using queries. This process is explained in more depth by Knudsen et al. (Citation2009). Information for each of the compounds and doses was extracted from the ToxRefDB and collected and processed in Microsoft Excel. Heat maps were generated in Gene Math XT. Statistical analyses were performed in Graphpad Prism (GraphPad Software, Inc., La Jolla, CA) using the Shapiro–Wilk test for testing normality of distribution.
Results
Population of the database with developmental toxicity studies
Developmental toxicity studies of pharmaceutical compounds in both rat and rabbit of acceptable quality (meeting ICH S5(R2) guideline requirements) submitted to EMA were entered into the enhanced ToxRefDB format. This resulted in studies for 176 compounds eligible for the database. Through the HESI DART Second Species working group pharmaceutical industry survey, nine companies provided data on 237 compounds. Eight of these compounds were duplicates of compounds collected through EMA and essential data were missing in 26 additional compounds, resulting in 203 compounds eligible for entry into the database. Combining the HESI DART studies with those of EMA, data on a total of 379 compounds, comprising more than 800 studies, were entered into the database. For some species, two studies were available in the same species. In that case, for the interspecies comparison, pragmatically the study with the lowest dLOAEL was used. For 283 and 233 of these compounds AUC and Cmax data were available, respectively.
Rat versus rabbit AUC and Cmax, and HED at the dLOAEL
In order to compare rat and rabbit exposure at their respective dLOAEL, toxicokinetic parameters AUC (n = 283; ) and Cmax (n = 233; ) for rat versus rabbit at the dLOAEL or at the highest dose tested were plotted. For compounds above the green line, the rat AUC was at least 10-fold lower than the rabbit AUC. For compounds below the red line, the rabbit AUC was at least 10-fold lower than the rat AUC. The black line indicates a rat/rabbit ratio of 1.0 for the dLOAEL metric. For AUC, 213 (75%) of the compounds induced a dLOAEL in at least one species, and for 83% of all 283 compounds there was a less than 10-fold difference between rat and rabbit AUC. In total, 10 (3.5%) compounds with a dLOAEL in rat had an AUC at least 10-fold lower than the rabbit AUC. For 38 (13.5%) compounds, the rabbit AUC at the dLOAEL was at least 10-fold lower than the rat AUC. For 70 (25%) compounds, no dLOAEL was reached in either rat or rabbit; these compounds were excluded from . Similar findings were observed within the scatter plot of rat and rabbit Cmax (). For 86.3% of the 233 compounds, there was a less than 10-fold difference between rat and rabbit Cmax. For three (1.3%) compounds, the rat Cmax at the dLOAEL was at least 10-fold lower than the rabbit Cmax, and for 29 (12.4%) compounds the rabbit Cmax at the dLOAEL was at least 10-fold lower than the rat Cmax. For 53 (22.7%) compounds, no dLOAEL was reached in either rat or rabbit; these compounds were excluded from . These results indicate that, using comparison based on AUC, for a majority of the compounds (83%), rat and rabbit are similarly sensitive in producing developmental toxicity; whereas rat is the more sensitive species for 3.5%, and rabbit is more sensitive for 13.5% of the compounds. Similar results were obtained when Cmax was used to compare dLOAEL in rat and rabbit studies.
Figure 1. (A) AUC (ng.h/mL; log10 scale) at dLOAEL or the highest dose tested compared between rat and rabbit (N = 213). For 70/283 compounds, no dLOAEL was reached in either species and these do not appear in the figure. For compounds above the green line, the rat AUC was at least 10× lower than the rabbit AUC. For compounds below the red line, the rabbit AUC was at least 10× lower than the rat AUC. The black line indicates when the dLOAEL is theoretically the same in both species. (B) Cmax at dLOAEL or the highest dose tested compared between rat and rabbit (N = 180). For 53/233 compounds, no dLOAEL was reached in either species, and these do not appear in the figure. (C) Human equivalent dose (HED) at dLOAEL or the highest dose tested compared between rat and rabbit (N = 282). For 96/378 compounds, no dLOAEL was reached in either species and these cases are not included in the figure. (D, E, F) Distribution of rat/rabbit (D) AUC (N = 129), (E) Cmax (N = 109) and (F) HED (N = 163) ratios across compounds when a dLOAEL was reached in both species. AUC and HED curves are normally distributed (Shapiro–Wilk test); Cmax curve is not normally distributed. Median AUC =0.89; median Cmax = 1.71; median HED = -0.29. Green, black, and red lines correspond with the lines in the concurrent scatter plots in A, B, and C.
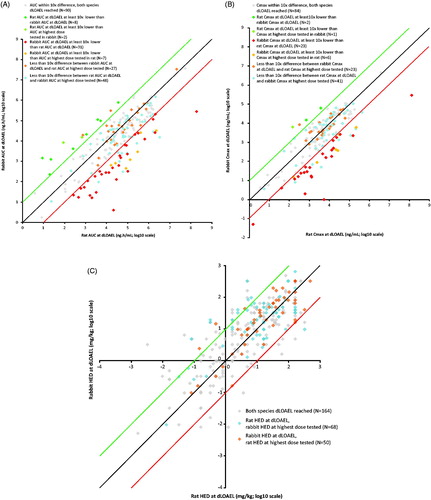

We also compared rat and rabbit exposures at their respective dLOAEL after conversion of dLOAELs to their respective HED in mg/kg. A factor of 0.16 was used to determine HED for the rat data, and a factor of 0.32 to determine the HED for the rabbit data (FDA Citation2005). Rat and rabbit HED were plotted for the 282 compounds for which embryo-fetal toxicity was observed in at least one species and a once daily dosing schedule was used (); one compound was omitted due to a twice daily dosing schedule. For 96 compounds, no dLOAEL was reached in either rat or rabbit; these compounds were excluded from . Most of the compounds fell within the 10-fold difference borders (n = 238, 84% of compounds with a dLOAEL in one or both species). Rat HED at the dLOAEL was at least 10-fold lower than rabbit HED for 29 compounds (7.9%), whereas rabbit HED at the dLOAEL was at least 10-fold lower than rat HED for 15 compounds (4.0%). These results show that for a majority of the compounds (84%), based on HED, rat and rabbit are similarly sensitive in producing developmental toxicity; whereas the rat is more sensitive in producing developmental toxicity for 7.9% and the rabbit is more sensitive for 4.0% of the compounds. For six compounds, rat parameters from both the HED (6/29; 21%) and AUC (6/10; 60%) analyses were at least 10-fold lower than rabbit parameters, whereas for another 6/29 compounds no toxicokinetic (TK) data were available. For the converse situation in the rabbit, this was also the case for another six compounds (HED 6/15; 40%), (AUC 6/38; 16%) and for 3/15 compounds no TK data were available.
The distribution of the rat/rabbit ratios of compounds with a dLOAEL in both species is shown for the AUC, Cmax, and HED plots in , respectively. The HED and AUC ratio curves are normally distributed, but the Cmax curve is not (Shapiro–Wilk test). The HED distribution curve is relatively evenly distributed around the rat/rabbit HED ratio =1 line (median 0.78). For both AUC and Cmax, the median of the distribution curve is shifted to the right (median rat/rabbit AUC ratio =2.4; median rat/rabbit Cmax ratio =5.53), suggesting a higher sensitivity of the rabbit. Given the greater number of compounds with AUC data compared to Cmax, and the normal distribution of the AUC curve, additional analyses have been performed on the AUC scatter plot.
Compound MoA and clinical indication with regardto AUC
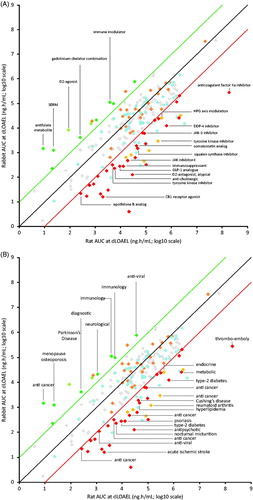
Information on MoA and indication was available for a limited number of compounds (MoA, n = 135; indication, n = 147). Compounds falling outside the 10× difference lines were tagged with their MoA () and indication (). For 19 (40% of outliers in ) and 26 (54% of outliers in ) of these compounds information on MoA or indication was available, respectively. In this limited analysis, neither rat nor rabbit showed specific sensitivity in producing developmental toxicity dependent on MoA or clinical indication of the compound.
Figures 2. (A) Mode of Action and (B) clinical indication of outlier compounds (at least 10× difference between rat and rabbit) marked in the AUC plot (N = 283) at dLOAEL or the highest dose tested compared between rat and rabbit (N = 283). Information on compound mode of action and indication was available for N = 135/283 and N = 147/283 compounds, respectively.
Embryo-fetal toxicity in relation to maternal toxicity with regard to AUC
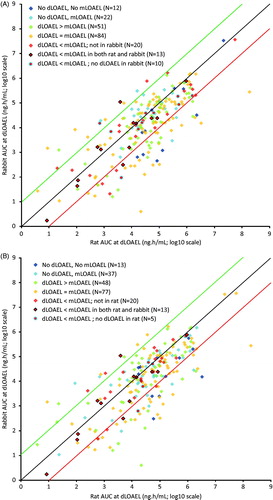
The presence or absence of maternal toxicity and its relationship with developmental toxicity in terms of AUC at dLOAEL levels at which either or both were observed were categorized and color coded in the AUC scatter plot for rat () and rabbit (). All of the different dLOAEL versus mLOAEL categories were distributed heterogeneously in both scatter plots. This heterogeneity was also evident from the distribution of the dLOAEL versus mLOAEL categories over the AUC ratio ranges considering maternal toxicity for both rat () and rabbit (). No general differences were observed between species in the relationship between maternal and embryo-fetal toxicity.
Figures 3. dLOAEL in relation to mLOAEL for (A) rat, and (B) rabbit marked in the AUC plot (N = 283) compared between rat and rabbit. As to the legend, e.g. in (A) “dLOAEL > mLOAEL” means: the dLOAEL is higher than the mLOAEL in the rat study in this rat-rabbit comparison; and in (B) “dLOAEL < mLOAEL; no dLOAEL in rat” means: the dLOAEL is lower than the mLOAEL in the rabbit study in this rat-rabbit comparison, whilst no dLOAEL was observed in the rat study in this comparison. Distribution of dLOAEL in relation to mLOAEL for (A) rat and (B) rabbit as observed over AUC ratio ranges in the AUC plot ( for rat and for rabbit) at dLOAEL (red, yellow, or green colors) or highest dose tested (blue colors) (N = 283). Green, black, and red lines correspond with the lines in the concurrent scatter plots in .
Severity of effect type with regard to AUC
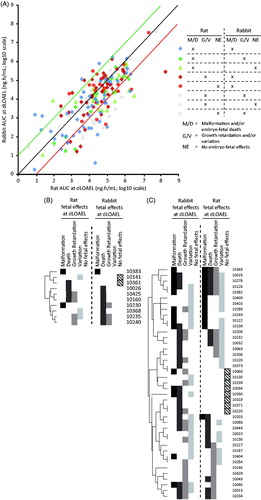
In order to compare the severity of developmental toxicity between species, effects were categorized into malformation (M), embryo-fetal death (D), growth retardation (G), and variation (V). M and D were considered equally severe, as were G and V. Furthermore, M and D were considered as more severe than G and V. For a relative severity analysis, for each compound, the most severe effects observed were identified for both species, as follows: M/D (more severe), G/V (less severe), or no embryo-fetal effects observed (NE). Combinations of the occurrence of these effect types were color and icon coded in . When these combinations were graphed in the AUC plot, no specific pattern for any combination was observed, indicating differences in AUC between rat and rabbit were generally not related to the severity of the developmental effect in the study. For cases where very severe effects occurred in both rats and rabbits (blue diamonds) it appeared that rabbit more often is more sensitive (there are more blue diamonds below the red line than above the green line). But when only one species shows severe effects (rat or rabbit) the sensitivity appears to be similar (green triangles and red circles), implying that for effects with species concordance rabbits may be more sensitive, but for effects that appear only in one species there is no species preference. To further investigate this, a heat map was made of effect categories observed at the dLOAEL, for those compounds for which the AUC was at least 10-fold lower in one species as compared to the other (rat, n = 10; rabbit, n = 38), showing the presence of each of the effect types (M, D, G, V, or NE) for both species ( and ). Also within this specific selection of compounds, there did not appear to be a trend of certain effect categories or severity when comparing effects found at the dLOAEL in both species.
Figure 4. Comparison of occurrence of severity of effect type between rat and rabbit within the distribution of AUC at the dLOAEL. Heat maps of fetal effects observed in rat and rabbit regarding outliers for which the AUC and/or Cmax was (B) at least 10× lower in rat compared to rabbit at dLOAEL (n = 10) or (C) at least 10× lower in rabbit compared to rat at dLOAEL (n = 41). The numbers in the last column of both figures correspond to compound reference codes in the modified ToxRefDB.
Species strain with regard to AUC
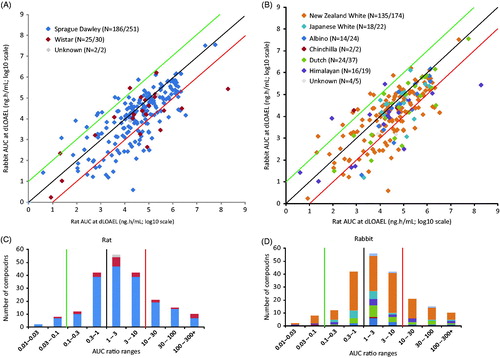
The influence of species strain on the AUC scatterplot was investigated for both rat and rabbit. Sprague-Dawley (SD) (186 compounds with TK data within 251 in the database) and Wistar (n = 25/30) rat strains were present in the database (). New Zealand White (n = 135/174), Japanese White (n = 18/22), Albino (n = 14/24), Chinchilla (n = 2/2), Dutch Belted (n = 24/37), and Himalayan (n = 16/19) rabbit strains were present in the database (). For two and four compounds, information on strain was not available for rat or rabbit, respectively (gray diamonds, and ). Distribution of rat and rabbit strains over the AUC ratio ranges are shown in and . Rat and rabbit strains appeared equally divided over the AUC scatter plot. Therefore, in general, rat or rabbit strain did not seem to affect the AUC at dLOAEL.
Figure 5. (A) rat and (B) rabbit strains marked in the AUC plot (N = 283) compared between rat and rabbit (N = 283). In color code legend, N= number of studies in this strain with AUC data/total number of studies in this strain. Distribution of (C) rat and (D) rabbit strains as observed over AUC ratio ranges in the AUC plot (A for rat and B for rabbit) at dLOAEL or highest dose tested (N = 283). Green, black, and red lines correspond with the lines in the concurrent AUC plots.
Rat versus rabbit AUC excluding compounds with dLOAEL based only on variations
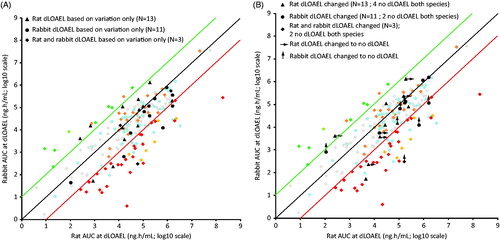
For some compounds (n = 13 for rat only, n = 11 for rabbit only, and n = 3 for both rat and rabbit), the dLOAEL was based only on variations, in the absence of observed malformations, embryo-fetal death or growth retardation at the dLOAEL. Compounds for which the dLOAEL was based on variations only were marked in black based on their positions in the original AUC scatter plot of (shown in ). For those compounds with a dLOAEL based on a variation only, alternative dLOAELs were established (if possible) based on M, D, or G. Changes in dLOAEL for these compounds are shown in . Compounds for which no dLOAEL was reached when disregarding variations were tagged with an arrow (pointing to the right: no dLOAEL in the rat, pointing upwards: no dLOAEL in the rabbit). The arrowed points in represent the highest dose tested. No general change in distribution of these studies within the AUC cluster was observed. Furthermore, the more stringent criteria for determining the dLOAEL (based on M, D, or G) did not specifically affect the outliers in the AUC plot.
Figure 6. (A) AUC comparison plot between rat and rabbit with compounds marked in black for which dLOAEL in rat and/or rabbit was determined on variations only. (B) Changes in dLOAELs based on death, malformations, and growth retardation only, when excluding variations in the AUC plot compared between rat and rabbit. Compounds for which no dLOAEL was reached when disregarding variations were tagged with an arrow (pointing to the right: no dLOAEL in the rat; pointing upwards: no dLOAEL in the rabbit). The arrowed points represent the highest dose tested.
Discussion
Since the introduction of regulatory rat and rabbit EFDT studies in various frameworks for chemical and pharmaceutical safety; a wealth of data and experience has been collected. Many hundreds of compounds from a wide variety of application domains have been tested in both species, be it e.g. industrial chemicals, pesticides, biocides, or pharmaceuticals. The experience gathered over many decades has opened up the possibility for a meaningful comparison of performance between rat and rabbit EFDT studies. For chemicals for which human exposure is not intended, external effective dose comparisons provide information about the relative sensitivity of rat and rabbit as to dLOAEL and related incidence and severity of EFDT, sufficient in view of the risk assessment process. Such comparative studies have been performed in the past (Schardein Citation2000; Hurttet al. Citation2003; Janer et al. Citation2008; Knudsen et al. Citation2009), and have invariably indicated many similarities between rat and rabbit EFDT responses. However, both species have shown cases as well in which only one of the two species showed an EFDT response. This warrants performance of EFDT studies in both species, providing benefit to the overall compound hazard and risk assessment. In the accompanying manuscript, we have performed a similar analysis for pharmaceutical compounds based on external dose metrics (Theunissen et al. Citation2016). However, for pharmaceutical compounds, rather than relying on external dose comparisons, it is important to compare the lowest systemic toxic doses with therapeutic systemic exposure levels in order to determine the margin of safety. This manuscript presents an analysis based on systemic EFDT exposure comparisons between rat and rabbit, considering 379 pharmaceutical compounds for which rat and rabbit EFDT studies were performed.
The result emerging from this analysis is that, based on systemic exposure and after human equivalent dose conversion, the rat and rabbit show similar sensitivity (within 10-fold difference between systemic or HED dLOAEL in both species) to prenatal developmental exposure to pharmaceutical compounds for roughly 80% of compounds. The variation observed between species dLOAELs for these 80% of compounds is within the 10-fold difference that has been shown previously to roughly represent the variation between studies with the same compound in the same species (Janer et al. Citation2008). Differences in the severity of effects were regularly observed between species, but there was no clear trend of one species having severe effects occurring more often than in the other species, based on systemic maternal exposure comparison. For the roughly 20% of cases where rat and rabbit show different sensitivity (AUC and Cmax), the rabbit is the more sensitive species for approximately three quarters of these compounds. When the dose is expressed as HED, for those compounds with a dLOAEL in both species, the difference in species sensitivity is not apparent, i.e. differences in sensitivity were evenly split between rat and rabbit for HED (). While the HED analysis allowed inclusion of compounds without PK data, the relative difference in size of the database (283 compounds with AUC data compared to 378 compounds for HED) is unlikely to explain the difference in relative sensitivity for the two approaches. Overall effect severity incidences were distributed similarly in rat and rabbit studies. Individual rat and rabbit strains did not show a different general distribution of systemic exposure LOAELs as compared to all strains combined for each species, although different compounds were tested in different strains precluding definitive conclusions on strain effects. The HED conversion analysis seems to indicate that differences between species are largely related to compound absorption, distribution, metabolism, and excretion (ADME), rather than differences in sensitivity of developmental parameters. Knowledge about human versus animal ADME could be used in the selection of the first choice animal species for the developmental toxicity study, and potential justification for whether a second species is, in fact, necessary.
The roughly 20% of pharmaceuticals showing more than a 10-fold difference between rat and rabbit dLOAEL could not be attributed to specific modes of action or therapeutic target, although these data were only available for a subset of compounds. The reason why rabbits were more often sensitive to EFDT is unclear. The relative extent of embryo-fetal toxicity in the presence of maternal toxicity was not different between species, diminishing the likelihood that differential sensitivity to maternal toxicity plays a key role. In addition, a difference between species in the occurrence of embryo-fetal variations is unlikely as overall comparison between species was similar when variations were excluded. However, among others, the role of several variables such as choice of dose levels, plasma protein binding, and the window between no effect and lethality in which malformations can be observed, cannot be excluded based on this analysis. Hitting the exposure window for malformations is in part a matter of chance, which would be represented equally for both species. These retrospective comparative analyses of rat and rabbit developmental toxicity study outcomes of pharmaceutical compounds add to an earlier report of this group (Theunissen et al., Citation2016). These studies provide an important source of information for future discussions about possibilities for improvement and efficiency gain of developmental toxicity assessment in animal studies and their positioning in non-clinical testing strategies for pharmaceutical safety.
Declaration of interest
HESI, a global branch of the International Life Sciences Institute, is a publicly supported, tax-exempt organization that provides an international forum to advance the understanding of scientific issues related to human health, toxicology, risk assessment, and the environment through the engagement of scientists from academia, government, industry, NGOs, and other strategic partners. This HESI scientific initiative is primarily supported by in-kind contributions (from public and private sector participants) of time, expertise, and experimental effort. These contributions are supplemented by direct funding (that largely supports program infrastructure and management) that was provided by HESI's corporate sponsors. A list of supporting organizations is available at www.hesiglobal.org.
The authors of the paper volunteered to serve on the HESI DART committee that conducted these analyzes and prepared its conclusions and recommendations. The views expressed in this article are those of the authors and do not necessarily reflect the views or policies of their employers, including companies that manufacture and market some of the chemicals evaluated or similar products, the Dutch CBG-Medicines Evaluation Board, the Belgian Federal Agency for Medicines and Health Products, the U.S. Food & Drug Administration or the U.S. Environmental Protection Agency. There were no instances in which individuals advocated for particular treatment of a chemical manufactured and/or marketed by their employer. Mention of trade names or commercial products does not constitute endorsement or recommendation for use. GDC is involved in birth defects litigation, but not as it pertains to species selection for developmental and reproductive toxicity testing. No other authors have appeared in any legal proceedings concerning the general topic of this paper within the last 5 years.
All studies were conducted in accordance with the relevant Policies on the Care, Welfare and Treatment of Laboratory Animals and were reviewed by the Institutional Animal Care and Use Committees where the work was conducted.
| Abbreviations | ||
| AUC | = | area under the concentration-time curve |
| CBG-MEB | = | Dutch Medicines Evaluation Board |
| Cmax | = | maximum concentration |
| CTD | = | Common Technical Document |
| D | = | embryo-fetal death |
| DART | = | developmental and reproductive toxicology |
| dLOAEL | = | lowest observable adverse effect level for developmental toxicity |
| EFDT | = | embryo-fetal developmental toxicity |
| EMA | = | European Medicines Agency |
| EPA | = | Environmental Protection Agency |
| FDA | = | Food and Drug Administration |
| G | = | Growth Retardation |
| HED | = | human equivalent dose |
| HESI | = | Health and Environmental Sciences Institute |
| ICH | = | International Conference on Harmonization of Technical Requirements for Registration of Pharmaceuticals for Human Use |
| ILSI | = | International Life Sciences Institute |
| LOAEL | = | lowest observable adverse effect level |
| M | = | Malformation |
| mLOAEL | = | lowest observable adverse effect level for maternal toxicity |
| MoA | = | mode of action |
| OECD | = | Organization of Economic Co-Operation and Development |
| RIVM | = | National Institute for Public Health and the Environment, the Netherlands |
| TK | = | toxicokinetic |
| ToxRefDB | = | Toxicology Reference Database |
| V | = | Variation |
Acknowledgements
The authors gratefully acknowledge the extensive comments offered by the 7 reviewers selected by the Editor and anonymous to the authors. These comments were extraordinarily helpful in revising the paper. The authors would like to thank the members of the HESI DART Technical Committee and the CBG-MEB and EMA for sponsoring of the data and their scientific contribution, US EPA for providing and customizing the ToxRefDB, the University of Applied Sciences Utrecht for their administrative support and the RIVM for financial support and for hosting the project. HESI DART sponsor companies that contributed data toward this analysis were AstraZeneca, Bristol-Myers Squibb, Eli Lilly, GlaxoSmithKline, Janssen R&D, Merck, Pfizer, Sanofi, and Takeda.
Funding
SLIM project, by the Dutch Government, Dept. Econimical Affairs; The Utrecht Province and The Utrecht City Administration [PID101063]. ILSI Q67 HESI, 10.13039/100008663
Related Research Data
References
- FDA. 2005. Guidance for industry: estimating the maximum safe starting dose in initial clinical trials for therapeutics in adult healthy volunteers. Fed Register 70(140):42346.
- Hurtt ME, Cappon GD, Browning A. 2003. Proposal for a tiered approach to developmental toxicity testing for veterinary pharmaceutical products for food-producing animals. Food Chem Toxicol. 41:611–619.
- ICH. 2005. ICH harmonised tripartite guideline: detection of toxicity of reproduction for medicinal products and toxicity to male fertility S5(R2). Available from: http://www.ich.org/products/guidelines/safety/safety-single/article/detection-of-toxicity-to-reproduction-for-medicinal-products-toxicity-to-male-fertility.html
- Janer G, Slob W, Hakkert BC, Vermeire T, Piersma AH. 2008. A retrospective analysis of developmental toxicity studies in rat and rabbit: what is the added value of the rabbit as an additional test species? Regul Toxicol Pharmacol. 50:206–217.
- Knudsen TB, Martin MT, Kavlock RJ, Judson RS, Dix DJ, Singh AV. 2009. Profiling the activity of environmental chemicals in prenatal developmental toxicity studies using the U.S. EPA's ToxRefDB. Reprod Toxicol. 28:209–219.
- Loebstein R, Lalkin A, Koren G. 1997. Pharmacokinetic changes during pregnancy and their clinical relevance. Clin Pharmacokinet. 33:328–343.
- Makris SL, Solomon HM, Clark R, Shiota K, Barbellion S, Buschmann J, Ema M, Fujiwara M, Grote K, Hazelden KP, et al. 2009. Terminology of developmental abnormalities in common laboratory mammals (Version 2). Birth Defects Res Part B Develop Reprod Toxicol. 86:227–327.
- Martin MT, Judson RS, Reif DM, Kavlock RJ, Dix DJ. 2009. Profiling chemicals based on chronic toxicity results from the U.S. EPA ToxRef Database. Environ Health Perspect. 117:392–399.
- OECD. 2001. OECD guideline for the testing of chemicals, no. 414: prenatal developmental toxicity study. Paris, France: Organization for Economic Cooperation and Development.
- Schardein J. 2000. Chemically induced birth defects. New York: Marcel Decker Inc.
- Theunissen PT, Beken S, Beyer BK, Breslin WJ, Gappon GD, Chen CL, Chmielewski G, De Schaepdrijver L, Enright B, Foreman JE, et al. 2016. Comparison of rat and rabbit embryo-fetal developmental toxicity data for 379 pharmaceuticals: on the nature and severity of developmental effects. Criti Rev Toxicol. [Epub ahead of print]. doi: 10.1080/10408444.2016.1224807.
- Theunissen PT, Beken S, Cappon GD, Chen C, Hoberman AM, van der Laan JW, Stewart J, Piersma AH. 2014. Toward a comparative retrospective analysis of rat and rabbit developmental toxicity studies for pharmaceutical compounds. Reprod Toxicol. 47:27–32.