
 ?Mathematical formulae have been encoded as MathML and are displayed in this HTML version using MathJax in order to improve their display. Uncheck the box to turn MathJax off. This feature requires Javascript. Click on a formula to zoom.
Abstract
A new neutron depth profiling (NDP) spectrometer has been designed and built for the use at a high intensity focused cold neutron beam of the reflectometer MARIA at the Heinz Maier-Leibnitz Zentrum (MLZ, Germany). The extremely high neutron flux at the sample position of MARIA joined with the multiple charged particle detectors allows less than 10 s sampling rate and paves the way to study the kinetics of Li ions in thin-film microbatteries. The performance of the spectrometer with standard calibration samples and amorphous thin films is presented; possibilities to operando study the Li distribution inside thin-film rechargeable lithium batteries are discussed.
1. Introduction
Neutron depth profiling is a non-destructive analytical tool to study near-surface distributions of some light isotopes with high neutron capture cross-sections ( and few more) in solid materials. The neutron-absorption results in nuclei decay with the emission of a charged particle (α-particle, proton or triton) and a recoiling nucleus with well-known initial energies
. These particles are emitted isotropically and before escaping a sample surface, each particle looses a certain amount of energy
mainly because of the interactions with the atomic electrons of the host material. The amount of energy losses
defines the depth x at which the particle was created:
(1)
(1) where
represents the stopping power of the host material for a charged particle. A raw spectrum already depicts the concentration profile of the analyzed element. The spectrum can be unfolded taking the instrument resolution function and possible uncertainties into account (Citation1). By using measurements with a calibrated sample, the concentration depth profile can be derived in absolute units.
The NDP technique was first reported by J. Ziegler, G. W. Cole and J. E. E. Baglin in 1972 as a non-destructive tool to study impurities inside silicon substrates (Citation1). Around the same time and independently similar experimental approach was used by J. P. Biersack and D. Fink (Citation2). Later on, the technique was further advanced and a number of NDP instruments appeared around the world (e.g. (Citation3–5)). In the 1990s, the first up to our knowledge NDP facility utilizing a cold neutron beam from a cold source was built at NIST (Gaithersburg, Maryland, USA) (Citation6). While a cold neutron beam has lower mean energy of the spectrum, it results in stronger neutron absorption, thus, improving the sensitivity (minimum observable concentrations of the analyzed elements) and decreasing the measurement time.
A further step, utilizing a cold neutron beam transported along a neutron guide, was first realized by D.Fink and coworkers at HMI, Berlin, Germany (Citation2). Guided neutron beamlines offer much better background conditions in comparison with the beamlines located in the close vicinity of a research reactor and still deliver a high cold neutron flux. NDP technique advances here a lot in sensitivity, in ability to measure fast, in exploring thicker samples and in detection efficiency of low energy reaction products. During the last decade, NDP facilities utilizing guided cold neutron beams have been built at two new research reactor facilities – at HANARO (KAERI, Republic of Korea) (Citation7) and at CMRR (INPC, CAEP, China) (Citation8).
For more details about the NDP technique, its history and applications, we refer the reader to (Citation2). Almost all NDP references up to the present compiled by R.G. Downing can be found at (https://sites.google.com/site/nistndp/home).
Recently, a demanding studies of lithium-ion batteries (LIB) created a new interest in the NDP technique because of its sensitivity to isotope . NDP offers here a number of advantages. As NDP can be considered non-destructive, Li distribution inside a battery cell can be studied operando during battery charging and discharging for many cycles. After the data unfolding procedure, Li concentration is obtained quantitatively, which is hardly possible for Li by other methods. The natural limitations of the NDP technique, such as a limited range of charged particles in solids and sensitivity to sample roughness and homogeneity, limits the application mainly to thin solid-state planar batteries. Only in this case, an Li profile through the entire battery cell can be derived with high resolution by analysis of α-particle signal. Examples of NDP being applied to operando study solid-state thin-film LIB can be found in (Citation9, Citation10). The moderate neutron flux and single charged particle detector available at the NDP facility (Citation9, Citation10) made 10 min measurement time for a single NDP spectrum possible. To be able to get a single spectrum faster, we proposed to perform NDP experiments on a focused cold neutron beam with multiple charged particle detectors (Citation11). Following this idea, we designed and built a dedicated NDP spectrometer at the JCNS for the use at high-intense vertically focused cold neutron beam of the reflectometer MARIA (Citation12). In this paper, we are going to report on spectrometer specifications and performance with standard as well as real samples.
2. JCNS NDP spectrometer
2.1. Neutron beamlines
The reflectometer MARIA is facing a cold neutron guide NL5 that is fed by the cold neutron source of research reactor FRM II (Citation13). The last part of the instrument neutron guiding system is a vertically focusing elliptic guide that delivers the neutron beam from a 10 velocity selector to the sample position. The maximum flux of
is achieved for the uncollimated beam with 5 Åneutrons (thermal equivalent flux of
). The beam size at the sample position can be as large as
(width x height). The beam can be shaped horizontally by the two pairs of slits before and after a focusing guide that allows precise collimation of the neutron beam in respect to the sample dimensions, allowing us to avoid the over illumination of the sample and, thus, minimizing the background that could be created after neutron-induced activation of the chamber and its internal parts. Neutron beam monitors of MARIA can be used to calibrate each NDP measurement in respect to reactor / cold source performance. The NDP chamber is placed with a stationary holder on the MARIA sample table. To align a sample, the chamber is used in transmission mode with a position-sensitive detector of MARIA. Horizontal and vertical scanning is defining precisely the position of an absorbing sample in the beam. During NDP measurements, the beamstop made of
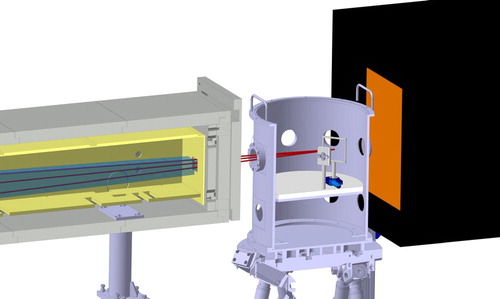
-polymer shielding is placed between the chamber and detector arm of MARIA. The schematic CAD drawing of the setup is shown in Figure .
Figure 1. CAD drawing of the JCNS NDP chamber installed on the sample table of reflectometer MARIA. Cut-view.
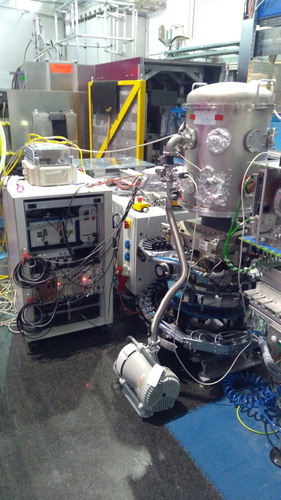
For conventional (without fast kinetics) or preliminary measurements, the spectrometer keeps the versatility to operate at the medium flux test reflectometer TREFF available in the neutron guide hall of FRM II, MLZ (Citation14). TREFF is a high resolution reflectometer where beam is cut from the lower part of a neutron guide NL5 with a double PG-monochromator (set to 4.74 Å primary wavelength). The maximum flux at the sample position including higher orders of reflection from a monochromator reaches (width x height) for uncollimated beam. Two parallel monochromators create a neutron beam of the size of appr.
that can be further shaped by two pairs of slits along the reflectometer collimation. The procedure of alignment and measurements is similar to described above for MARIA. The spectrometer installed at TREFF is shown in Figure .
Figure 2. NDP spectrometer installed at the sample position of the reflectometer TREFF.
2.2. Sample chamber
The NDP vacuum sample chamber is made from stainless steel and is equipped with 16 vacuum flanges. Four flanges are used to neutron beam entrance/exit at different heights depending on the beamline (MARIA or TREFF). The flanges have an approximately 0.1 mm thick aluminum alloy windows with 70 mm opening for a neutron beam. Rest of the ports are used for detector electronics connection, motorized stages, vacuum pump connection and reserved for future application. The chamber has a cylindrical shape, the inner dimensions are ⊘ 600 × 500 mm – to have enough space for a multiple detector system, shielding and to be able to house sample environment if required. The interior of the chamber can be accessed via the top spherical stainless steel cap. The desired vacuum level of less than mbar is achieved in less than 5 min.
The detector holder(s) and the sample holder are placed inside the chamber on a 20 mm thick PTFE plate, which is supported by 10 mm thick aluminum plate (see Figure ). The plates can be fixed at two different heights, providing flexibility for different beamlines. Holders for the sample and detector(s) are also made of PTFE to minimize possible background caused by neutron-induced activation and to keep the detectors electrically isolated from the chamber. Sample holders have thin PTFE wires for fixing a sample. Despite the extremely thin aluminum entrance window and PTFE interior, gamma background is still produced and additional lead shielding of charged particle detectors inside is required (not shown in Figure for better visibility).
Figure 3. The interior of the NDP sample chamber with standard sample holder and single detector. Radiation shielding is removed for visibility.
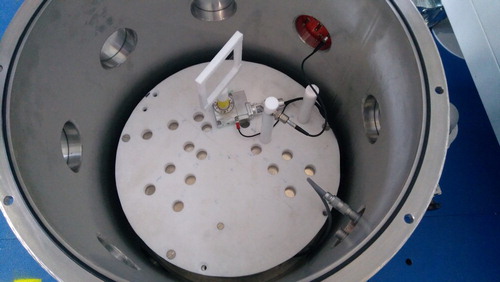
The spectrometer is at present equipped with up to 4 PIPS ( Canberra GmbH) charged particle detectors, while more detectors are planned for the near future. The active area of the standard detector is . The detector(s) can be placed at different angles both by rotating a sample with a rotation stage and by placing mechanically detector(s) at different angles. The distance between sample and detector can be changed between 35 and 150 mm, thus giving an opportunity to decrease/increase the solid acceptance angle for a single standard detector up to eight times. Alternatively, larger (
) or smaller (
) detectors can be used. All these options give a versatility for tuning the resolution versus counting rate in each particular measurement.
2.3. Electronics
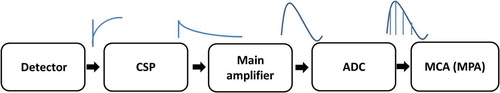
The schematic view of the readout chain, as well as the schematic representation of the pulse height analysis procedure, are shown in Figure . The signals from charged particle detectors are further processed in the charge-integrating preamplifier (CSP), main spectroscopy shaping amplifier with further fast analog to digital converter (ADC) to digitize the pulses and multi-channel analyzer (MCA) to save the spectra and forward it into the PC. MCA range can be preset to different values depending on the counting rate and resolution requirements. By default, the range is 8192 number of energy channels. The preamplifiers are fixed directly at one of the chamber ports while all further electronics is housed in a stand-alone rack (see Figure ).
Figure 4. A block diagram of the detector signal readout chain of JCNS NDP spectrometer.
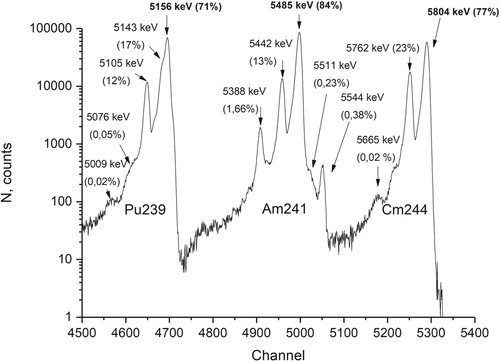
We have tested the detector readout chain with 3kBq mixed α-particle source ( Am,
Pu,
Cm). The spectrum is shown in Figure . If we calculate the calibration parameters between the most pronounced peaks of Cm (5804 keV) and Pu (5156 keV), it results in
keV per 1 MCA channel for a corresponding energy range, giving the energy resolution of
keV in this energy range for the detection of α-particles. The obtained energy resolution of 11 keV coincides with the value declared by the manufacturer of detectors.
Figure 5. Spectrum collected from a 3 kBq mixed α-particle source ( Pu,
Am,
Cm) with 30 mm sample to detector distance.
3. Performance of the new NDP spectrometer with standard NDP samples and  thin films.
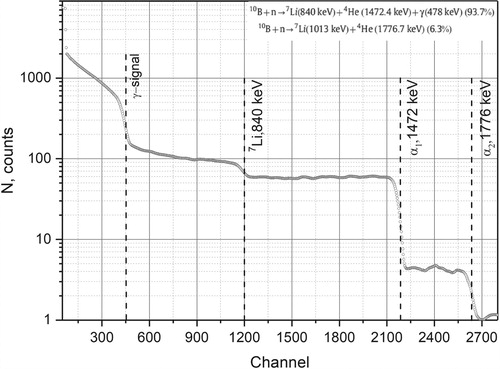
To get the spectrometer characteristics during neutron measurements, NDP standard samples and specially deposited thin films have been measured at MARIA. Energy resolution parameters were obtained from the measurement of standard reference material sample SRM93a (NIST, USA). The sample consists of a 6 mm thick, 32 mm wide in diameter piece of borosilicate glass (with
content) and can be used to perform energy-channel calibration of NDP detecting system (Citation7). The signal created after neutron capture should have a uniform distribution with a steep edge for highest energies (particles from a surface) of 1472 and 1776 keV (see Figure ). Below the channel 480, the contribution from γ–signal coming from the sample itself (i.e. 480 keV γ–rays produced after neutron capture in
) appears. As the reaction cross-section for the first reaction channel is considerably larger (counting statistics is correspondingly proportional) – the energy edge for 1472 keV is used to determine the resolution parameters. The 90 min measurement has been performed with the sample to detector distance of 100 mm.
Figure 6. Spectrum collected from SRM–93a borosilicate glass. Highest energies (particles from the sample surface) are marked with dashed lines.
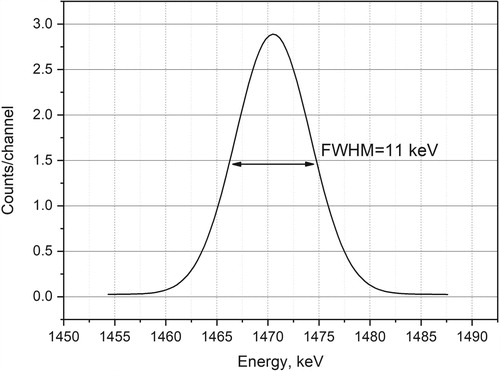
The smoothed first derivative of the energy edge for 1472 keV gives a bell shape curve with FWHM of 11 keV (see Figure ), that can be considered as the spectrometer energy resolution for α-particles produced after reaction.
Figure 7. Inverted first derivative of the energy edge 1472 keV. Represents energy resolution of the NDP detectors system.
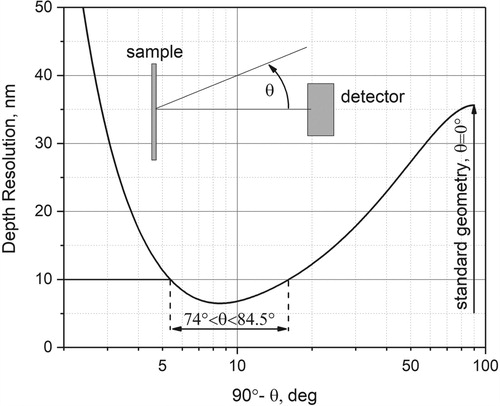
The theoretically achievable depth resolution in NDP analysis can be estimated according to (Citation15):
(2)
(2) where θ is the angle between the detector and sample normal,
represents stopping power of host material,
– uncertainty in measured energy loss. For calculating
, we have taken the following parameters into account (Citation15): energy resolution, uncertainty of θ within the solid acceptance angle of the detector, effects from energy struggling and nuclear scattering. We have estimated the achievable depth resolution for a typical thin-film LIB component
electrode film as a function of the angle θ (see Figure ). The resolution for standard geometry (detector surface is perpendicular to the sample surface normal) exceeds 35 nm, while resolution for glancing angles geometry (
) is less than 10 nm (the estimate is given with the assumption of 100 nm thin sample and
density, the stopping power was calculated with SRIM softwareFootnote1 and was taken to be constant for simplicity).
Figure 8. Achievable depth resolution for the 100 nm thin film.
For unfolding of the measured raw data, the determination of the detector energy response function is required. Any measured spectra is a concentration profile of an analyzed isotope
convoluted with the detector response function
that includes possible uncertainties in measured energy and background (Citation16–19):
(3)
(3) the response function
here gives a probability of a particle emitted from depth x being detected with energy E. The response function can be simulated (Citation17–19) or it can be derived for particular isotope and sample from the measurement. To derive one for α-particlesFootnote2 emitted after
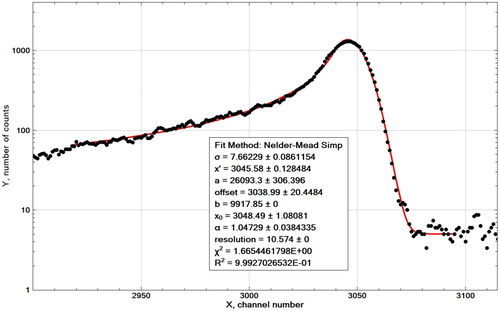
He reaction, we have been using 15 nm thick
(95%
) amorphous thin film deposited on a silicon substrate. For a standard geometry, the layer of 15 nm is less then theoretical resolution with α-particle for
thin film (which is
nm for 100 nm film with
density), so we assume that 15 nm thin film acts as a ‘single’ layer and the measured spectrum represents a pure detector response. The measured α-signal and the fit are shown in Figure . As a fitting function, we used a Gaussian function for the main peak and power law on the left tail of the peak by the analogy with (Citation20):
(4)
(4) where
is set manually to the channel number 3038. The left tail is produced mostly due to incomplete collection of charge generated by α-particles in the detector. The peak form which is nearly Gaussian with FWHM = 11 keV (in accord with the spectrometer resolution mentioned above) represents the response function for particles emitted from a ‘single’ layer or the sample surface. For the particles emitted from the sample interior, the width of the response function will increase due to contributions from statistical fluctuations in particle energy loss (multiple scattering, energy straggling, etc.). As well the response function can be also affected by the geometrical arrangement of an experiment (e.g. for glancing angle geometry).
Figure 9. α-signal collected from 15 nm thick thin film (circles) and a fit (solid line).
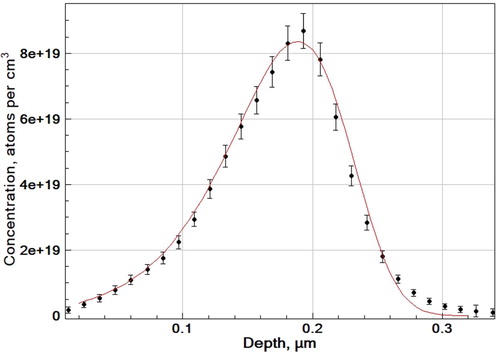
Consequently, NDP calibration standard SRM2137 (NIST) has been measured (Figure ). The sample consists of boron implanted into a silicon wafer. The Boron depth distribution is certified by NIST after performing several secondary ion mass spectrometry (SIMS) measurements. The unfolded depth profile after NDP measurement and comparison to the certified Boron distribution are shown in Figure . The unfolding procedure has been performed using the software developed in (Citation16, Citation21). Small deviations on the right shoulder are caused by the above-mentioned asymmetry in detector response function while the available software operates only with symmetric Gaussian response.
Figure 10. Unfolded NDP spectrum of SRM–2137 collected on MARIA in roughly 14h. Solid line – certified values, dots – as measured.
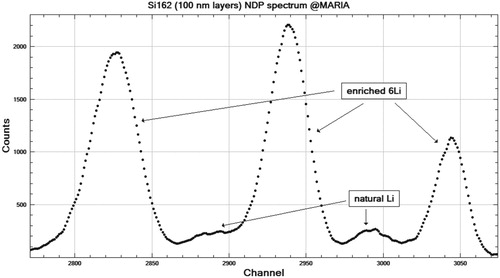
To improve the statistics during the NDP measurements, deposition of the samples with enrichment of neutron-absorbing isotopes should be considered. For example, for Li-enriched samples a gain factor of up to 13 in comparison with natural
Li-abundance samples (7,5%) can correspondingly reduce the minimum time required to get a desired spectrum. To prove this idea, a thin film
sample, having
Li-enriched layers, has been measured. The structure of the sample is as follows: three
layers, two
layers and 4 Si spacer layers in between, The
isotope fraction of the
and
layers is 0.95 and 0.07, respectively. The thicknesses of the
layers and Si spacer layers are 45 nm and 95 nm, respectively. All
layers have an amorphous structure. The measured spectrum is shown in Figure . As expected,
Li-enriched layers are giving 13 times stronger signal with respect to absorbing isotope abundance. For operando studies of thin-film batteries, the deposition of samples with
Li-enriched layers is certainly of advantage.
Figure 11. α-peak region of the smoothed spectrum collected for multilayer thin-film sample .
4. Test measurements with lithium thin-film batteries.
The next step in exploring the capabilities of the new spectrometer were the measurements of thin-film Li-ion battery samples in their as-deposited state. Thin-film half cell battery samples of different thicknesses – comprising single electrode film and electrode/electrolyte films
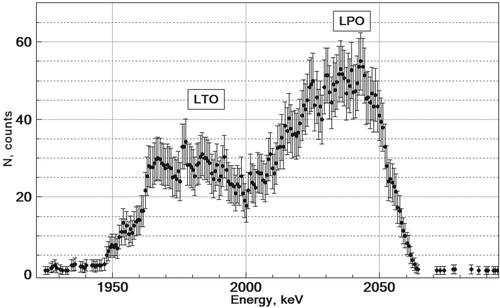
were deposited on silicon substrates by metal-organic chemical vapor deposition method (MOCVD). Spectra collected for 90 min from
and
films are shown in Figure . The example of unfolded spectrum for the thickest sample is shown in Figure . All samples in this section were deposited with the natural abundance (not exceeding
) of neutron-absorbing isotope
Li.
Figure 12. Smoothed spectra collected on MARIA in 90 minutes for thin films – single film (LTO) and double layer films
(LTO–LPO).
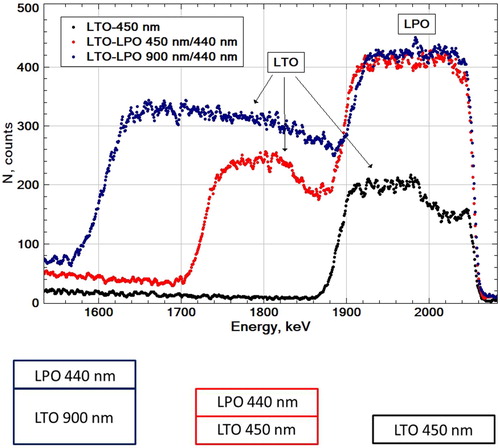
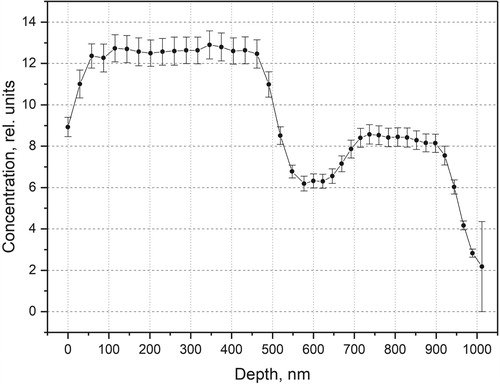
Figure 13. Unfolded Li depth profile (in relative units) of film.
The counting time that will be required for reliable measurements of a battery-type sample can be estimated using the result of 10 min measurements of thin-film (see Figure ). Despite of short measurement time, the statistical errors are still sufficiently small and do not mask the observed features – the difference in Li concentration between electrode
and electrolyte
. The use of fully
Li-enriched samples and 8 detectors of charged particles will result in 13 and 8 times increase in the number of collected charged particles, respectively. Indeed, in such case, the same counting statistics will be achieved within the data collection time of less than 10 s. Such an extremely fast operando NDP studies of LIB during charging and discharging have been never realized before and should give a clearer picture of the battery chemistry evolution in time.
Figure 14. Smoothed spectra collected on MARIA for sample (LTO–LPO).
5. Conclusions
A new neutron depth profiling spectrometer has been designed and made operational at the focused cold neutron beam of the JCNS reflectometer MARIA. The spectrometer has been tested and characterized with standard NDP samples and different amorphous thin films. The measurements of thin-film LIB samples in as-deposited state provided the information on the achievable rate for operando studies – single meaningful NDP spectrum can be obtained for a
-enriched thin-film LIB in less than 10 s. Further steps to improve the spectrometer performance, such as using a 2-D focused neutron beam, increasing the number of charged particle detectors and further reduction of the background, are planned for the near future.
Disclosure statement
No potential conflict of interest was reported by the authors.
Additional information
Funding
Notes
2 In this paper, we focus only on α-particle part of spectra for He products, as signal from α-particles provides significantly higher depth resolution than
-signal.
References
- Ziegler, J.F.; Cole, G.W.; Baglin, J.E.E. J. Appl. Phys. 1972, 43, 3809–3815. doi: 10.1063/1.1661816
- Fink, D. Neutron Depth Profiling, HMI-B 539, HMI Berlin, Germany, 1996.
- Müller, K.; Henkelmann, R.; Boroffka, H. Nucl. Inst. Methods 1975, 129, 557. doi: 10.1016/0029-554X(75)90751-X
- Downing, R.G.; Fleming, R.F.; Langland, J.K.; Vincent, D.H. Nucl. Inst. Methods Phys. Res. 1983, 218, 47–51. doi: 10.1016/0167-5087(83)90953-5
- Cervena, J.; Hnatowicz, V.; Hoffman, J.; Kosina, Z.; Kvitek, J.; Onheiser, P. Nucl. Inst. Methods 1981, 188, 185–189. doi: 10.1016/0029-554X(81)90337-2
- Downing, R.G.; Lamaze, G.P.; Langland, J.K.; Hwang, S.T. J. Res. Natl. Inst. Stand. Technol. 1993, 98, 109–126. doi: 10.6028/jres.098.008
- Park, B.G.; Sun, G.M.; Choi, H.D. Nucl. Inst. Methods Phys. Res. A 2014, 752, 20–26. doi: 10.1016/j.nima.2014.03.003
- Li, R.-D.; Yang, X.; Wang, G.-B.; Dou, H.-F.; Qian, D.-Z.; Wang, S.-Y. Nucl. Inst. Methods Phys. Res. A 2015, 788, 1–4. doi: 10.1016/j.nima.2015.03.058
- Oudenhoven, J.F.M.; Labohm, F.; Mulder, M.; Niessen, R.A.H.; Mulder, F.M.; Notten, P.H.L. Adv. Mater. 2011, 23, 4103–4106. doi: 10.1002/adma.201101819
- Chen, C.; Oudenhoven, J.F.M.; Danilov, D.L.; Vezhlev, E.; Gao, L.; Li, N.; Mulder, F.M.; Eichel, R.-A.; Notten, P.H.L. Adv. Energy Mater. 2018, 8, 1801430. doi: 10.1002/aenm.201801430
- Vezhlev, E. Neutron Depth Profiling at the Focused Beam of MARIA. Joint Annual Report 2015 of the MLZ and FRM II, 2017.
- Mattauch, S.; Koutsioubas, A.; Räcker, U.; Korolkov, D.; Fracassi, V.; Daemen, J.; Schmitz, R.; Bussmann, K.; Suxdorf, F.; Wagener, M.; Kämmerling, P.; Kleines, H.; Fleischhauer-Fuß, L.; Bednareck, M.; Ossoviy, V.; Nebel, A.; Stronciwilk, P.; Staringer, S.; Gd̈el, M.; Richter, A.; Kusche, H.; Kohnke, T.; Ioffe, A.; Babcock, E.; Salhi, Z.; Bruckel, T. J. Appl. Crystallogr. May 29, 2018, 51 (Pt 3), 646–654.
- FRM II – Heinz Maier-Leibnitz Zentrum: http://www.mlz-garching.de/.
- Heinz Maier-Leibnitz Zentrum. J. Large-scale Res. Facil. 2017, 3, A121. doi: 10.17815/jlsrf-3-161
- Biersack, J.P.; Fink, D.; Henkelmann, R.; Moller, K. Nucl. Inst. Methods 1978, 149, 93–97. doi: 10.1016/0029-554X(78)90844-3
- Kotas, P.; Obrusnik, I.; Kvitek, J.; Hnatowicz, V. J. Radioanal. Chem. 1976, 30, 475–488. doi: 10.1007/BF02516983
- Coakley, K.J.; Downing, R.G.; Lamaze, G.P.; Hofsäss, H.C.; Biegel, J.; Ronning, C. Nucl. Inst. Methods Phys. Res. A 1995, 366, 137–144. doi: 10.1016/0168-9002(95)00519-6
- Yang, X.; Downing, R.G.; Wang, G.B.; Qian, D.Z.; Liu, H.G.; Wang, K. J. Radioanal. Nucl. Chem. 2014, 301, 213–220. doi: 10.1007/s10967-014-3126-x
- Dou, H.F.; Li, R.D.; Xu, J.Y.; Yuan, S.; Tang, F.P.; Yang, X. Sci. China Technol. Sci. 2014, 57 (1), 35–38.
- Longoria, L.C.; Naboulsi, A.H.; Gray, P.W.; MacMahon, T.D. Nucl. Inst. Methods Phys. Res. 1990, A299, 308–312. doi: 10.1016/0168-9002(90)90797-A
- Hnatowicz, V.; Vacik, J.; Fink, D. Rev. Sci. Ins. 2010, 81, 073906. doi: 10.1063/1.3463692