
 ?Mathematical formulae have been encoded as MathML and are displayed in this HTML version using MathJax in order to improve their display. Uncheck the box to turn MathJax off. This feature requires Javascript. Click on a formula to zoom.
Abstract
The evolution of triangular surface structures with different sizes, the roughening of initially smooth surfaces, and the smoothing of initially rough surfaces were studied by computer simulations for sputtering by 5 keV argon on copper at normal incidence as a function of incident fluence. The program SDTrimSP-2D was used in binary collision approximation, diffusion was neglected. As already predicted by Sigmund [J. Mater. Sci. 1973, 8, 1545], a triangular ridge is relatively stable under bombardment at low fluences. However, at fluences above a critical fluence, it eventually flattens out and finally disappears. Initially smooth surfaces get rougher during bombardment, the roughness increases as the square root of incident fluence. This effect is more pronounced for larger metaparticle sizes. Initially rough surfaces get smoother by sputtering, the final smoothness depends on the initial degree of roughness. The smoothing process follows a characteristic pattern with smaller-scale roughness disappearing first and larger-scale roughness remaining stable until higher fluences. This effect gets visible in the Fourier-spectrum of the rough surface as damping of higher frequencies.
1. Introduction
The ejection of particles from a target surface by bombardment with energetic particles, called sputtering [Citation1–4], is observed in nature as a result of the interaction of energetic particles with surfaces in space [Citation5]. But sputtering also has high relevance for many technical applications and is the basis for sputter deposition of thin films [Citation6] and sputter etching in semiconductor processing [Citation7]. A number of depth-profiling methods, such as Secondary Ion Mass Spectrometry (SIMS), Sputter X-Ray Photoelectron Spectrometry (Sputter XPS), or Glow Discharge Optical Emission Spectroscopy (GDOES), are based on sputtering, and it is the dominating erosion process at the vessel walls in fusion devices [Citation8].
Technical surfaces are usually not smooth but have some degree of roughness. It has been already shown experimentally and by computer simulations, that the sputtering yield of a rough surface can deviate significantly from a smooth surface [Citation9–12]: At normal incidence, the sputtering yield of a rough surface is typically higher than that of a smooth surface, while at grazing incidence, the sputtering yield of a rough surface is lower than that of a smooth surface. This is due to the distribution of (local) angles of incidence due to the additional (local) slope of the rough surface and due to additional redeposition of ejected particles on a rough surface.
Computer simulations of sputtering can be performed using the original analytical Sigmund model of sputtering [Citation13,Citation14] or some extension of it, for example, the modified Sigmund model by Bradley and Hofsäss with increased accuracy at grazing angles of incidence [Citation15]. In the Sigmund model, the energy deposition below the surface has a Gaussian ellipsoidal shape, and the sputtering yield is proportional to the nuclear energy loss in the near-surface layer. The sputtering yield for a smooth surface, which is usually necessary for further calculations in the framework of the Sigmund theory, is typically taken from a Monte-Carlo code, either in binary collision approximation or from molecular dynamics.
On a curved surface, the number of locally ejected particles is proportional to the local energy density: For concave surfaces, the energy density is increased due to the overlap of the energy-deposition ellipses, resulting in an increase of the sputtering yield, while convex surfaces show a reduced sputtering yield. This results in the well-known prediction of Sigmund for the erosion of a cone, where the ‘regression speed is greatest at the lower edge …and smallest near the top’ [Citation14, Figure 17]. In the Bradley and Harper's extension [Citation16] of Sigmund's theory the local sputtering yield of a curved surface is enhanced or decreased proportional to a/R, with a the mean range of ion penetration and R the local radius of the curvature. The velocity of erosion is then faster for a trough than for a crest [Citation17].
The Bradley and Harper model can be coupled with surface diffusion terms for adatoms or vacancies [Citation17–19], allowing to calculate the evolution of surfaces and the formation of self-assembled patterns like wavy ripples or pyramids during sputtering. This approach proved to be very successful, see [Citation17–19] and the literature cited therein. However, despite its success the Sigmund model and its extensions are continuity models of solids neglecting the atomic structure. The Sigmund model is successful if collision cascades are large, but gets less accurate for light ions (which produce smaller cascades) and at energies close to the threshold energy where the assumption of the sputtering yield being proportional to the nuclear energy loss does not hold. The approximation of the energy deposition as a Gaussian ellipsoid has only limited accuracy [Citation20]. Moreover, the Sigmund model neglects the redistribution of non-sputtered target atoms [Citation19] and the redeposition of sputtered atoms on a rough surface [Citation9,Citation10].
A more detailed but computationally much more expensive approach is the use of Monte-Carlo codes, where the time evolution of the movement of individual incident ions, recoils and sputtered atoms is followed. This can be done efficiently using the binary-collision approximation (BCA) [Citation21,Citation22]. The code TRIM.SP [Citation21–23] and its successors in the SDTrimSP line [Citation24,Citation25] show very good agreement with experimental data on reflection coefficients and sputtering yields from smooth targets [Citation4,Citation26]. The evolution of 1-dimensional targets during ion bombardment and sputtering as a function of incident fluence was initially implemented in the TRIDYN code [Citation22,Citation27]. This code was recently unified with SDTrimSP and extended to 2- and 3-dimensional structures [Citation11,Citation28,Citation29]. It was benchmarked by comparison to experimental data from well-defined 3-dimensional surface structures like gratings [Citation30,Citation31] or columns [Citation32] bombarded parallel, perpendicular or at some angle to the structures.
The binary-collision approximation has limitations at very low energies below about 30 eV. Molecular Dynamics (MD) simulations provide improved accuracy, but at the cost of highly increased computing times. While the calculation of sputtering yields from rough surfaces is still feasible with MD [Citation22], the evolution of surface structures with fluence has not been calculated yet [Citation22].
In this paper, the 2-dimensional BCA-code SDTrimSP-2D is used to re-visit the classical example of Sigmund on the erosion of a cone [Citation14] in order to test the validity and the limits of the Sigmund theory for the erosion of rough surfaces. Roughening of an initially smooth surface is investigated in Section 3.2, and smoothing of rough surfaces in Section 3.3. The formation of regular surface structures, such as wavy ripples or pyramids, is related to the interplay between erosion and diffusion of adatoms or vacancies [Citation17–19] and will not be treated here, as all simulations are without diffusion, i.e. diffusion of adatoms or vacancies is not taken into account.
2. Simulation environment and parameters
The code SDTrimSP-2D [Citation11,Citation28,Citation29] was used for all simulations. The target was copper bombarded with 5 keV Ar ions at normal incidence. The discretization of the targets into individual pixels was Å parallel to the surface and
Å perpendicular to the surface for rough surfaces and 5 Å
5 Å for the ridge. The interaction potential was the KrC-Potential and the Lindhard-Scharff inelastic energy-loss model was used [Citation33,Citation34]. To reduce computational effort, the code groups multiple particles into one projectile, called a metaparticle. Each metaparticle contains n real particles, given by
(1)
(1)
where
describes the number of metaparticles used. The area is the length of the surface multiplied with 1 Å, serving as a virtual third dimension. The surface binding energies are already provided by SDTrim and are taken from H.H. Binder [Citation35–38] as 3.49 eV for copper. Diffusion of atoms and vacancies is neglected.
The computing times of simulations vary largely depending on the size of the surface, metaparticle size and discretization. While some simulations, such as a small ridge, can be computed within a few hours, larger simulations can take several days to complete on a single Toki-Core.
To speed up calculations, SDTrimSP offers efficient parallelisation. In the case of a Linux Cluster, a parallel efficiency of 0.738 was achieved for 64 (2.8 GHz, Intel) processors, i.e. a simulation with 64 processors will be about 47 times faster compared to just one processor. Efficiencies for IBM processors tend to be even better at above 0.97 for 512 processors [Citation24].
The geometries for initial surfaces were generated in the form , with x the coordinate parallel and y the coordinate perpendicular to the surface direction. Random rough surfaces were generated via a Gauss-distributed random variable with standard deviation σ for the y-values for every step d in x-direction. These random points were connected linearly. d was determined by pre-selecting the total number of hills and valleys. d was always larger than the pixel discretization so that each slope consisted of multiple pixels.
All particles are followed until they either come to rest or leave the simulation volume. Periodic boundary conditions were used, i.e. particles leaving on the right side will re-enter on the left side and vice versa. The incident beam always covered the whole surface.
In the following, the word ‘roughness’ refers to the standard deviation σ of the surface. It is calculated as
(2)
(2)
with μ being the mean height of the surface (i.e. the mean of all y-values), y being they-values and N the number of points in a given surface.
3. Results
3.1. Sputtering of a ridge
Sigmund argued in [Citation14] that a ridge located on a plane surface with a height of the order of the energy deposition depth should be relatively stable under ion bombardment. A schematic representation is shown in Figure , where the bold line represents the initial surface, and the dotted line refers to the surface after sputtering by some incident particle fluence. Sigmund argues that ‘The regression speed is greatest at the lower edge, slightly smaller on the slope, considerably smaller on the horizontal plane, and smallest near the top’ [Citation14].
Figure 1. Schematic representation of the Sigmund model of a ridge (solid line) and his prediction for the evolution of the surface by sputtering (dotted line). From [Citation14].
![Figure 1. Schematic representation of the Sigmund model of a ridge (solid line) and his prediction for the evolution of the surface by sputtering (dotted line). From [Citation14].](/cms/asset/06c7d6d5-c2b2-4759-bbd9-65c83367fdf3/grad_a_2098751_f0001_ob.jpg)
In the following, the sputtering of such a ridge is simulated using SDTrimSP-2D. An example of a ridge is shown in Figure (top left frame) before the sputtering. It has a height of 90 Å and a width of 140 Å, resulting in an opening angle of about 39. For this calculation, the discretization was chosen as
Å
. This pixel size is large enough that each pixel still contains a few atoms, while the pixels are small enough (compared to the size of the structure and the penetration depth) to avoid artefacts by too coarse pixeling [Citation11]. The size of the meta particles was chosen to be 2.
Figure 2. The Sigmund ridge in SDTrimSP-2D. The steps on the edges are due to the discretization of the surface contour. Ridge height 90 Å, ridge width 140 Å, pixel size Å
. (top left frame). The evolution of the ridge is shown for different incident fluences. Material Cu, bombardement by 5 keV Ar ions at normal incidence.
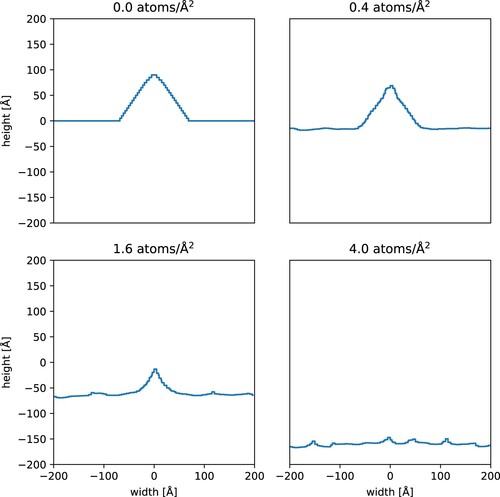
The average penetration depth of 5 keV Ar ions in Cu is 39.2 Å with a standard deviation of 22.5 Å, the sputtering yield ranges between 3.8 and 4.2 sputtered atoms per incident ion.
Figure shows the evolution of the ridge by the sputtering process for different fluences. The ridge is relatively stable for small fluences. However, at larger fluences the height of the ridge gets smaller and smaller until the remainder of the ridge starts to get indistinguishable from the statistical roughness fluctuations in the plane, see Section 3.2.
In order to quantify the stability of the ridge, we introduce the triangularity Δ, defined as the height of the triangular ridge divided by its width (see Figure ). Figure shows Δ as a function of incident Ar fluence for ridges with identical initial shapes (i.e. identical triangularity), but different initial heights. The shape of the ridge remains almost stable up to a critical incident fluence (about 6 ions/cm for the initially 490 Å high ridge, see Figure ). At fluences above the critical fluence the triangularity decreases about linearly until it finally cannot be distinguished from the sputter-induced roughening of the plane. It should be noted that already at fluences below the critical fluence, where the global shape of the ridge (as measured by the triangularity) remains stable, the shape in detail shows a sharpening of the tip of the ridge and a small flattening of the sides, see Figure upper right. The schematic representation shown in Figure is qualitatively correct, but somewhat exaggerated with respect to the sharpness of the tip and the depth of the ditches at the transition from the triangle to the surrounding plane. These small changes are the precursor of the following global flattening of the ridge at fluences above the critical fluence, as measured by the triangularity.
Figure 3. Sketch of the quantification of the shape of the ridge. The height is the distance between the maximum and the mean of the plane. The width is the distance between the first points left and right of the maximum that lies beneath the mean of the plane.
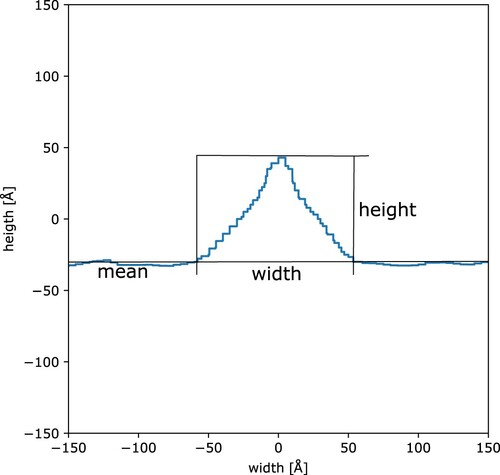
Figure 4. Triangularity of the ridge as a function of incident fluence. Material Cu, bombardment by 5 keV Ar ions at normal incidence. The plot shows the evolution of the shape of ridges of different initial heights (given in Å). At higher fluences the chosen measurement cannot distinguish the ridge from the fluctuations of the plane background.
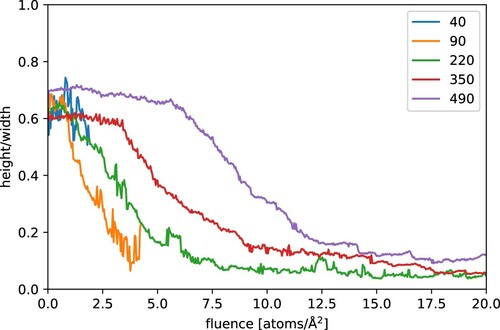
The argument by Sigmund about the stability of the ridge is therefore correct, but only for sufficiently small fluences: At small fluences the ridge remains stable and keeps its global shape. At larger fluences, however, the ridge gets unstable and slowly disappears until its remnants cannot be distinguished from the statistical fluctuations of the roughening of the plane. Smaller ridges disappear already at smaller incident fluences, while larger ridges keep their shape until a critical larger fluence, see Figure . This is a very fundamental property of the sputtering process that governs the evolution of rough surfaces, as will be discussed in more detail in Section 3.3.
3.2. Smooth surfaces
This section investigates the roughening of a smooth surface due to sputtering. The initial surfaces are assumed to be perfectly smooth. It should be kept in mind, however, what ‘perfectly smooth’ means: SDTrimSP assumes an amorphous target with random distribution of atoms. For such an amorphous target the heights of atoms at the surface are also randomly distributed, i.e. a perfectly smooth surface in the SDTrimSP point of view has a roughness of about d/2, where d is the mean inter-atomic distance.
Without diffusion a smooth surface will generally get rougher when eroded by sputtering, because each incident particle removes atoms close to its location of impact and relocates atoms towards the sides, i.e. it creates a small crater with a rim. At small incident fluences the initially smooth surface therefore gets dotted with small impact craters. At higher fluences the impact craters start to overlap, but due to the statistical nature of the impacts this never results in a smooth surface. At elevated temperatures surface atoms may diffuse, which can counteract the described roughening effect. Surface diffusion is not considered in this work.
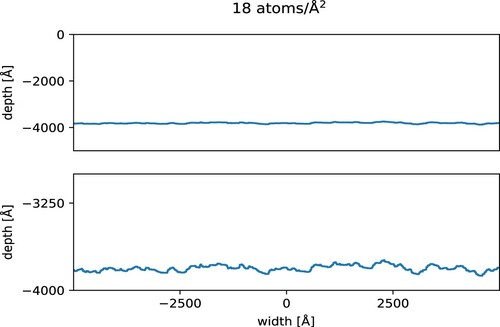
While it is evident that a smooth surface will roughen up when sputtered, the degree of roughening as a function of incident fluence is not obvious. Figure shows as an example an initially smooth surface after sputtering with a fluence of 18 atoms/Å. The surface is clearly more rough than the initial surface.
Figure 5. Evolution of an initially smooth surface by sputtering. The initial surface was at a depth of zero. Both figures show the same surface with the bottom one being zoomed in for better visibility.
SDTrimSP uses incident metaparticles instead of real particles in order to speed up calculations, where the size of a metaparticle is given by Equation (Equation1(1)
(1) ). Size is here referring to the number of particles considered as one incident metaparticle and not to the spatial extension of the particles. While in most cases, metaparticles are only a mean to speed up the calculation, for incident cluster ions, the size of a metaparticle is identical to the number of atoms in the cluster.
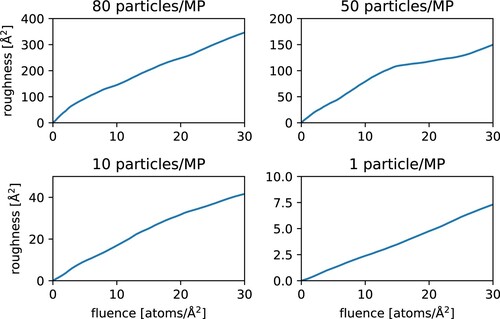
As can be seen in Figure the variance of the roughness increases about linearly with incident fluence, i.e. the roughness σ (see Section 2) increases as a square root of fluence:
(3)
(3)
with Γ the incident fluence and K a pre-factor depending on the metaparticle size n. K (and hence the roughness σ) increases with metaparticle size n. This means practically, that the speed-up of simulations has to be performed carefully and too large metaparticle sizes can result in artificial roughness values. It should be noted that for simulations with individual incident particles the roughening effect is relatively small and even at the highest investigated fluences the roughness is below 3 Å: This is about the atomic distance, and such roughnesses still can be considered as smooth. Larger cluster ions can induce a considerably higher roughness.
Figure 6. Variance of the surface roughness as a function of incident fluence for different metaparticle (MP) sizes.
3.3. Rough surfaces
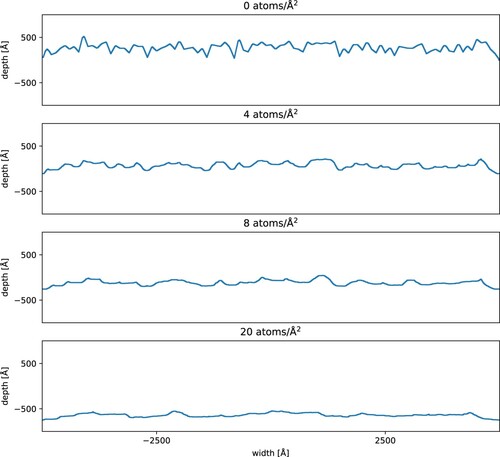
As shown in Section 3.2, smooth surfaces get rougher by sputtering (although the effect is relatively small). What happens to a rough surface, when the initial roughness is higher than the roughening effect by sputtering? One example is shown in Figure . The initially rough surface gets visibly smoother with increasing fluence. Larger ridges are relatively stable at low fluences, so that larger structures remain while smaller structures are smoothed out. At medium fluences the general shape of the starting surface still can be recognised, while small- and medium-sized structures are already smoothed out. At high fluences the structure of the initial surface finally disappears. For speeding up the calculation a metaparticle size of 50 was selected for Figure . According to Figure even at the highest fluences, the variance of the induced roughness is about 100 Å, i.e. the mean induced roughness is about 10 Å: This is still below the size of the discretization, i.e. the additional roughness due to the larger metaparticle size is not visible.
Figure 7. Behaviour of an initially rough surface under bombardment. 5 keV Ar on Cu at normal incidence, metaparticle size 50. The standard deviation of the surface is 100 Å, the initial number of hills and valleys is 100, while the discretizations in x and y directions are 20 Å.
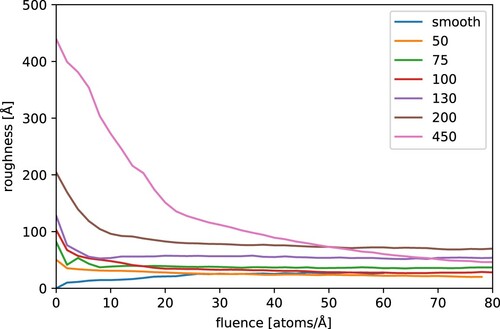
This smoothing effect can be quantified by determining the surface roughness, as shown in Figure . The initial roughness decreases first quickly and then more slowly with increasing fluence, until it remains constant. The residual roughness is, however, larger than the sputtering-induced roughness of a smooth surface (see Figure and the blue line in Figure ) and is larger for initially rougher surfaces, i.e. a small trace of the initial roughness survives even at the highest investigated fluences.
Figure 8. Evolution of the surface roughness with incident fluence for different starting roughnesses. Each line shows the evolution of the standard deviation of the rough surface under sputtering. The legend indicates the starting roughness.
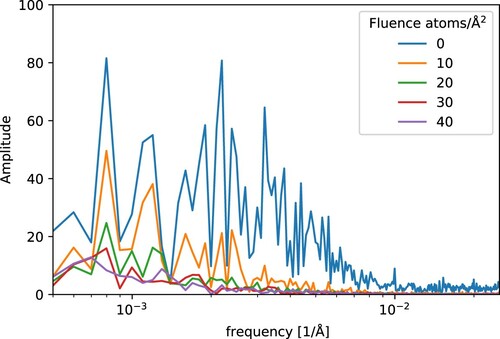
A deeper insight into the smoothing process by sputtering can be obtained from the Fourier transform of the rough surfaces [Citation39–42] at different fluences. Figure shows the Fourier spectrum of a surface with an initial roughness Å. The surface has a width of 10,000 Å and a sampling step of q = 20 Å resulting in 501 data points. The Nyquist Frequency is given by
(4)
(4)
resulting in
1/Å as the limiting frequency. Each spectrum has a peak at f = 0, which is equal to the mean of the data for that fluence and is of no specific interest. The initial rough surface is characterised by frequencies up to the Nyquist frequency. For increasing incident fluences, the higher frequencies vanish and only lower frequencies remain in the frequency spectrum. This is equivalent to a low-pass filtering of the frequency spectrum of the rough surface with decreasing cut-off frequency as function of increasing fluence. The sputtering does not produce preferred frequencies, as can be seen in Figure where the same spectrum is shown on a logarithmic scale for better visibility in the zones of critical interest.
Figure 9. Frequency spectra of rough surfaces for different incident fluences. The initial roughness was 250 Å.
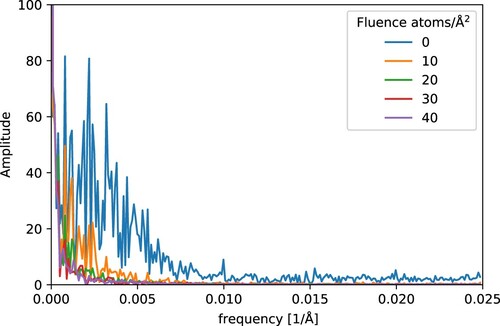
Figure 10. Same as Figure , but with a logarithmic frequency scale.
4. Conclusions
The increase in computing power (especially in parallel computing power) during the last decade allows more accurate and detailed simulations of the evolution of surfaces by sputtering. In the past, the evolution of surfaces was typically calculated using the Sigmund [Citation14] or Bradley-Harper [Citation16] model (or one of its extensions), which are continuity models neglecting the atomic structure of solids. SDTrimSP-2D is a 2-dimensional Monte-Carlo code in binary collision approximation allowing calculating trajectories of individual incident ions, recoils and sputtered atoms and the calculation of the evolution of surface structures until rather large fluences within still feasible computing times. The simulation of 3-dimensional structures is possible with SDTrimSP-3D, but the computing times are typically still too long for regular use.
The evolution of a triangular ridge was simulated for 5 keV argon ions incident on copper at normal incidence. At smaller fluences, the Sigmund Model is proven to be valid, and the prediction for the evolution of the shape of a ridge with increasing fluence from [Citation14] is basically correct. The ratio height/width of the triangular ridge stays remarkably stable (i.e. the basic shape of the ridge remains conserved) until a critical fluence, which depends on the size of the ridge. However, at larger fluences and once the surface got eroded by approximately the height of the ridge, the ridge begins to collapse and finally disappears. Smaller ridges disappear already at lower fluences than larger ridges.
The roughening of initially smooth surfaces was calculated for 5 keV argon ions incident on copper at normal incidence. The induced roughness of the surface increases with the square root of the incident fluence. The size of the metaparticles used in the calculation has an impact on the results of the simulation, with larger metaparticles resulting in surfaces with larger roughness. Larger metaparticles can be used to speed up the simulation, but their size has to be chosen with care. Similarly, larger clusters result in a rougher surfaces. However, this roughening effect is relatively small and reaches surface roughnesses of only about 3 Å for single particle impact at a fluence of 30 atoms/Å. In reality, this effect will be even smaller due to surface diffusion, which was neglected in our simulations.
Initially, rough surfaces get smoother with increasing fluences for 5 keV argon ions incident on copper at normal incidence. The smoothing process follows a characteristic pattern with smaller-scale roughness disappearing first and larger-scale roughness remaining stable until higher fluences. This is due to the higher stability of larger ridges compared to smaller ridges. At sufficiently high fluences, all investigated surfaces converge to a constant roughness where the shape of the surfaces still evolves, but the roughness remains constant. The final roughness depends on the roughness of the initial surface and is generally higher than the evolved roughness of an initially smooth surface. A Fourier analysis of the developed rough surfaces shows that higher frequencies vanish already at lower fluences, while lower frequencies are more stable and disappear only at higher fluences. The evolution of rough surfaces by sputtering is therefore equivalent to a low-pass filtering of the frequency spectrum of the roughness with decreasing cut-off frequency with increasing fluence. This is a fundamental property of the sputtering process.
The 1-dimensional BCA-code SDTrimSP has already been coupled with a diffusion model for solid-state diffusion and applied to the tungsten-iron system at elevated temperatures [Citation43]. The coupling of SDTrimSP-2D or SDTrimSP-3D with a surface diffusion model would allow the simulation of pattern formation on surfaces with unreached precision and detail based on an atomistic model. This is subject of future work.
Disclosure statement
No potential conflict of interest was reported by the author(s).
Additional information
Notes on contributors
M. Wagner
M. Wagner, is a graduate student at the Technische Universität München, Garching, Germany.
M. Mayer
M. Mayer, is a senior scientist at the Max-Planck-Institut für Plasmaphysik, Garching, Germany. He published widely about plasma-surface interactions in fusion devices, ion beam analyis methods, and computer simulations of ion-solid interactions.
U. von Toussaint
U. von Toussaint, is an Assistant Professor at the Graz University of Technology, Graz, Austria and Group Leader at the Max-Planck-Institut für Plasmaphysik, Garching, Germany. He published widely about plasma-surface interactions in fusion devices and computer simulations of ion-solid interactions. He is editor of the book “Bayesian Probability Theory: Applications in the Physical Sciences”.
A. Mutzke
A. Mutzke, is a senior scientist at the Max-Planck-Institut für Plasmaphysik, Greifswald, Germany. He published about computer simulations of ion-solid interactions and is maintainer of the SDTrimSP code line.
References
- Behrisch, R., Ed. Sputtering by Particle Bombardment I; Topics in Applied Physics 47; Springer: Berlin, Heidelberg, 1981.
- Behrisch, R., Ed. Sputtering by Particle Bombardment II; Topics in Applied Physics 52; Springer: Berlin, Heidelberg, 1983.
- Behrisch, R.; Wittmaack, K., Eds. Sputtering by Particle Bombardment III; Topics in Applied Physics 64; Springer: Berlin, Heidelberg, 1991.
- Behrisch, R.; Eckstein, W., Eds. Sputtering by Particle Bombardment: Experiments and Computer Calculations from Threshold to MeV Energies; Topics in Applied Physics 110; Springer: Berlin, Heidelberg, 2007.
- Hapke, B. J. Geophys. Res. Planets 2001, 106, 10039.
- Kelly, P.; Arnell, R. Vacuum 2000, 56, 159.
- Li, J.; Stein, D.; McMullan, C.; Branton, D.; Aziz, M.; Golovchenko, J. Nature 2001, 412, 166.
- Federici, G.; Skinner, C.; Brooks, J.; Coad, J.; Grisolia, C.; Haasz, A.; Hassanein, A.; Philipps, V.; Pitcher, C.; Roth, J.; Wampler, W.R.; Whyte, D.G.; Nucl. Fusion 2001, 41, 1967.
- Küstner, M.; Eckstein, W.; Dose, V.; Roth, J. Nucl. Instrum. Methods Phys. Res., Sect. B 1998, 145, 320.
- Küstner, M.; Eckstein, W.; Hechtl, E.; Roth, J. J. Nucl. Mater. 1999, 265, 22.
- von Toussaint, U.; Mutzke, A.; Manhard, A. Phys. Scripta 2017, T170, 014056.
- Arredondo, R.; Oberkofler, M.; Schwarz-Selinger, T.; von Toussaint, U.; Burwitz, V.; Mutzke, A.; Vassallo, E.; Pedroni, M. Nucl. Mater. Energy 2019, 18, 72.
- Sigmund, P. Phys. Rev. 1969, 184 (2), 383.
- Sigmund, P. J. Mater. Sci. 1973, 8, 1545.
- Mark Bradley, R.; Hofsäss, H. J. Appl. Phys. 2014, 116 (23), 234304.
- Bradley, R.; Harper, J. J. Vac. Sci. Technol. A 1988, 6 (4), 2390.
- Valbusa, U.; Boragno, C.; Buatier de Mongeot, F. J. Phys.: Condens. Matter 2002, 14 (35), 8153.
- Chan, W.; Chason, E. J. Appl. Phys. 2007, 101, 121301.
- Norris, S.A.; Aziz, M.J. Appl. Phys. Rev. 2019, 6 (1), 011311.
- Hobler, G.; Bradley, R.; Urbassek, H. Phys. Rev. B 2016, 93, 205443.
- Eckstein, W. Computer Simulation of Ion-Solid Interactions; Springer Series in Materials Science 10; Springer: Berlin, Heidelberg, 1991.
- Eckstein, W.; Urbassek, H. In Sputtering by Particle Bombardment: Experiments and Computer Calculations from Threshold to MeV Energies; Behrisch, R.; Eckstein, W., Eds.; Topics in Applied Physics 110; Springer: Berlin, Heidelberg, 2007.
- Biersack, J.; Eckstein, W. Appl. Phys. A 1984, 34, 73.
- Mutzke, A.; Schneider, R.; Eckstein, W.; Dohmen, R. SDTrimSP Version 5.00; Technical Report IPP 12/8; Max-Planck-Institut für Plasmaphysik: Garching, Germany, 2011.
- Mutzke, A.; Schneider, R.; Eckstein, W.; Dohmen, R.; Schmid, K.; von Toussaint, U.; Bandelow, G. SDTrimSP Version 6.00; Technical Report IPP 2019-02; Max-Planck-Institut für Plasmaphysik: Garching, Germany, 2019.
- Hofsäss, H.; Zhang, K.; Mutzke, A. Appl. Surf. Sci. 2014, 310, 134.
- Möller, W.; Eckstein, W.; Biersack, J. Comput. Phys. Comm. 1988, 51, 355.
- Mutzke, A.; Schneider, R.; Bandelow, G. SDTrimSP-2D: Simulation of Particles Bombarding on a Two Dimensional Target Version 2.0; Technical Report IPP 12/11; Max-Planck-Institut für Plasmaphysik: Garching, Germany, 2013.
- von Toussaint, U.; Mutzke, A. Nucl. Mater. Energy 2017, 12, 318.
- Mutzke, A.; Bizyukov, I.; Schneider, R.; Davis, J. Nucl. Instrum. Methods Phys. Res. B 2011, 269, 582.
- Schneider, R.; Mutzke, A.; Bizyukov, I.; Davis, J. J. Nucl. Mater. 2011, 415, S200.
- Arredondo, R. SIESTA: A New Ion Source Setup and its Application to Erosion Studies on First-Wall Materials for Fusion Reactors; Technical Report IPP 2019-10; Max-Planck-Institut für Plasmaphysik: Garching, Germany, 2019.
- Wilson, W.D.; Haggmark, L.G.; Biersack, J.P. Phys. Rev. B 1977, 15 (5), 2458.
- Lindhard, J.; Scharff, M.; Schøtt, H. Mat. Fys. Medd. Dan. Vid. Selsk. 1963, 33 (14), 3.
- Madelung, O., Ed. Landolt-Börnstein: New Series, vol. IV/5b; Springer: Berlin, Heidelberg, 1992.
- Binder, H.H. Lexikon der chemischen Elemente, Hirzel: Stuttgart, 1999.
- Lide, D.R. CRC Handbook of Chemistry and Physics, 78th ed.; CRC Press, 1997.
- D'Ans, J.; Lax, E.; Blachnik R., Ed.; Taschenbuch für Chemiker und Physiker, vol. 3; Springer: Berlin, Heidelberg, 1998.
- Santos, S.D. Time-frequency analysis for surface roughness characterization using backscatter ultrasound. In AIP Conference Proceedings; AIP, 29 July–3 Aug 2001; pp 752–758.
- Brock, M. Techn. Rev. 1983 (3). https://www.bksv.com/media/doc/bv0011.pdf.
- Dong, W.P.; Stout, K.J. Proc. Inst. Mech. Eng. B: J. Eng. Manuf. 1995, 209 (5), 381–391.
- Pfeifer, P. Appl. Surf. Sci. 1984, 18 (1-2), 146–164.
- von Toussaint, U.; Mutzke, A.; Sugiyama, K.; Schwarz-Selinger, T. Phys. Scripta 2016, T167, 014023.