
 ?Mathematical formulae have been encoded as MathML and are displayed in this HTML version using MathJax in order to improve their display. Uncheck the box to turn MathJax off. This feature requires Javascript. Click on a formula to zoom.
Abstract
The adsorption and reactions of water with surfaces is of immense importance in catalysis and corrosion. Charge transfer of ion scattering is sensitive to changes of work function and electronic structure caused by adsorption of water on a surface. In this work, as the model systems of metals and semiconductors the water adsorbed copper and silicon surfaces have been chosen and the research progress of charge transfer of the negative and positive ion scattering in our group were reviewed.
1. Introduction
Water is arguably the most important inorganic molecular species in the modern world, since its vital function for all know forms of life, and its importance as the so-called “universal solvent” in industrial processes. The academic interest of water in the context of current fundamental surface science research comes from its propensity to form hydrogen bonds (Citation1). Moreover, water is also potentially significant for future efforts towards a hydrogen economy, such as the water–gas-shift reaction of hydrogen production (Citation2).
The interaction of water with surfaces is sometimes neglected, because water is always considered simply part of the background environment at room temperature and not playing any explicit role in the process. In fact, the adsorption and reactions of water with surfaces is of immense importance in catalysis, electrolysis, corrosion, fuel cells and biotechnologies (Citation1–4).
Charge transfer on solid surfaces plays a crucial role not only because of its fundamental physical interest, but also for practical applications, i.e., secondary ion mass spectroscopy and low energy ion scattering (LEIS) (Citation5, Citation6). Adsorption of water on a surface may lead to changes of work function and electronic structure which charge transfer of ion scattering is one of the methods that is sensitive to. It is helpful to understand the adsorption effects on charge transfer for studies on surface catalysis, electrolysis, and corrosion processes.
Study of charge transfer in ion scattering is one of the methods that is sensitive to these changes. To this end we have performed a series of studies of charge transfer in Na+, C-, O-, F- and Cl- scattering on water covered Cu and Si surfaces which are briefly reviewed in this progress report, along with some new results. The charge transfer on water covered Cu and Si surfaces presents the characteristics of metals. The positive and negative ion fractions depend on the type of projectiles and surfaces. The negative ion fraction presents a bell shape as a function of exit angle for a scattering angle of 38°, which cannot be understood using the rate equation based on the resonant charge transfer model. In particular, two different types of parallel velocity effects have been carefully distinguished for the incident velocity dependent negative ion fraction at a scattering angle of 8°.
2. Experimental approach
The water adsorption measurement has been performed in two ways. One way is the direct adsorption of water vapor from the background gases with the typical working pressure of about 3 × 10⁻⁷ Pa in the big ultrahigh-vacuum (UHV) chamber (Citation7). The other way to do the water adsorption measurement is in a load-lock chamber with the base pressure of about 5 × 10⁻⁸ Pa, which is shown in Figure (Citation8). The small load-lock chamber is coupled with the big UHV chamber, and the clean surface is placed on the magnetically coupled transporter and can be transferred between these two chambers. The surface faces a stainless-steel tube with a diameter of 4 mm. The distance between the surface and the tube is about 70 mm. The distilled water was in the glass tube and purified by freeze-pump-thaw cycles before using and dosed through a leak valve in the load-lock chamber. The clean surface is exposed to water vapor at room temperature in the load-lock chamber and subsequently transferred to the big chamber for charge transfer measurements.
Figure 1. Schematic diagram of the experimental setup for water adsorption in the preparation chamber and electron transfer experiment in the big chamber.
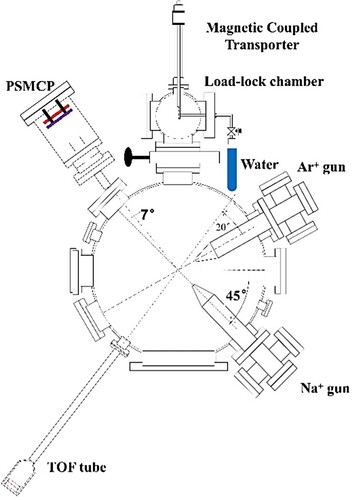
The charge transfer experiments have been done using two types of ion sources. 8.5–22.5 keV negative ion beams were produced from a cesium sputter ion source of the 2 × 1.7 MV tandem accelerator at Lanzhou University (Citation7). The beam was collimated by two slits 52.7 cm apart and steered by a pair of electrostatic plates placed between the two slits to pass through a third collimator (2 × 2 mm2) 30.5 cm downstream of the second slit before entering the big chamber. For positive ion scattering, the Na+ ions with energies from about 0.2 keV to 5 keV were extracted from a solid source via surface ionization and was collimated by several slits with aperture size of 1 × 3 mm2 (Citation8). The Na ion gun is assembled on the flange interface of the big chamber, as shown in Figure . The distance between the aperture of the gun and the sample is about 8 cm.
The sample was mounted onto a precision manipulator within the big chamber, with a typical working pressure of 3 × 10⁻⁷ Pa for negative ion scattering, while for Na+ ion scattering, the base pressure was about 2.3 × 10⁻⁸ Pa. For negative ion scattering, the scattering angle was fixed at 38° (or 8°), and the incident angle α measured with respect to the surface plane was varied from 5° to 29°(or 1–7°). The exit angle β = 38°-α (or 8°-α). But for Na+ ion scattering, the scattering configuration changed, with 3.5° incident and exit angle, and the scattering angle was fixed at 7°. Then the scattered particles pass through a parallel plate electrostatic deflector and were recorded by a one-dimensional position sensitive micro-channel plate (PSMCP) detector. The data were collected by a multi-parameter acquisition system (MPA-3). The fraction of negative ions (neutrals/positive ions) is defined as Φ-/0/+ = N(F-/0/+)/N(total), where N(total) is the total flux of scattered particles, neglecting the recoil particles.
We utilized 3 keV Ar+ ions grazing incidence sputtering and thermal annealing for several weeks to clean the sample. Surface cleanliness was ascertained by performing the time of flight scattering and recoiling spectroscopy (TOF-SARS) (Citation9–11).
3. Results and discussion
3.1. Characterization of water on Surfaces
The TOF-SARS technology has been used to study water adsorption on surfaces at room temperature and desorption with elevated temperatures. As a reference, we also performed the TOF spectra for copper exposed to 99.999% O2 where the position and the shape of the recoil O peak are the same as one of the peaks of the surface exposed to the background gases in the UHV chamber (Citation9). We did the TOF spectra for copper exposed to the pure water which is similar to that exposed to the background gases in the UHV chamber.
When the Cu(110) is exposed to the residual H2O vapor in the chamber at room temperature, the spectra are acquired as a function of exposure time (Citation9). In Figure , the relative intensity of hydrogen (oxygen) is defined as the ratio of the recoil hydrogen (oxygen) intensity to the sum of the recoil hydrogen and oxygen intensities and the scattered argon intensity (surface peak) from the TOF spectra (Citation7). The initial increase is very rapid up to about t = 250 min corresponding to about 30 L, and then the intensities reach the plateau region. The relative intensity can be well fitted by the first order kinetics equation based on Langmuir adsorption model of with k = 0.0045/min, where θ is the surface coverage, θe is the equilibrium surface coverage value, k is a constant.
Figure 2. (a) Relative intensities of hydrogen and oxygen and the sum of them as a function of exposure time for 3-keV Ar+ scattering from a Cu(110) surface (Citation9). The solid blue line is the fitting result from the formula; (b) Relative intensities of hydrogen and oxygen as a function of temperature. The solid blue line is the fitting result from the formula.
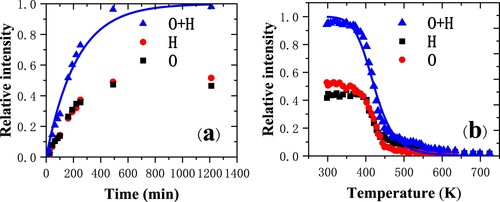
The TOF spectra for heating to different temperatures are acquired after water adsorption for several hours (Citation9). The measurements are performed during the temperature ramp which is applied at 10 K/min. As the temperature rises, the relative intensity of the H and O peaks are progressively attenuated. Traces of O were still observed in the TOF spectra for the temperatures above 673 K. It is a clear evidence for the partial oxidation of the surface. The relative intensity can be well fitted by the formula of with α = 1,
, and (Ed–Ec) = 1.316 kcal · mol−1 = 0.55 eV. This value compares well with theoretical results finding a dissociation barrier of 0.57 eV (Citation12). α is the probability of trapping into the precursor state, vd and vc are the pre-exponential factors for desorption and adsorption from the precursor state respectively, and Ed and Ec are the corresponding activation energies.
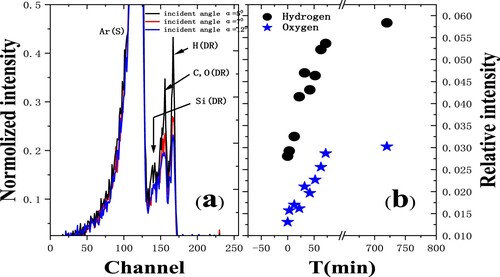
We also find that the Si surface is immediately covered with water vapor after the sputtering and saturated over night (Citation7). The recoiling hydrogen and oxygen particles are well observed in the TOF spectra in Figure , as well as the measured relative hydrogen and oxygen intensities. It is mainly attributed to the H2O chemisorption from the background gases in the chamber with a typical pressure of 3 × 10⁻⁷ Pa. Water molecules dissociate upon adsorption at Si surfaces at room temperature and form a silicon hydride and hydroxyl group, while water molecules completely dissociate at the copper surface to form OH and then physically adsorb a number of water molecules.
Figure 3. Time-of-flight (TOF) spectra of 3 keV Ar+ scattering from a Si(111) surface with several incident angles (Citation7). Ar(S) represents scattered Ar, H(DR), C or O(DR) and Si(DR) represent the recoil H, C or O, and Si respectively; (b) The relative intensities of hydrogen and oxygen as a function of exposure time.
3.2. Charge transfer on Cu
For negative fluorine and chlorine ions in specular scattering on dissociated water covered Cu(110) with 7° scattering angle (Citation13), in Figure (a), the positive ion fraction can be seen to slightly increase with exit velocity. The Cl+ ion fraction is much larger than F+. It indicates that it is easier to ionize chlorine atoms than fluorine since the first ionization energy of a chlorine atom (12.97 eV) is smaller than that of fluorine (17.4 eV). This is similar to what happens on metallic surfaces where scattered Ne+, Ar+ and O+ fractions increase monotonically with primary kinetic energy in the range of several keV energies (Citation14, Citation15). However, it is substantially different from that on HOPG in the previous work (Citation16), where the positive ion fraction decreases with increasing incident velocity in the similar grazing scattering configuration.
Figure 4. (a) Positive-ion fraction as a function of 1/ measured for F¯ and Cl¯ ions in grazing scattering on dissociated H2O covered Cu(110) (Citation13). The black dot line and red solid line give the best fitting. (b) Negative-ion fraction as a function of incident velocity measured for F¯ and Cl¯ ions. The black dashed and red solid lines are the calculated results for fluorine and chlorine ions, respectively. The scattering angle is fixed at 8°, and the incident and exit angles are 4°.
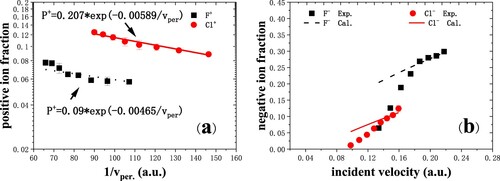
The positive-ion fractions are well described by where
is the final survival probability,
represents the initial positive-ion probability at z0, and the exponential term represents the survival of positive ions on the outgoing path above the surface. The distance z dependent electron transition rate is given by
. The data are well fitted by
and
(∼1.3 × 10⁴ m/s) for chlorine ions, and
and
(∼1.0 × 10⁴ m/s) for fluorine ions, respectively. It indicates that the resonant and/or Auger neutralization also play an important role above the dissociated water covered Cu(110) surface. It is similar to that on the jellium metallic surface.
Figure (b) shows negative-ion fractions measured for F¯ and Cl¯ ions in specular scattering on dissociated H2O covered Cu(110) with incident energies from 8.5 to 22.5 keV. The negative-ion fraction increases with the increase of incident velocity. Due to the large electron affinity of 3.62 eV for Cl¯, the threshold velocity for the formation of Cl¯ is lower than that for F¯ (3.4 eV). In spite of that, Cl¯ fractions is smaller than F¯ fractions when the velocity is larger than 0.15 a.u.. It is more efficient to produce high F¯ yields at higher velocities since F atoms with large first ionization energy are harder to be ionized than Cl atoms. The present results are similar to the previous studies where negative-ion fractions also increase with increasing incident velocity for C¯, O¯, F¯ ions scattering on water covered Si surfaces at a scattering angle of 38° (Citation9, Citation10, Citation17) and for F¯ ions scattering on HOPG (Citation18).
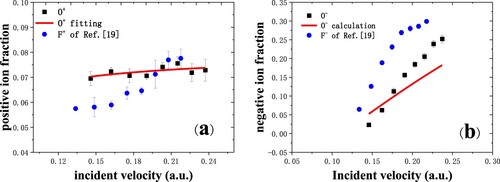
In Figure (a) O+ fraction is slightly larger than that of F+ for a small incident velocity (Citation19), which can be understood in terms of the ionization energy since the first ionization energy of oxygen atom (13.62 eV) is smaller than that of fluorine atom (17.4 eV). However, the F+ fraction is larger than O+ fraction when the incident velocity is larger than 0.2 a.u.. The O+ fractions in Figure (a) are well fitted by and
(∼2.796 × 10³ m/s) In Figure (b), the O¯ fraction is smaller than that of F¯, which can be understood in terms of the affinity level since the electron affinity of oxygen (1.46 eV) is smaller than that of fluorine (3.4 eV). Besides, the increase rate of O¯ is comparable to that of F¯, which is similar to what happens on Si(111) surface (Citation17).
Figure 5. (a) Positive ion fraction for oxygen negative ions scattering in grazing incidence on a dissociated water-covered Cu(110) surface (black squares) (Citation19). The red solid line is the fitting result. The data of F+ fraction are cited from Ref. (Citation13) (blue circles). (b) The O¯ fraction as a function of incident velocity for specular scattering (black squares). The red solid line is the calculated result. Blue circles are the experimental data of F¯ (Citation13).
For fast grazing collisions, the parallel velocity effect should be taken into account (Citation20), which can be clearly visualized by the concept of the “shifted Fermi sphere” in the momentum space as shown in Figure (a) (Citation13). The affinity level of the projectile (F¯ 3.4 eV, Cl¯ 3.6 eV) is shifted below the Fermi level of the clean Cu(110) surface (work function 4.49 eV) as the ion surface distance decreases (crossing distance of about 6.2 a.u. for F¯ and 7.6 a.u. for Cl¯). In this case, efficient formation of negative ions occurs via resonant capture. With the increase of the parallel velocity v, the overlap of the surface of the resonance sphere with the Fermi sphere reduces and results in the decrease of negative ions, which is called as the first parallel velocity effect. However, this picture cannot explain the opposed velocity dependence of our results presented in the velocity range of 0.1–0.22 a.u..
Figure 6. Schematic representation of the shifted Fermi sphere model. (a) ka < kF. (b) ka > kF. In the momentum space, the atomic resonance is represented as a shell of radius ka with some thickness, the Fermi sphere of radius kF is shifted by the parallel velocity v. Electron transfer occurs when the resonance shell overlaps with the shifted Fermi sphere (Citation13).
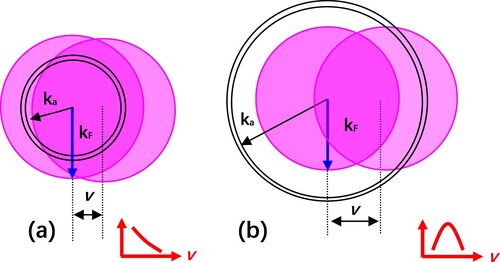
In fact, the efficient production of positive ions leads to the reduction of the negative-ion formation at short distances, which indicates the competition between negative and positive ion production mediated by the perpendicular energy. The second possible reason is related to the kinematic effect. First, in our case the water adsorbed Cu(110) surface consists of OH groups mixed with a small amount of O. The work function of dissociated water covered Cu(110) is larger than that of clean Cu(110) (4.49 eV). The diameter of the Fermi sphere of dissociated H2O covered Cu(110) decreases with the increase of surface work function. Second, the positive-ion production reduces efficiently matrix elements of negative-ion formation at short distances, although the surface of the resonance shell lies possibly within the Fermi sphere at incident velocities of 0.1–0.2 a.u. In this respect, the effective overlap between the resonance shell and the Fermi sphere is only enhanced by the parallel incident velocity, which meets the second parallel velocity effect as shown in Figure (b) (Citation13). Therefore we observe the increase of negative ion fraction with increasing incident velocity, as shown in Figure (b) and Figure (b).
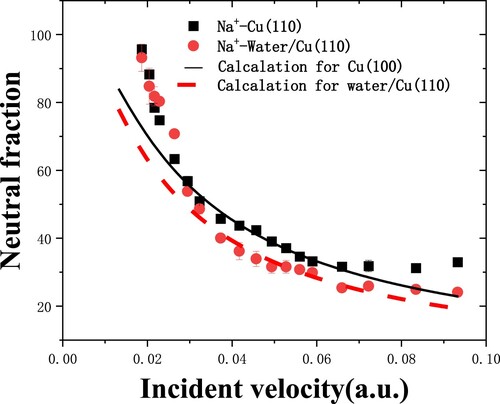
The work function of dissociated water covered Cu(110) is larger than that of clean Cu(110) (4.49 eV), which is also observed in Figure for Na+ ion scattering (Citation8). For H2O/Cu(110), the neutral fraction is similar to that of clean Cu(110) at the low velocities, but smaller at high velocities due to the higher work function. The calculation is in agreement with the experiment, but underestimates the experimental data for incident energy larger than 3 keV, which is an open question. The parallel velocity effect and the downshift of atomic level close to the surface have been considered in the model, but the good agreement between experiment and calculation has never been reached.
Figure 7. The Na+ neutral fractions as a function of incident velocity from clean Cu(110) and water covered Cu(110) surfaces are measured in grazing specular scattering with 7° scattering angle (Citation8). Experimental data: (▪)Cu(110) (Citation21), ()H2O/Cu(110). The black and red dashed lines are the calculated results for Cu(110) and H2O/Cu(110), respectively.
We have performed the calculation using the modified rate equation (Citation9, Citation10, Citation17). The six electrons on the outer p shell of negative chlorine and fluorine ions are equivalently involved in electron transfer processes. Based on this assumption, the modified rate equations involving the contribution of positive ions are,
(1)
(1) and,
(2)
(2) where fk + Q is the Doppler-Fermi-Dirac distribution function (Citation20).
and
correspond to the total neutral population in the m = 0 and m = ±1 states, respectively. The state m = 0 is oriented towards the surface and m = ±1 are oriented parallel to the surface. The degeneracies
,
, and the widths
in our calculations are all cited from the literature (Citation22, Citation23), i.e.,
and
for F¯, and
and
for Cl¯, respectively, expect for the slightly adjusted
= 0.8 for F¯ and 0.77 for Cl¯. Note that, z is measured from the image plane. The first terms on the right side in Equations (1) and (2) correspond to negative-ion formation, and the second and last terms correspond to the production of neutrals from negative ions and positive ions, respectively. Thus we obtain the final negative-ion fraction [
].
The calculated results are also displayed in Figure (b) and Figure (b) to compare with the experimental data. The calculated results generally describe the data, and show the similar velocity dependence. In order to include the influence of positive ions at short distances, it is simply assumed that the transition rate for negative-ion formation is zero when the distance is less than zth. It means that the initial population of negative ions is zero. This assumption is basically supported by the previous study in which the better agreement between experiment and theory is obtained for the calculations done with the system being initially a neutral H atom rather than H¯ (Citation24).
3.3. Charge transfer on Si
Lightly doped (∼1Ω cm) and medium-doped (∼0.01Ω cm) p-type Si(100) wafers were exposed to the H2O molecules from the background gases in the chamber before doing the electron transfer measurements using keV-energy negative C-, O- and F- ions. Water molecules dissociate upon adsorption at room temperature, and the saturation of dangling-bond surface states for H and OH needs half a monolayer of water (Citation25, Citation26). This kind of the passivated surface would be well suited to delineate the band gap effect for Si.
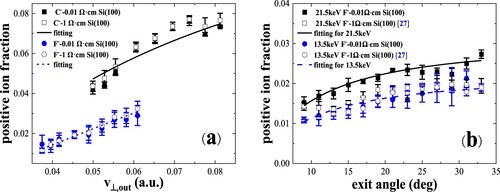
We measured the exit velocity and exit angle dependences of fractions in collisions of C–, and F– ions with a water covered lightly doped Si(100) surface (Citation27). In Figure (a), for fluorine, the positive-ion fraction Φ+ is much smaller than Φ-, while for carbon, the fraction Φ+ is very close to Φ- and larger than that of fluorine (Citation27). The fraction Φ+ increases with the increasing of perpendicular exit velocity for carbon and fluorine ions, respectively. In Figure (b) the Φ+ slightly increases with exit angle (Citation27), which is consistent with the results of 1 - 4-keV fluorine ions scattering on Mg (Citation28) and the results of 4-keV oxygen ions scattering on Si(111) (Citation29).
Figure 8. Positive-ion fractions as a function of perpendicular component of exit velocity, measured for 8.5–22.5 keV C- and F- in specular scattering on Si(100) surfaces with two different doping concentrations. The blue dashed and black solid lines represent the fitting results from the measured fractions for F- and C-, respectively (Citation27).
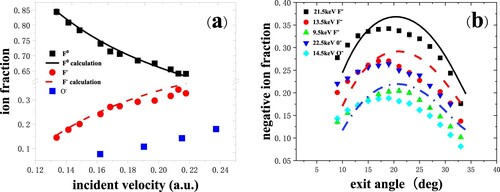
In Figure (a), the neutral fraction Φ0 is as high as about 85% and decreases monotonically with incident velocity (Citation10). Conversely, the negative-ion fraction Φ- increases monotonically. Negative-ion fractions as a function of incident angle for 9.5, 13.5, 21.5-keV energies are shown in Figure (b) (Citation10). We can find a so-called bell shape of negative-ion fractions. The maximum negative-ion fraction and minimum neutral fraction both occur at about 19°, which corresponds to the specular scattering direction (α = β = 19°).
Figure 9. (a) Neutral and negative-ion fractions as a function of incident velocity are measured for 8.5–22.5 keV O-, F- in specular scattering on Si(100). The black solid and red dash lines are the calculated results from the coupled rate equations (Citation10). (b) Negative-ion fractions as a function of exit angle with respect to the surface plane are measured for 9.5 keV, 13.5 keV and 21.5 keV F-and 22.5 keV, 14.5 keV O- scattering on Si(100). The black solid, red dash and blue dot lines are the calculated results.
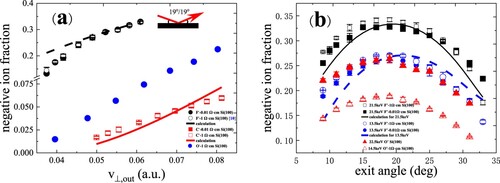
In Figure , the negative ion fractions are the same for Si(100) surfaces with two different doping concentrations (∼1 Ω cm and 0.01 Ω cm) for incident velocity and exit angle dependences (Citation27). The positive ion fractions are nearly the same for Si(100) surfaces with two different doping concentrations within the experimental errors as shown in Figure . The negative ion fraction depends on the electron affinity of the projectile.
Figure 10. (a) Negative-ion fractions as a function of perpendicular component of exit velocity, measured for 8.5–22.5 keV C-, O- and F- in specular scattering on Si(100) surfaces with two different doping concentrations. Inset shows the scattering geometry. The red solid and black dashed lines represent the calculation results for C- and F-, respectively (Citation27). (b) Negative-ion fractions as a function of exit angle with respect to the surface plane, measured for 21.5, 13.5 keV F- and 22.5, 14.5 keV O- scattering on Si(100) surfaces with two different doping concentrations. The black solid and blue dot-dashed lines are the calculated results for F- including the contribution of negative ions (Citation27).
The band structure of Si will be changed after doping. For the p-type doped Si(100) samples, the dopants can accept additional electrons from surrounding atoms, and leave positively charged holes as charge carriers in the valence band. An important aspect of high doping is that, high impurity concentration causes a reduction of the bandgap. The denoted ΔEG can be calculated by the following formula (Citation30),
(3)
(3) for nondegenerate majority carriers, where n is the impurity concentration in cm−3, ϵ and q are the dielectric constant and electron charge, respectively. The formula is the same for n-type and p-type Si at room temperature (300 K). In our case, for the slightly doped sample (∼1 Ω cm), ΔEG ≤ 0.022 eV which is less than 2% of the original bandgap (Citation31). While for the medium-doped sample (∼0.01 Ω cm), n is about 9 × 1018 cm−3, ΔEG = 0.0675 eV which is about 6% of the intrinsic band gap value (about 1.1 eV). However, we have not found the difference in ion fractions within the experimental errors for two kinds of projectiles with relatively high incident energies. It is concluded that the band gap effect (Citation32, Citation33) on electron transfer is not observed. A possible reason could be that the affinity levels of C−, O− and F− ions lie quite close to the Fermi level and are located towards the bottom of the band gap and easily interact with the valence band states. Another aspect of the explanation is the fast collision velocity (Citation32). Both of them decrease the blocking effect of the gap.
The data in Figure (a) are well described by and
(∼1.32 × 10⁵ m/s) for C+ ions, and
and
(∼1.96 × 10⁵ m/s) for F+ ions, respectively. The probability of 0.156 for C+ ions at z0 is larger than that for F+ ions. It indicates that it is easier to produce C+ ions because of the lower first ionization energy of carbon atoms (11.3 eV) as compared to fluorine atoms (17.42 eV). The positive-ion fraction depends exponentially upon (
). The larger the velocity, the higher the positive-ion fraction. For exit angle dependence of F+ in Figure (b) for a given incident energy, we get the best fitting results by
and
(∼0.4 × 10⁵ m/s) for 13.5 keV, and
and
(∼0.5 × 10⁵ m/s) for 21.5 keV. The production probability of 0.024 for 13.5 keV F+ ions at z0 is smaller than 0.032 for 21.5 keV F+ ions. It indicates that it is easier to produce F+ ions for high incident energies. The fitting values of the characteristic velocity
are different between the velocity and angle dependences, which indicates that z0 may be different for two cases. The large incident angles (small exit angles) correspond to penetrating into deeper layers of the surface where neutralization is enhanced, and also correspond to spending more time near the surface and undergoing efficient Auger and/or resonance neutralization.
Water molecules adsorbed on Si(111) in dissociation forms at room temperature, and the saturation of dangling-bond surface states for H and OH needs only 0.2 monolayer of water (Citation34). The water adsorbates removed the dangling-bond surface states. We measured the perpendicular exit velocity and exit angle dependences of fractions in collisions of C–, O– and F– ions with a water covered Si(111) surface (Citation17).
In Figure (a), the positive-ion fractions are measured for 6.5–22.5 keV C–, O– and F– in specular (19°/19°) scattering. For oxygen and fluorine, the positive-ion fraction Φ+ is much smaller than Φ-, while for carbon, the fraction Φ+ is very close to Φ- and larger than that of oxygen and fluorine, which is similar to that measured for C– and F– in specular scattering on a water covered Si(100) surface (Citation9). In Figure (b), the fraction Φ+ for oxygen and fluorine increases as a function of exit angle β, and this trend is consistent with the previous results of 1 - 4 keV oxygen ions scattering on Mg, Al, and Ag surfaces (Citation35), of 1 - 4 keV fluorine ions scattering on Mg (Citation28) and 4 keV oxygen ions scattering on Si(111) (Citation29), as well as the results of C– and F– in specular scattering on a water covered Si(100) surface (Citation9). The fraction Φ+ (maximum value of 2.55% and 1.98% for oxygen and fluorine) is much smaller than Φ–.
Figure 11. (a) Positive-ion fractions as a function of perpendicular exit velocity, measured for 6.5–22.5 keV C–, O– and F– in specular scattering on a water covered Si(111) surface. The black solid, red dashed and blue dash dotted curves are the fitting results (Citation17). (b) Positive-ion fractions as a function of exit angle with respect to the surface plane, measured for 22.5 keV O– and 21.5 keV F– scattering on a water covered Si(111) surface (Citation17). The black solid and blue dashed curves are the fitting results.
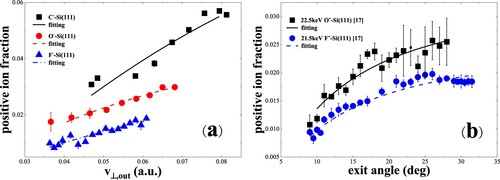
We also display the fitting positive-ion fractions in Figure (a), which are well described by and
(∼1.8 × 10⁵ m/s) for C+ ions,
and
(∼1.2 × 10⁵ m/s) for O+ ions, and
and
(∼1.5 × 10⁵ m/s) for F+ ions, respectively. The exit angle dependence of O+ and F+ fraction in Figure (b) can also be well described by
and
(∼0.8 × 10⁵ m/s) for O+ ions,
and
(∼0.07 × 10⁵ m/s) for F+ ions.
In Figure (a), for water covered Si(111) the negative-ion fraction Φ– increases monotonically with perpendicular exit velocity (Citation17), which is similar to that measured for C– and F– in specular scattering on a water covered Si(100) surface in our previous work (Citation9). The fraction Φ– for carbon (0.59–4.8%) is much smaller than that of oxygen (2.5–24%) and fluorine (5.3–27%).
Figure 12. (a) Negative-ion fractions as a function of perpendicular exit velocity, measured for 6.5–22.5 keV C–, O– and F– in specular scattering on a water covered Si(111) surface (Citation17). The black solid, red dashed and blue dash dotted curves are the calculated results including the contribution of positive ions. (b) Negative-ion fractions as a function of exit angle with respect to the surface plane, measured for 21.5 keV F– and 22.5 keV O- scattering on a water covered Si(111) surface (Citation17). The black solid, blue dashed curves are the calculated results including the contribution of positive ions.
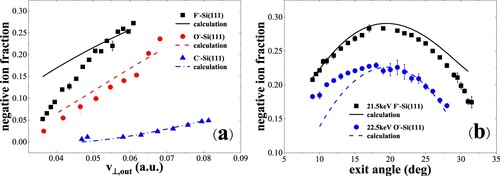
In Figure (b), as expected, we also find that the fraction Φ– presents a bell shape (Citation17) which is the same as that presented in our previous work (Citation9). Φ– first increases with increasing exit angle and decreases as exit angle increases. It is obvious that the minimum and maximum value of Φ- is around 19o, corresponding to specular scattering (19°/19°). A much low C– beam current prevents us to measure its angle dependence. The data of the angle dependence corresponding to 22.5 keV O– ions scattering on a water covered Si(111) are from Ref. (Citation7).
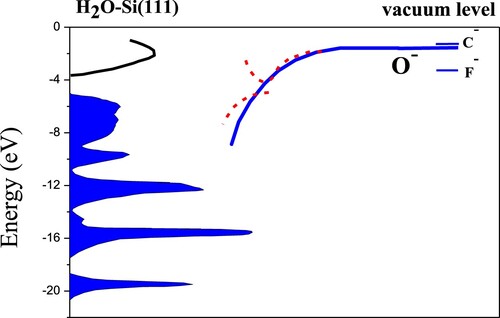
Here focusing on H2O adsorbed Si(111) as an example to understand well the formation of negative ions on Si surfaces. The energy band of H2O adsorbed Si(111) is shown in Figure (Citation17), as well as the energy position of C–, O– and F– affinity levels (located at −1.269 eV, −1.462 eV and −3.399 eV with respect to the vacuum level) (Citation38). the calculated local density of state (LDOS) as OH and H adsorbed together on the Si(111) surface displays five distinct features at −33.8, −18.5, −14.8, −12.1 and −9.9 eV with respect to the vacuum level (Citation36, Citation39). While the upper valance band region from −9 up to −5 eV corresponding to Si-self states is not affected by water adsorption (Citation36, Citation37), and the conduction-band states are emptied after water dissociation adsorption (Citation39). The localized dangling-bond surface states in the gap region can provide a non-resonant electron transfer channel (Citation29, Citation35), but they completely disappear due to water adsorbates. Compared with the clean Si(111) surface, the surface work function decreased after water adsorption (Citation40), and we take the value of about 4.48 eV in the calculation.
Figure 13. Schematic of the band structure of H2O-Si(111) (7 × 7) (Citation36, Citation37) as well as the energy positions of the C–, O– and F– affinity levels in front of the surface. As a representation, the solid line represents the image shift of the O– affinity level as the ion surface distance decreases. For adiabatically slow collisions, an avoided crossing structure of energy level appears as the ion-surface distance decreases due to the band gap effect (Citation33, Citation34). The first red dashed curve represents the higher lying resonance, and the second red dashed curve represents the lower lying resonance. However, for fast collisions, the effects of the narrow band gap disappear and the dominant charge transfer is nonadiabatic.
The band gap effect can be erased for C–, O– and F– collisions with a water covered Si(111) surface, which is similar to the case of Si(100) mentioned above. The affinity level of oxygen (−1.462 eV) is located between carbon (−1.269 eV) and fluorine (−3.399 eV). As the ion-surface distance decreases, the affinity level is downward shifted following the image charge variation. It is below the Fermi level at a critical value 2.1 a.u. (2.3, 6.3 a.u.) for C– (O–, F–). In our case, i.e., some tens of keV incident energies, the affinity level of negative ions lies quite close to the Fermi level and can easily arrive the bottom of the band gap to interact with the valence band states. The collision is so fast that the electron does not have enough time to probe the existence of the band gap. As a consequence, we can qualitatively explain the velocity dependence of the negative-ion fractions in Figure .
In addition, the calculated results using the Equations (1) and (2) have been plotted in Figure for comparison. It indicates that the incident velocity and initially formed positive-ions play an important role in negative-ion formation and can be explained by . For α = β = 19°, the exponential item increases with increasing velocity. On the one hand, the perpendicular exit velocity is low for small exit angles (<19°), the initially formed negative ions will spend a long duration time near the surface. The efficient neutralization occurs and the final negative-ion fraction is mainly determined by the decay probability associated with
where the smaller exit angles correspond to smaller negative-ion fractions. On the other hand, the perpendicular exit velocity is high for large exit angles (> 19°), and there is only a short time for the exit neutrals to pick up electrons from the surface to form a negative ion. The final negative-ion fraction is mainly associated with the formation probability of
where the larger exit angles (smaller incident angles) correspond to smaller negative-ion fractions. Moreover, it indicates that the dynamical equilibrium is never achieved for high perpendicular exit velocities.
4. Conclusion
In this short review, we first describe the setup for water adsorption and for charge transfer measurements. The TOF-SARS technology developed in our laboratory has been used to study water adsorption on surfaces at room temperature and desorption with elevated temperatures. We have reviewed the experimental studies for positive and negative ion production in grazing scattering of 8.5–22.5 keV O, F, Cl negative ions on dissociated H2O covered Cu(110) surfaces at a scattering angle of 8°, as well as keV Na+ neutralization. The negative-ion fraction is projectile dependent and increases with incident velocity in specular scattering, which cannot be understood by the conventional “shifted Fermi sphere” model. The reason has been discussed by the increased surface work function and the strong interference of positive-ion production at short distances induced by large perpendicular energies where the charge transfer is non-adiabatic. Two kinds of parallel velocity effects have been well discussed. The neutralization of keV Na+ ions further supports the metal feature of the dissociated H2O covered Cu(110) surface.
An experimental study of charge transfer between negative carbon, oxygen and fluorine ions and Si(100) surfaces at a scattering angle of 38° was performed. The doping and even band gap effects on negative-ion formation have not been observed for Si(100) with two different doping concentrations. The positive-ion fraction is small and increases with perpendicular exit velocity and exit angle. The negative-ion fraction also increases monotonically with perpendicular exit velocity for specular scattering and the variation of negative-ion fractions with exit angle is nonmonotonic and presents a bell shape. For positive ion production, it is interpreted by the molecular orbital (MO) promotion model. For negative ion formation, it is found that the band gap effect is inefficient in electron transfer process in this relatively high energy range and that the modified resonant charge transfer model we built can reproduce the experimental data.
We also presented experimental results of negative carbon, oxygen, fluorine ions scattering on water covered Si(111) surface. These results are very similar to that on water covered Si(100). We find that the negative-ion fractions for H2O-Si(111) are slightly smaller than that for H2O-Si(100) for a given projectile, which indicates that the electron affinities of the projectiles and surface's DOS play crucial roles in negative ion production.
The charge transfer on water covered Cu and Si surfaces presents the characteristics of metals. Based on the resonant charge transfer model, we have built a complete theoretical framework to fit positive-ion fractions and quantitatively calculate negative-ion fractions including the contribution from positive ions, which has not been presented in the previous work.
Acknowledgements
The authors are very grateful to P. Liu, S. Qiu, X. Xiong, J. Lu, Q.Wang, L. Gao and L. Wang for their help in the experiment.
Additional information
Funding
References
- Hodgson, A.; Haq, S. Water Adsorption and the Wetting of Metal Surfaces. Surf. Sci. Rep. 2009, 64, 381–451.
- Andersson, K.; Ketteler, G.; Bluhm, H.; Yamamoto, S.; Ogasawara, H.; Pettersson, L.G.M.; Salmeron, M.; Nilsson, A. Autocatalytic Water Dissociation on Cu(110) at Near Ambient Conditions. J. Am. Chem. Soc. 2008, 130 (9), 2793–7.
- Thiel, P.A.; Madey, T.E. The Interaction of Water with Solid Surfaces: Fundamental Aspects. Surf. Sci. Rep. 1987, 40 (6-8), 224–224.
- Henderson, M.A. The Interaction of Water with Solid Surfaces: Fundamental Aspects Revisited. Surf. Sci. Rep. 2002, 46, 1–308.
- Belu, A.M.; Graham, D.J.; Castner, D.G. Time-of-flight Secondary ion Mass Spectrometry: Techniques and Applications for the Characterization of Biomaterial Surfaces. Biomaterials 2003, 24, 3635.
- Brongersma, H.H.; Draxler, M.; de Ridder, M.; Bauer, P. Surface Composition Analysis by Low-Energy Ion Scattering. Surf. Sci. Rep. 2003, 62, 63.
- Wang, Q.J.; Qiu, S.L.; Xiong, F.F.; Li, Y.; Ding, B.; Guo, Y.L.; Chen, X.M.; Chen, L. Charge Exchange of O− Scattering on a Si(111) Surface. Eur. Phys. J. D. 2015, 69, 210.
- Wang, L.; Sun, G.Z.; Liu, X.; Guo, X.Y.; Wei, M.X.; Qiu, S.L.; Yin, L.Y.; Zhang, Z.; Chen, X.M.; Guo, Y.L.; Luo, W.; Chen, L. Neutralization of Low Energy Na+ Ions in Grazing Scattering on Clean and Water Covered Cu(110) Surfaces. Nucl. Instrum. Methods Phys. Res. B. 2021, 497, 10–14.
- Chen, L.; Lu, J.J.; Liu, P.Y.; Gao, L.; Liu, Y.F.; Xiong, F.F.; Qiu, S.L.; Qiu, X.Y.; Guo, Y.L.; Chen, X.M. Dissociation and Charge Transfer of H2O on Cu(110) Probed in Real Time Using Ion Scattering Spectroscopy. Langmuir 2016, 32, 12047–12055.
- Chen, L.; Qiu, S.L.; Xiong, F.F.; Lu, J.J.; Liu, P.Y.; Ding, B.; Li, Y.; Cui, Y.; Guo, Y.L.; Chen, X.M. Nonadiabatic Dynamics in Energetic Negative Fluorine Ions Scattering from a Si(100) Surface. J. Chem. Phys. 2015, 143, 114703.
- Borisov, A.G.; Mertens, A.; Wethekam, S.; Winter, H. Effect of Projected Band Gap on Neutralization of Cs Ions During Grazing Scattering from a Cu(111) Surface. Phys. Rev. A. 2003, 68, 012901.
- Ren, J.; Meng, S. Atomic Structure and Bonding of Water Overlayer on Cu(110): The Borderline for Intact and Dissociative Adsorption. J. Am. Chem. Soc. 2006, 128, 9282–9283.
- Gao, L.; Zhu, Y.; Shi, Y.; Liu, P.; Xiao, Y.; Li, G.; Liu, Y.; Esaulov, V.A.; Chen, X.; Lin, C.; Guo, Y. Role of Projectile Energy and Surface Work Function on Charge Transfer of Ions Grazing Scattering on Dissociated H2O-Covered Cu(110). Appl. Surf. Sci. 2018, 428, 1082.
- Rabalais, J.W.; Chen, J.-N.; Kumar, R.; Narayana, M. Inelastic Processes in ion/Surface Collisions: Scattered ion Fractions and VUV Photon Emission for Ne+ and Ar+ Collisions with Mg and Y Surfaces. J. Chem, Phys. 1985, 83, 6489.
- Lavery, A.C.; Sosolik, C.E.; Keller, C.A.; Cooper, B.H. Charge Transfer and Memory Loss in keV Oxygen-ion Scattering from Cu(001). Phys. Rev. B. 2000, 61, 2291.
- Polak, M. On the Structure and Bonding of H2O Adsorbed on Cu(110). Surf. Sci. 1994, 321, 249–260.
- Xiong, F.F.; Gao, L.; Liu, Y.F.; Lu, J.J.; Liu, P.Y.; Qiu, S.L.; Qiu, X.Y.; Guo, Y.L.; Chen, X.M.; Chen, L. Dynamical Resonant Charge Transfer of Fast C−, O−, F− Ions and Water Covered Si(111) Surface. Vacuum 2017, 137, 23–30.
- Chen, L.; Ding, B.; Li, Y.; Qiu, S.L.; Xiong, F.F.; Zhou, H.; Guo, Y.L.; Chen, X.M. Evidence for the Incoming-Velocity Effect on Negative Fluorine Ions Scattering from a Highly-Oriented-Pyrolytic-Graphite Surface. Phys. Rev. A. 2013, 88, 044901.
- Liu, P.Y.; Shi, Y.Q.; Zhu, Y.C.; Zhang, X.; Li, Y.; Xiao, Y.Q.; Ren, F.; Gao, L.; Guo, Y.L.; Chen, L. Charge Transfer of Oxygen Negative Ions Scattering on Dissociated H2O-Covered Cu(l10) Surface. Nucl. Instrum. Methods Phys. Res. B. 2019, 450 (JUL.1), 56–60.
- Winter, H. Collisions of Atoms and Ions with Surfaces Under Grazing Incidence. Phys. Rep. 2002, 367, 387–582.
- Gao, L.; Zhu, Y.; Shi, Y.; Liu, P.; Xiao, Y.; Li, G.; Liu, Y.; Esaulov, V.A.; Chen, X.; Lin, C.; Guo, Y. Role of Projectile Energy and Surface Work Function on Charge Transfer of Ions Grazing Scattering on Dissociated H2O-Covered Cu(110). Phys. Rev. A. 2017, 99, 052705.
- Nordlander, P. Lifetimes of Negative-ion States Near Metal Surfaces. Phys. Rev. B. 1992, 46, 2584.
- Ustaze, S.; Guillemot, L.; Esaulov, V.A.; Nordlander, P.; Langreth, D.C. Multielectron Effects in the Interaction of F− Ions with Ag(110). Surf. Sci. 1998, 415, 1027–1031.
- Maazouz, M.; Borisov, A.G.; Esaulov, V.A.; Gauyacq, J.P.; Guillemot, L.; Lacombe, S.; Teillet-Billy, D. Effect of Metal Band Characteristics on Resonant Electron Capture: H− Formation in the Scattering of Hydrogen Ions on Mg, Al, and Ag Surfaces. Phys. Rev. B. 1997, 55, 13869.
- Bournel, F.; Gallet, J.J.; Khler, U.; Ellakhmissi, B.B.; Kubsky, S.; Carniato, S.; Rochet, F. Propanoate Grafting on (H,OH)-Si(001)-2 × 1. J. Phys.: Condens. Matter. 2015, 27, 054005.
- Henderson, M.A. The Interaction of Water with Solid Surfaces: Fundamental Aspects Revisited. Surf. Sci. Rep. 2002, 46, 1–308.
- Chen, L.; Qiu, S.L.; Liu, P.Y.; Xiong, F.F.; Lu, J.J.; Liu, Y.F.; Li, G.P.; Liu, Y.R.; Ren, F.; Xiao, Y.Q.; Gao, L.; Zhao, Q.S.; Ding, B.; Li, Y.; Guo, Y.L.; Chen, X.M. The Description of Charge Transfer in Fast Negative Ions Scattering on Water Covered Si(100) Surfaces. Appl. Surf. Sci. 2016, 387, 1174–1182.
- Maazouz, M.; Ustaze, S.; Guillemot, L.; Esaulov, V.A. Electron Capture and Loss in the Scattering of Fluorine and Chlorine Atoms and Ions on Metal Surfaces. Surf. Sci. 1998, 409, 189–198.
- Maazouz, M.; Guillemot, L.; Esaulov, V.A.; O’Connor, D.J. Electron Capture and Loss in the Scattering of Hydrogen and Oxygen Ions on a Si Surface. Surf. Sci. 1998, 398, 49–59.
- Lanyon, H.P.D.; Tuft, R.A. Bandgap Narrowing in Moderately to Heavily Doped Silicon. IEEE Trans. Electron Device 1979, 26, 1014.
- Sze, S.M.; Lee, M.K. Semiconductor Devices, Physics and Technology; John Wiley & Sons, 1985.
- Borisov, A.G.; Kazansky, A.K.; Gauyacq, J.P. Finite Time Effect in the Charge Transfer Process During an ion-Metal Surface Collision. Phys. Rev. Lett. 1998, 80, 1996.
- Hecht, T.; Winter, H.; Borisov, A.G.; Gauyacq, J.P.; Kazansky, A.K. Role of the 2D Surface State Continuum and Projected Band Gap in Charge Transfer in Front of a Cu(111) Surface. Phys. Rev. Lett. 2000, 84, 2517.
- Flowers, M.C.; Jonathan, N.B.H.; Morris, A.; Wright, S. The Adsorption and Reactions of Water on Si(100)-2 × 1 and Si(111)-7 × 7 Surfaces. Surf. Sci. 1996, 351, 87.
- Maazouz, M.; Guillemot, L.; Esaulov, V.A. Dynamical Electron Capture in the Scattering of Swift Hydrogen Ions on a Si Surface. Phys. Rev. B. 1997, 56, 9267.
- Katircioglu, S. Interaction of Water Molecule with Silicon Surfaces. Surf. Sci. 1987, 187, 569.
- Katircioglu, S.; Erkoc, S. Decomposition of C 60 Molecules on Si(111) Surface. Surf. Sci. 1997, 374, 208.
- Esaulov, V.A. Electron Detachment from Atomic Negative Ions. Ann Phys. 1986, 11, 493.
- Ciraci, S.; Wagner, H. Dissociation of Water Molecules on Si Surfaces. Phys. Rev. B. 1983, 27, 5180.
- Ranke, W.; Schmeisser, D. Adsorption of Water on a Cylindrical Silicon Crystal. Surf. Sci. 1985, 149, 485.