
Abstract
The interaction between Chronic lymphocytic leukemia (CLL) cells and monocyte-derived nurse-like cells (NLCs) is fundamentally important to CLL biology. However, studies of how CLL cells and NLCs interact have been hampered by the need for freshly obtained CLL blood samples, coupled with wide variation in the number of monocytes present in the blood of individual patients. Here, we report the development and validation of a cell-line model of NLCs which overcomes these difficulties. Co-culture of primary CLL cells with THP-1 cells induced to differentiate into macrophages by phorbol 12-myristate 13-acetate (PMA) significantly reduced both spontaneous and fludarabine-induced cell death of leukemic cells. Furthermore, compared with their M1-polarized counterparts, M2-polarized macrophages derived from PMA-differentiated THP-1 cells conferred to CLL cells greater protection from spontaneous and fludarabine-induced apoptosis. Since NLCs resemble M2 tumor-associated macrophages, this cell-line model could be useful for investigating the mechanisms through which NLCs protect CLL cells from spontaneous and drug-induced apoptosis.
Keywords:
Introduction
Chronic lymphocytic leukemia (CLL) is the most common blood cancer in adults in Western countries. It is characterized by the clonal expansion of antigen-experienced CD5+ B lymphocytes in the blood, bone marrow, and secondary lymphoid tissues such as lymph nodes and spleen [Citation1]. It is a heterogeneous disease, which runs a chronic relapsing course requiring multiple treatment episodes [Citation2]. Most patients receiving drug therapies eventually develop the refractory disease. Therefore, CLL still remains incurable despite the recent development of molecularly targeted therapies.
The fact that CLL cells are long-lived in vivo, but undergo apoptosis rapidly when cultured in vitro [Citation3,Citation4], strongly indicates that the survival of CLL cells depends on microenvironmental factors that are present at sites of tissue involvement including bone marrow and lymph nodes. It is now recognized that CLL is a microenvironment-dependent disease [Citation5–7]. Within the bone marrow and lymph node tissue microenvironments, CLL cells interact with accessory cells such as T cells, monocyte-derived nurse-like cells, stromal cells, and endothelial cells, as well as binding to yet-to-be fully characterized antigens via the B cell receptor [Citation2,Citation8]. As a result, CLL cells at these sites not only acquire additional survival signals that protect them from apoptosis but are also induced to proliferate, leading to the expansion of the malignant clone.
Monocyte-derived nurse-like cells (NLCs) most likely originate from blood monocytes and accumulate in the lymphoid tissues such as lymph nodes, bone marrow, and spleen [Citation9–12]. They display macrophage markers CD68 and CD163 [Citation10,Citation11,Citation13]. Recent studies showed that NLCs phenotypically resemble a predominantly M2-subtype of tumor-associated macrophages [Citation12–15].
NLCs can be developed in vitro by culturing fresh blood mononuclear cells obtained from CLL patients at an appropriate cell density for approximately 14 days [Citation9]. Numerous studies have shown that CLL cells co-cultured with NLCs are protected from both spontaneous and drug-induced cell death [Citation9–12,Citation15–19]. Thus, there is little doubt that NLCs provide an important protective milieu for CLL cells, contributing to their persistence and expansion in vivo. However, despite many attempts, the molecular mechanisms that mediate cross-talk between CLL cells and NLCs are still not fully understood [Citation9–11,Citation16,Citation20]. Efforts to achieve this understanding have been hampered by practical constraints. Thus, NLCs cannot be produced from CLL blood samples from all patients, and even among those samples that do yield NCLs, their production kinetics and final yield vary considerably [Citation11]. In addition, studies of NLCs are critically dependent on having a regular supply of fresh CLL blood samples. Establishing a cell-line model of NLCs would, therefore, be of considerable potential value to the CLL research community. Here we describe the development and validation of such a model using chemically differentiated human THP-1 cells.
Methods and materials
CLL Samples
Venous blood samples from CLL patients were obtained with written informed consent and the approval of the Liverpool (Adult) Local Research Ethics Committee (REC reference no. 06/Q1505/82). The clinical features of CLL samples used in this study are summarized in . Mononuclear cells were isolated by centrifugation of the blood over Lymphoprep (Axis-Shield PoC AS, Oslo, Norway) and used immediately for the generation of NLCs. The remaining CLL mononuclear cells were stored in a cryogenic −150 °C freezer for later use.
Table 1. Summary of clinical features of the CLL samples used in the study.
Generation of NLCs
To generate NLCs, fresh CLL mononuclear cells were cultured in multi-well plates at a density of 10 × 106 cells/mL in RPMI 1640 medium supplemented with 10% heat-inactivated fetal bovine serum, 2 mM L-glutamine, 100 U/mL penicillin, and 100 μg/mL streptomycin (Life Technologies/Thermo Fisher Scientific, Paisley, UK). The cells were incubated in a 37 °C, 5% CO2 humidified incubator for up to 14 days, with partial replacement of medium on alternate days.
Culturing and differentiation of THP-1 cells
The THP-1 cell line was obtained from the European Collection of Authenticated Cell Cultures (Salisbury, UK), and maintained in culture flasks containing the complete RPMI1640 medium as described above. To induce differentiation into macrophages, THP-1 cells (5 × 10⁵ cells/mL) were treated with 5 ng/mL phorbol 12-myristate 13-acetate (PMA) (Sigma-Aldrich, Gillingham, UK) for 2 days, as previously described [Citation21,Citation22]. For polarization to M1 macrophages, the supernatant of PMA-differentiated THP-1 cells was removed and replaced with the fresh complete medium containing 20 ng/mL interferon-γ (IFN-γ) (PeproTech EC Ltd, London, UK) and 10 pg/mL lipopolysaccharides (LPS) (Sigma-Aldrich) for 24 h [Citation23–25]. To induce M2 macrophages, the supernatant of PMA-differentiated THP-1 cells was removed and replaced with the fresh complete medium containing 30 ng/mL interleukin-4 (IL-4) (R&D Systems, Oxford, UK) and incubated for 72 h, with additional IL-4 (30 ng/mL) added at 48 h [Citation23–26].
Co-culture experiments
Cryopreserved CLL samples were thawed and cultured at 3 × 10⁶ cells/mL with adherent NLCs or differentiated THP-1 cells for the indicated times.
Light microscopy
Cells were stained using the May–Grünwald Giemsa method [Citation27] to distinguish the cellular components of monocytes and macrophages [Citation28].
Other information on flow cytometry analysis of cell death and surface expression of IgM and IgD, immunofluorescent microscopy, and measuring CCL3 and CCL4 by ELISA is detailed in the supplementary information.
Results
NLCs protect CLL cells from spontaneous cell death
We first generated NLCs from mononuclear cells isolated from fresh CLL blood samples as originally described [Citation9]. Monocytes started to develop into stromal-like adherent cells after 3-5 days in culture. These adherent cells displayed distinct morphologies when viewed by phase-contrast microscopy, some with a large oval shape and others becoming elongated or spindle-shaped (). The morphological pleomorphism of the adherent cells was confirmed by May Grünwald Giemsa staining which also revealed vacuolar or granular cytoplasm (). The adherent cells were in close contact with numerous CLL cells as identified by their small size, scanty cytoplasm, and densely basophilic nuclei (). In summary, the morphological features of the adherent cells were typical of NLCs [Citation9].
Figure 1. Characterization of nurse-like cells (NLCs). Fresh CLL mononuclear cells were cultured at a cell density of 10 × 106/mL for up to 14 days as described in Methods. (A) Phase contrast image of one CLL sample cultured on day 6, showing CLL cells appearing as small circular/oval-shaped cells with <10µm in diameter and NLCs displaying a larger more pleomorphic morphology such as large oval-shaped as well as elongated (red arrow head). (B) May Grünwald Giemsa stained NLCs seen under oil immersion showing multiple clusters of pleomorphic macrophages closely surrounded by CLL cells of a dark stained nucleus with a high N:C ratio. The NLCs have a broad range of morphology from large oval appearance to elongated and spindle-shaped and having characteristic vacuoles with granular cytoplasm (red arrow head). (C) Immunofluorescence microscopy staining of NLCs developed after 9 days of culture for CD163 (red) and counterstained with DAPI (blue). CLL cells were stained with CD19 (green) and counterstained with DAPI (blue). The respective isotype antibodies were used as controls. (D) NLCs in co-culture with thawed autologous CLL cells protected CLL cells against spontaneous cell death. Viability of CLL cells was measured by Annexin V/PI staining by flow cytometry. Each data point represents mean ± SEM of 8 independent experiments using 8 different CLL samples. *Refers to p value of <0.05.
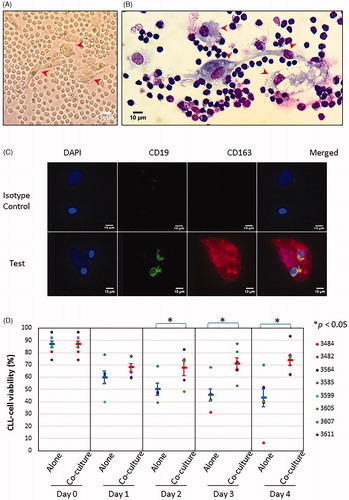
Since NLCs have a phenotype similar to that of M2 macrophages [Citation14,Citation15], we examined the adherent cells by immunofluorescent microscopy for the expression of the M2 macrophage markers CD68 and CD163 [Citation10,Citation11,Citation13,Citation29,Citation30]. As expected, the adherent cells expressed both CD163 () and CD68 (Supplementary Figure 1(A)), further confirming their identity as NLCs.
Next, we assessed the functionality of the adherent cells in protecting CLL cells from spontaneous apoptosis. To do this, we generated NLCs first as described above. On the day of the co-culture experiment, the CLL cells in the original culture were first removed by gentle pipetting, as shown in Supplementary Figure 1(B) (left panel). Cryopreserved CLL cells from the same blood sample used to develop NLCs were then thawed and co-cultured with the NLCs (Supplementary Figure 1(B), middle panel) or cultured alone for comparison (Supplementary Figure 1(B), right panel). As shown in , CLL cells co-cultured with NLCs over 4 days were more viable than CLL cells cultured alone. A statistically significant difference in viability was observed as early as day 2 and persisted thereafter (). Thus, co-culturing CLL cells with NLCs protected them from spontaneous death, in keeping with previous reports [Citation9,Citation10].
Generation of NLCs varies widely between individual patients
Whilst we confirmed the pro-survival effects of NLCs on CLL cells, we also noticed a considerable variation in the extent to which NLCs could be generated from fresh CLL blood samples under the experimental conditions we used. Among the 65 CLL samples examined (), we observed that NLCs with typical morphology of macrophage as shown in were generated in only 21 samples (32.3%). Supplementary Figure 2(A) shows an example of these ‘well-developed NLCs’ which were used for co-culture experiments as described in . Next, 14 CLL samples (21.5%) generated fewer NLCs with less distinctive macrophage-like morphology (referred to as ‘moderately-developed NLCs’) ( and Supplementary Figure 2(B)). In contrast, 27 out of 65 CLL samples (41.5%) generated very few NLCs (so-called ‘poorly developed NLCs’) with 3 CLL samples developing no NLC at all ( and Supplementary Figure 2(C,D), respectively). In order to determine whether the variation in developing NLCs may be correlated to the clinical features of the CLL samples used in the study, we assigned a score of NLC development (NLC score) to all individual samples () and performed a series of correlation analyses. However, we did not detect any statistically significant correction of NLC development with gender, IGHV mutational status, clinical staging, chromosomal abnormalities, or treatment history (Supplementary Tables 1–5). Therefore, exactly why there is such wide variation in the generation of NLCs between individual CLL samples remains unclear. Nonetheless, the above finding poses a significant challenge to researchers in obtaining reproducible results and highlights the need to develop a cell line-based model of NLCs to allow co-culture experiments to be performed under consistent conditions.
Table 2. Variation in generation of NLCs from CLL samples studied.
PMA-differentiated THP-1 cells protect CLL cells from spontaneous and drug-induced cell death
To this end, we selected human monocytic leukemia THP-1 cells as they can be induced to differentiate into macrophages by PMA [Citation22,Citation31,Citation32]. As expected, the addition of PMA to THP-1 cells resulted in the appearance of macrophage-like adherent cells with pleomorphic morphology (, left panel). We also stained the adherent cells for macrophage markers [Citation22] and showed that they co-expressed CD14 and CD163 (Supplementary Figure 3(A)). To test if the PMA-differentiated THP-1 cells were able to protect CLL cells from spontaneous cell death as seen with NLCs, CLL cells were co-cultured with the adherent THP-1 cells (, middle panel) or alone for comparison (, right panel). As is shown in , CLL cells co-cultured over 3 days with PMA-differentiated THP-1 cells had better viability than the same cells cultured alone. A significant difference in viability was seen after 24 h and persisted for the rest of the incubation period (). Therefore, PMA-differentiated THP-1 cells protected CLL cells from spontaneous cell death.
Figure 2. Characterization of PMA-differentiated THP-1 cells. (A) Phase contrast microscopy of THP-1 cells treated with PMA for 48 h when cultured alone (left) or co-cultured with CLL cells (middle, red arrow head). CLL cells cultured alone (right) were used as controls. (B) Viability of CLL cells cultured alone vs co-cultured with PMA-differentiated THP-1 cells over 3 days was measured as in . Data points represent mean ± SEM of 5 independent experiments using 5 different CLL samples. (C) Percentage of drug-induced killing of CLL cells cultured alone and treated with 10 µM fludarabine for 48 h was compared to that of CLL cells that were similarly treated but co-cultured with differentiated THP-1 cells. The percentage of drug-induced killing was calculated as: 100 × [(% Cell death of drug-treated cells − % Cell death of untreated cells)/(100 − % Cell death of untreated cells)]. Data points represent mean ± SEM of 2 independent experiments, each experiment performed using 3 different CLL samples. *Refers to p value of <0.05.
![Figure 2. Characterization of PMA-differentiated THP-1 cells. (A) Phase contrast microscopy of THP-1 cells treated with PMA for 48 h when cultured alone (left) or co-cultured with CLL cells (middle, red arrow head). CLL cells cultured alone (right) were used as controls. (B) Viability of CLL cells cultured alone vs co-cultured with PMA-differentiated THP-1 cells over 3 days was measured as in Figure 1(D). Data points represent mean ± SEM of 5 independent experiments using 5 different CLL samples. (C) Percentage of drug-induced killing of CLL cells cultured alone and treated with 10 µM fludarabine for 48 h was compared to that of CLL cells that were similarly treated but co-cultured with differentiated THP-1 cells. The percentage of drug-induced killing was calculated as: 100 × [(% Cell death of drug-treated cells − % Cell death of untreated cells)/(100 − % Cell death of untreated cells)]. Data points represent mean ± SEM of 2 independent experiments, each experiment performed using 3 different CLL samples. *Refers to p value of <0.05.](/cms/asset/bb6b7086-7e0e-411b-9a01-0e68ef9c9b24/ilal_a_1811274_f0002_c.jpg)
Next, we sought to establish if the PMA-differentiated THP-1 cells could also protect CLL cells against chemotherapy-induced killing. We used fludarabine as it is the backbone of current chemotherapy regimens. We previously showed that 10 µM fludarabine is effective in killing CLL cells following 48 h incubation under standard culture conditions [Citation33]. CLL cells were therefore incubated with 10 µM fludarabine for 48 h and killing measured by flow cytometry [Citation33]. As is shown in , on average fludarabine killed ∼50% of CLL cells when they were cultured alone. In contrast, fludarabine killed ∼20% of CLL cells when they were co-cultured with PMA-differentiated THP-1 cells. This result indicates that the PMA-differentiated THP-1 cells protected CLL cells from fludarabine-induced cell death.
We then sought to establish to what extent the cytoprotective effect of PMA-differentiated THP-1 cells depends on BCL-2. To do this, we used ABT-199, a novel BCL-2 inhibitor that has displayed impressive clinical activity in CLL [Citation34]. As expected, ABT-199 treatment resulted in the concentration-dependent killing of CLL cells when they were cultured alone (Supplementary Figure 3(B)). The killing of CLL cells by ABT-199 was unaffected by co-culturing them with PMA-differentiated THP-1 cells (Supplementary Figure 3(B)). These results indicate that the cytoprotective effect of differentiated THP-1 cells is lost in the presence of BCL-2 inhibition and that it must, therefore, be BCL-2 dependent.
M2 macrophages derived from differentiated THP-1 cells conferred greater cytoprotection than M1 macrophages
As NLCs have been shown to more closely resemble M2 than M1 macrophages [Citation14,Citation15], we further polarized PMA-differentiated THP-1 cells (here designated as M0 macrophages) into M1 macrophages by IFN-γ and LPS, and into M2 macrophages by IL-4, as previously described [Citation23–26]. Immunofluorescence staining was performed for M1 and M2 macrophage markers. As shown in , the M1 macrophages marker CD38 [Citation25] was detected only on IFN-γ and LPS-treated cells, whereas the M2 macrophages marker EGR2 [Citation25] was present only on IL-4-treated cells. M0 macrophages expressed neither CD38 nor EGR2 (). Morphologically, M1 macrophages appeared to be mainly oval-shaped whereas M2 macrophages displayed pleomorphic morphology including elongated or spindle-like forms (, top panels). These observations are consistent with the respective morphology of M1 and M2 macrophages [Citation26].
Figure 3. Characterization of polarized macrophages derived from PMA-differentiated THP-1 cells. (A) Immunofluorescence microscopy of PMA-differentiated THP-1 cells (M0 macrophages), macrophages further polarized by IFN-γ and LPS (M1) or by IL-4 (M2). Cells were stained with anti-EGR2 (green) and anti-CD38 (red) and counterstained with DAPI (blue). M1 macrophages (middle row) show high expression of CD38, M2 macrophages (bottom row) show high expression of EGR2, and M0 macrophages (top row) show minimal expression of CD38 or EGR2. (B) Phase contrast microscopy of PMA-differentiated THP-1 cells and polarized M1 (top left and bottom left, red arrow head), and M2 macrophages (top right and bottom right, red arrow head). M1 macrophages appear as large oval-shaped cells whereas M2 macrophages are large and elongated. M1 or M2 macrophages cultured alone (top row) and in co-culture with CLL cells (bottom row), respectively, are shown.
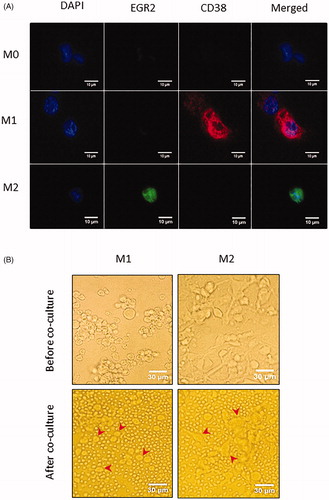
We then performed co-culture experiments in which primary CLL cells were co-incubated with M1 or M2 macrophages for up to 3 days (, bottom panels). CLL cells cultured alone were again used for comparison. As is shown in , CLL cells co-cultured with M1 macrophages retained higher viability than that of CLL cells cultured alone, but the difference was not significant. In contrast, CLL cells co-cultured with M2 macrophages achieved much higher viability than that of CLL cells cultured alone, with a statistically significant difference seen as early as 24 h. Furthermore, the viability of CLL cells co-cultured with M2 macrophages was significantly higher than that of CLL cells co-cultured with M1 macrophage from day 2 onwards (). These results indicate that M2 macrophages confer greater protection from spontaneous cell death compared to M1 macrophages.
Figure 4. Functional comparison of various differentiated THP-1 cells. (A) Viability of CLL cells cultured alone vs co-cultured with M1 or M2 macrophages over 3 days was measured as in . Data points represent mean ± SD of independent experiments using 5 different CLL samples. (B) Percentage of drug-induced cell death of CLL cells cultured alone for 48 h in the presence of 10 µM of fludarabine was compared to that of CLL cells that were similarly treated but co-cultured with M0, M1 or M2 macrophages, respectively. Data points represent mean ± SEM of 2 independent experiments, with each experiment performed using 3 different CLL samples. (C) Percentage of drug-induced killing of CLL cells cultured alone for 24 h in the presence of ABT-199 at the indicated concentrations was compared to that of CLL cells that were similarly treated but co-cultured with M0, M1 or M2 macrophages. Data are mean ± SEM of 2 independent experiments, each experiment performed using 3 different CLL samples. *Refers to p value of <0.05.
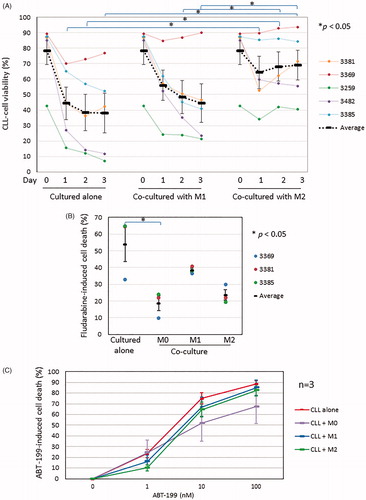
Next, we co-cultured CLL cells with M0, M1, or M2 macrophages for 48 h in the presence of 10 µM fludarabine and measured drug-induced cell death in the co-cultured CLL cells, using CLL cells cultured alone for comparison. As is shown in , co-culture with M0 macrophages again significantly protected CLL cells from fludarabine-induced killing. CLL cells co-cultured with M2, and to a lesser extent M1, macrophages were also protected from fludarabine-induced killing, although the effect was not statistically significant. Next, we repeated the co-culture experiments with ABT-199. As shown in and in keeping with our previous findings (Supplementary Figure 2(B)), co-culture with M0, M1 or M2 macrophages had no significant effect on the killing of CLL cells by ABT-199.
Taken together, the above results indicate that M0 or M2 but not M1 macrophages derived from PMA-differentiated THP-1 cells protect CLL cells from spontaneous and fludarabine-induced cell death. However, the M2 macrophages were not as cytoprotective as the M0 macrophages.
CCL3 and CCL4 protein expression was increased in CLL-NLC cocultures, but not in cocultures of CLL cells with various differentiated THP-1 cells
It has previously been reported that NLCs induce CLL cells to secrete the T-cell chemokines CCL3 and CCL4 into the culture medium where they can be measured by ELISA [Citation20]. We, therefore, sought to establish if the differentiated THP-1 cells have the same effect. To do this, we first measured levels of CCL3 and CCL4 in the supernatant from the co-cultures of CLL cells and NLCs. As expected, levels of CCL3 and CCL4 proteins were increased from day 5 and reached a plateau by day 10 (Supplementary Figure 4(A)). We next measured levels of CCL3 and CCL4 in the supernatant of differentiated THP-1 cells. As shown in Supplementary Figure 4(B), PMA-differentiated THP-1 cells (M0 macrophages) secreted high levels of CCL3 and CCL4. In keeping with previous reports [Citation35,Citation36], THP-1 cell-derived M1 macrophages secreted even more CCL3 and CCL4 (Supplementary Figure 4(B)). In contrast, levels of CCL3 and CCL4 in M2 macrophages were similar to those produced by CLL cells cultured alone. Culturing CLL cells with various differentiated THP-1 cells (M0, M1, or M2) did not increase the total amount of CCL3 and CCL4 secreted into the supernatant for up to 3 days (Supplementary Figure 4(B)). Our findings indicate that THP-1 cell-derived M0 and M1 macrophages secrete CLL3 and CCL4 but do not induce CLL cells to secrete these chemokines.
Surface expression of IgM and IgD was not decreased in CLL cells co-cultured with M0 or M2 macrophages
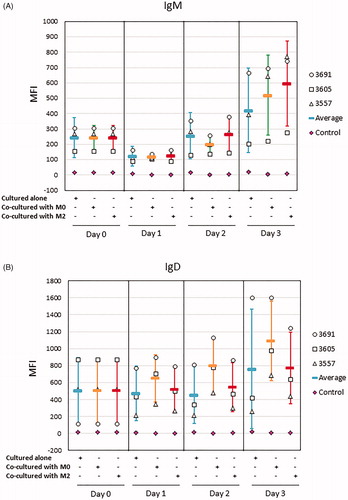
It has been reported that CLL cells cultured in vitro display a transient increase in surface expression of IgM and IgD and that co-culture with NLCs prevents IgM/IgD re-expression [Citation37]. We, therefore, sought to establish if the differentiated THP-1 cells have the same effect. First, we screened CLL samples to select those samples that have the potential to recover the IgM expression when cultured alone. This seemed important since the re-expression of IgM is known to vary between cases and is strongly associated with BCR signaling capacity [Citation38]. As shown in Supplementary Figure 5, all nine CLL samples initially exhibited reduced expression of IgM 24 h after incubation in vitro. Only some of these samples recovered their expression of IgM at 48 h. Next, we used these latter samples for co-culture experiments with M0 or M2 macrophages. As shown in , the expression of IgM on CLL cells cultured alone was reduced at 24 h, but recovered at 48 h and further increased at 72 h. A very similar finding was observed in CLL cells co-cultured with M0 or M2 macrophages, with levels of surface IgM being no lower than on CLL cells cultured alone at the same time points (). We also monitored the expression of IgD on CLL cells cultured in alone or with M0 or M2 macrophages and obtained similar results (). In summary, the surface expression of IgM and IgD on CLL cells was not reduced by co-culturing with THP-1-derived M0 or M2 macrophages over a 72 h incubation period.
Figure 5. Surface expression of IgM and IgD was not reduced on CLL cells co-cultured with M0 or M2 macrophages over 3 days. THP-1 cells were differentiated into M0 or M2 macrophages as in . Thawed primary CLL cells were cultured alone or co-cultured with M0 or M2 macrophages over 3 days and surface expression of IgM (A) and IgD (B) on CLL cells was analyzed by flow cytometry as described in the Method section. Data represent mean ± SD of independent experiments using 3 different CLL samples. Mean fluorescence intensity (MFI) of CLL cells stained with respective isotype control antibodies (Control) was also shown as mean ± SD.
Discussion
Here we report the development of an in-vitro model using human leukemic THP-1 cells to mimic the biological functions of NLCs. The rationale for developing such a model is three-fold. First, access to fresh CLL samples on a regular basis is not always possible. Second, maintaining long-term (∼2 weeks) cultures of fresh CLL blood samples in a consistent manner can be difficult as it requires constant attention and regular replacement of culture medium. Third, we and others [Citation11] have observed significant case-to-case variation in the generation of NLCs. In our study, we used fresh CLL blood samples from 65 individual CLL patients and observed that only 35 of these samples generated sufficient numbers of NLCs that could be used for subsequent experiments. In summary, generating primary NLCs is laborious, technically challenging, and subject to wide variation between individual patients, all of which prompted us to explore a cell-line model for NLCs that would overcome these difficulties.
We chose THP-1 cells as they originate from human monocytes [Citation39] and can be induced to differentiate into macrophages by PMA [Citation22,Citation31,Citation32]. It has also been shown that the PMA-differentiated THP-1 cells can be further polarized to M1 or M2 macrophages [Citation24,Citation40]. In the present study, we have shown that PMA-differentiated THP-1 cells can protect CLL cells from both spontaneous and fludarabine-induced cell death. These cells, therefore, recapitulated the cytoprotective effect of primary NLCs [Citation9–11,Citation13,Citation15–19]. We also showed that PMA-differentiated THP-1 cells did not protect CLL cells from ABT-199-induced cell death, a result consistent with a recent report that NLCs failed to protect CLL cells from ABT-199-induced apoptosis [Citation41]. These findings indicate that the cytoprotective effect of differentiated THP-1 cells is BCL-2 dependent. This idea is consistent with a previous study showing that CLL cells co-cultured with NLCs were induced to over-express several genes encoding anti-apoptotic proteins including BCL-2 [Citation17].
Having demonstrated the pro-survival effect of PMA-differentiated THP-1 cells on CLL cells, we next investigated the relative contribution to this effect of M1 and M2 macrophages. This seemed important as NLCs resemble M2 macrophages [Citation14,Citation15]. We showed that, compared to their M1 counterparts, THP-1 cell-derived M2 macrophages conferred greater protection to CLL cells against both spontaneous and fludarabine-induced cell death. Our finding is in agreement with a recent report contrasting the effects of THP-1 cell-derived M1 vs M2 macrophages on cancer cells in response to drug-induced apoptosis [Citation24]. In that study, the co-culture of human hepatocarcinoma HepG2 or lung adenocarcinoma A549 cells with M2 macrophages significantly reduced etoposide-induced apoptosis of cancer cells, compared to co-culture with M1 macrophages.
In an attempt to recapitulate in the THP-1 cell-line model the effect of NLCs in inducing CLL cells to secrete CCL3 and CCL4 [Citation20], we measured levels of these cytokines in supernatant from CLL cells co-cultured with differentiated THP-1 cells over 3 days. Although levels of CCL3 and CCL4 were increased in the supernatant from CLL cells co-cultured with M0 and M1 macrophages compared to CLL cells cultured alone, similar increases were also observed in the supernatants from the corresponding macrophages cultured alone. Thus, the increase in levels of CCL3 and CCL4 is likely due to the presence of differentiated THP-1 cells in the co-culture system. The cell-line model therefore may not recapitulate the chemokine-inducing properties reported for primary NLCs [Citation20]. The functional difference between primary NLCs and THP-1 cell-line model was further highlighted by our finding that CLL cells co-cultured with M0 or M2 macrophages over 72 h did not express reduced levels of IgM or IgD, whereas CLL cells co-cultured with primary NLCs display a significant reduction in surface expression of IgM and IgD [Citation37]. Taken together, the above results indicate that the cell-line model may not replicate the BCR stimulating activity that has been reported for primary NLCs.
In summary, we report for the first time the development of a robust, reproducible, and well-characterized model of NLCs using chemically differentiated THP-1 cells. Although the THP-1 cells did not recapitulate all of the reported features of NLCs, it is envisaged that this cell line model will nevertheless be useful for many studies investigating the cytoprotective effect of NLCs and other macrophages in CLL and other hematological malignancies.
Authors’ contributions
ISM performed experiments and analyzed data. KL analyzed data and critically reviewed the manuscript. MO collected and provided CLL samples. UTK provided clinical information of the patients. JB critically revised the manuscript. ARP designed the study and wrote the manuscript. JZ designed the study, analyzed data, and wrote the manuscript. All authors approved the final version of the manuscript.
GLAL-2020-0693-File008.pdf
Download PDF (4.6 MB)GLAL-2020-0693-File007.docx
Download MS Word (19.8 KB)Acknowledgments
The authors are grateful to Miss Lucy Urbas for performing some of the drug-induced apoptosis experiments. The authors also wish to thank all CLL patients for donating their blood samples for this research.
Disclosure statement
No potential conflict of interest was reported by the author(s).
Additional information
Funding
References
- Fabbri G, Dalla-Favera R. The molecular pathogenesis of chronic lymphocytic leukaemia. Nat Rev Cancer. 2016;16(3):145–162.
- Kipps TJ, Stevenson FK, Wu CJ, et al. Chronic lymphocytic leukaemia. Nat Rev Dis Primers. 2017;3:16096.
- Collins RJ, Verschuer LA, Harmon BV, et al. Spontaneous programmed death (apoptosis) of B-chronic lymphocytic leukaemia cells following their culture in vitro. Br J Haematol. 1989;71(3):343–350.
- Coscia M, Pantaleoni F, Riganti C, et al. IGHV unmutated CLL B cells are more prone to spontaneous apoptosis and subject to environmental prosurvival signals than mutated CLL B cells. Leukemia. 2011;25(5):828–837.
- Burger JA. Nurture versus nature: the microenvironment in chronic lymphocytic leukemia. Hematology Am Soc Hematol Educ Program. 2011;2011:96–103.
- Caligaris-Cappio F, Bertilaccio MT, Scielzo C. How the microenvironment wires the natural history of chronic lymphocytic leukemia. Semin Cancer Biol. 2014;24:43–48.
- Ten Hacken E, Burger JA. Microenvironment interactions and B-cell receptor signaling in chronic lymphocytic leukemia: implications for disease pathogenesis and treatment. Biochim Biophys Acta. 2016;1863(3):401–413.
- Burger JA, Chiorazzi N. B cell receptor signaling in chronic lymphocytic leukemia. Trends Immunol. 2013;34(12):592–601.
- Burger JA, Tsukada N, Burger M, et al. Blood-derived nurse-like cells protect chronic lymphocytic leukemia B cells from spontaneous apoptosis through stromal cell-derived factor-1. Blood. 2000;96(8):2655–2663.
- Tsukada N, Burger JA, Zvaifler NJ, et al. Distinctive features of “nurselike” cells that differentiate in the context of chronic lymphocytic leukemia. Blood. 2002;99(3):1030–1037.
- Jia L, Clear A, Liu FT, et al. Extracellular HMGB1 promotes differentiation of nurse-like cells in chronic lymphocytic leukemia. Blood. 2014;123(11):1709–1719.
- Boissard F, Laurent C, Ramsay AG, et al. Nurse-like cells impact on disease progression in chronic lymphocytic leukemia. Blood Cancer J. 2016;6(1):e381.
- Boissard F, Fournié JJ, Laurent C, et al. Nurse like cells: chronic lymphocytic leukemia associated macrophages. Leuk Lymphoma. 2015;56(5):1570–1572.
- Ysebaert L, Fournié JJ. Genomic and phenotypic characterization of nurse-like cells that promote drug resistance in chronic lymphocytic leukemia. Leuk Lymphoma. 2011;52(7):1404–1406.
- Filip AA, Ciseł B, Koczkodaj D, et al. Circulating microenvironment of CLL: are nurse-like cells related to tumor-associated macrophages? Blood Cells Mol Dis. 2013;50(4):263–270.
- Nishio M, Endo T, Tsukada N, et al. Nurselike cells express BAFF and APRIL, which can promote survival of chronic lymphocytic leukemia cells via a paracrine pathway distinct from that of SDF-1alpha. Blood. 2005;106(3):1012–1020.
- Filip AA, Ciseł B, Wąsik-Szczepanek E. Guilty bystanders: nurse-like cells as a model of microenvironmental support for leukemic lymphocytes. Clin Exp Med. 2015;15(1):73–83.
- Boissard F, Tosolini M, Ligat L, et al. Nurse-like cells promote CLL survival through LFA-3/CD2 interactions. Oncotarget. 2017;8(32):52225–52236.
- Fiorcari S, Maffei R, Audrito V, et al. Ibrutinib modifies the function of monocyte/macrophage population in chronic lymphocytic leukemia. Oncotarget. 2016;7(40):65968–65981.
- Burger JA, Quiroga MP, Hartmann E, et al. High-level expression of the T-cell chemokines CCL3 and CCL4 by chronic lymphocytic leukemia B cells in nurselike cell cocultures and after BCR stimulation. Blood. 2009;113(13):3050–3058.
- Park EK, Jung HS, Yang HI, et al. Optimized THP-1 differentiation is required for the detection of responses to weak stimuli. Inflamm Res. 2007;56(1):45–50.
- Daigneault M, Preston JA, Marriott HM, et al. The identification of markers of macrophage differentiation in PMA-stimulated THP-1 cells and monocyte-derived macrophages. PLoS One. 2010;5(1):e8668.
- Chanput W, Mes JJ, Wichers HJ. THP-1 cell line: an in vitro cell model for immune modulation approach. Int Immunopharmacol. 2014;23(1):37–45.
- Genin M, Clement F, Fattaccioli A, et al. M1 and M2 macrophages derived from THP-1 cells differentially modulate the response of cancer cells to etoposide. BMC Cancer. 2015;15:577.
- Jablonski KA, Amici SA, Webb LM, et al. Novel markers to delineate murine M1 and M2 macrophages. PLoS One. 2015;10(12):e0145342.
- McWhorter FY, Wang T, Nguyen P, et al. Modulation of macrophage phenotype by cell shape. Proc Natl Acad Sci USA. 2013;110(43):17253–17258.
- Bain BJ, Bates I, Laffan MA, et al. Preparation and staining methods for blood and bone marrow films. In: Bates I, editor. Dacie and Lewis practical hematology. 11th Ed. London (UK): Churchill Livingstone; 2012. Chapter 4.
- Lichtman MA, Kipps TJ, Seligsohn U, et al. Morphology of monocytes and macrophages. In: Lichtman MA, editor. Williams hematology. 8th Ed. New York (NY): McGraw-Hill Companies, Inc.; 2010. Chapter 67.
- Hume DA, Freeman TC. Transcriptomic analysis of mononuclear phagocyte differentiation and activation. Immunol Rev. 2014;262(1):74–84.
- Mills CD. Anatomy of a discovery: m1 and m2 macrophages. Front Immunol. 2015;6:212.
- Ramprasad MP, Terpstra V, Kondratenko N, et al. Cell surface expression of mouse macrosialin and human CD68 and their role as macrophage receptors for oxidized low density lipoprotein. Proc Natl Acad Sci USA. 1996;93(25):14833–14838.
- Schwende H, Fitzke E, Ambs P, et al. Differences in the state of differentiation of THP-1 cells induced by phorbol ester and 1,25-dihydroxyvitamin D3. J Leukoc Biol. 1996;59(4):555–561.
- Zhuang J, Laing N, Oates M, et al. Selective IAP inhibition results in sensitization of unstimulated but not CD40-stimulated chronic lymphocytic leukaemia cells to TRAIL-induced apoptosis. Pharmacol Res Perspect. 2014;2(6):e00081.
- Roberts AW, Davids MS, Pagel JM, et al. Targeting BCL2 with venetoclax in relapsed chronic lymphocytic leukemia. N Engl J Med. 2016;374(4):311–322.
- Mantovani A, Sozzani S, Locati M, et al. Macrophage polarization: tumor-associated macrophages as a paradigm for polarized M2 mononuclear phagocytes. Trends Immunol. 2002;23(11):549–555.
- Mantovani A, Sica A, Sozzani S, et al. The chemokine system in diverse forms of macrophage activation and polarization. Trends Immunol. 2004;25(12):677–686.
- Ten Hacken E, Sivina M, Kim E, et al. Functional differences between IgM and IgD signaling in chronic lymphocytic leukemia. J Immunol. 2016;197(6):2522–2531.
- Mockridge CI, Potter KN, Wheatley I, et al. Reversible anergy of sIgM-mediated signaling in the two subsets of CLL defined by VH-gene mutational status. Blood. 2007;109(10):4424–4431.
- Tsuchiya S, Yamabe M, Yamaguchi Y, et al. Establishment and characterization of a human acute monocytic leukemia cell line (THP-1). Int J Cancer. 1980;26(2):171–176.
- Chanput W, Mes JJ, Savelkoul HF, et al. Characterization of polarized THP-1 macrophages and polarizing ability of LPS and food compounds. Food Funct. 2013;4(2):266–276.
- Boissard F, Fournié JJ, Quillet-Mary A, et al. Nurse-like cells mediate ibrutinib resistance in chronic lymphocytic leukemia patients. Blood Cancer J. 2015;5(10):e355.