
Abstract
Multiple myeloma treatment has evolved with approvals of new immunomodulatory imide drugs (IMiDs), monoclonal antibodies (MoABs), and proteasome inhibitors (PIs). We characterized U.S. treatment trends and survival from 2011 to 2019 using Flatiron data from multiple myeloma patients followed from treatment index until death/end of data. Patients (n = 10,553) were primarily (88%) treated in community centers. Frontline PI-IMiD-dexamethasone use increased over time, while IMiD-dexamethasone and PI-dexamethasone use decreased. MoAB-IMiD-dexamethasone use increased in relapsed/refractory disease. In all lines, use of doublets decreased and triplets increased, with triplets becoming the most prescribed combination by 2018–2019, especially in first line (62%). Monotherapy use decreased in first line (19% to 10%) but remained steady in relapsed/refractory disease (∼20%). With each increasing line of therapy, median overall survival decreased (60, 48, 36, 29, 23 months). Survival increased with more recent diagnosis. Our results indicate that the multiple myeloma landscape has evolved significantly in the last decade.
Introduction
Multiple myeloma, a clonal plasma cell disorder, is the second most common hematologic malignancy in adults. An estimated 32,000 new cases of multiple myeloma were expected in the USA in 2019 with approximately 13,000 deaths from the disease [Citation1]. While over the last 10 years, rates of new multiple myeloma cases have not changed significantly, the prognosis of multiple myeloma patients has improved, with almost 47% of diagnosed patients surviving 5 years or longer [Citation2] and median survival increasing over time [Citation3], resulting in a steadily increasing prevalence of the disease [Citation4]. The improved prognosis is likely due in part to the introduction of high-dose chemotherapy and stem cell support in the early 1990s and in part to the approval of several targeted treatments for multiple myeloma ([Citation5–8], Supplementary Table S1). As patients with multiple myeloma have advanced age at diagnosis – median of 69 years [Citation4] – and associated comorbidities, regimens need to have a manageable toxicity profile. Despite all these agents leading to improved outcomes and patients living longer, patients eventually relapse, and multiple myeloma remains an incurable disease [Citation9]. Multiple myeloma management is rapidly evolving as new therapies and modalities continue to be investigated and gain approval [Citation10], with many investigational therapies using an immunotherapy approach, such as bispecific antibodies or chimeric antigen receptor T-cells, and with many potential therapies targeting B-cell maturation antigen (BCMA) [Citation11–13].
Emerging therapies are transforming the therapeutic landscape of multiple myeloma in both newly diagnosed and relapsed and/or refractory patients, with new agents and combinations being incorporated into treatments every year. Currently, there is limited real-world evidence describing recent trends and outcomes for patients with multiple myeloma; existing descriptions are primarily claims based and date back to 2015 [Citation3,Citation14,Citation15]. The purpose of this study is to characterize recent changes and trends in the treatment landscape and outcomes in patients with newly diagnosed multiple myeloma through to the fifth + line of therapy (LOT) over time from 2011 to 2019 in the USA using a nationwide Flatiron Health electronic health record (EHR)–derived de-identified database.
Methods
Data source
In this retrospective cohort study, data were derived from Flatiron Health EHR and included patients diagnosed with multiple myeloma in the USA from 1 January 2011 through 31 December 2019. The Flatiron Health Database is a nationwide, longitudinal, demographically and geographically diverse, de-identified database derived from EHR data from cancer care providers from 280 cancer clinics (∼800 sites of care) representing over 2.4 million U.S. cancer patients treated at primarily (∼80%) community-based hematology/oncology practices in the USA [Citation16]. De-identified patient-level data included structured and unstructured data, which were curated by technology-enabled abstraction (Figure S1, Supplemental Methods).
Patient selection
Patients were at least 18 years of age and had a multiple myeloma diagnosis (ICD-9 diagnosis 203, 203.01, 203.02 or ICD-10 diagnosis C90.0x, C90) with at least two clinic encounters occurring on different days on or after 1 January 2011, in the Flatiron database. First-line treatment was required to begin in 2011. The final analytic multiple myeloma enhanced cohort is a random sample of these cases representing ∼30% of the entire 2011–2019 multiple myeloma structured cohort (details in Supplement).
Research objectives
The primary objectives were to describe the demographic and clinical characteristics of patients with newly diagnosed multiple myeloma and to characterize the distribution of multiple myeloma treatments/regimens by LOT and year (2011–2019). Secondary objectives were to describe patient outcomes, including overall survival and treatment duration.
Outcomes
Baseline demographic and clinical characteristics (listed in Supplement) were determined at disease diagnosis index date (i.e. multiple myeloma diagnosis). The baseline period for covariate assessment was the 30 days prior to disease index date through 30 days after disease index date.
The primary outcome was treatment distribution at the beginning of each LOT by year. To best analyze trends over time, treatment regimens were described in 2-year increments from 2012 to 2019; while data from 2011 were omitted from these groupings (there being an odd number of years), patient outcomes were included for the entire study period (i.e. 2011 to 2019). Treatment groups were identified and described over time by regimen (all drugs in a regimen, Supplementary Table S1), drug/regimen class(es) (also Supplementary Table S1), and number of agents in the regimen, i.e. monotherapy, doublet, triplet, and quad (Supplementary Table S2). Patient outcomes, including overall survival and treatment duration, were assessed by LOT 1–5+ over the study period. Five-year overall survival was reported for patients diagnosed from 2011 to 2014 so as to allow sufficient time for 5 years of follow-up. Follow-up began at LOT treatment index start date. Patients were censored at the last follow-up date.
Lines of therapy
LOT is defined in Flatiron based on a multiple myeloma algorithm developed by a cross-functional team of oncologists, engineers, and biostatisticians with clinical expertise using a step-wise approach based on the review and summary of medication administrations recorded in the EHR from both structured and unstructured data (details in Supplement).
Statistical analysis
The primary analysis characterized the clinical and demographic characteristics at multiple myeloma diagnosis. The following treatment characteristics at the patient level during follow-up were described: LOT 1–5+, year of therapy initiation, and treatment regimens received. Analyses over time were compared in 2-year increments from 2012 to 2019. Follow-up time was measured from each LOT until the first of an outcome (next treatment or death), last follow-up, or end of study (31 December 2019). Variables with missing fields were coded as such. Variables known to be under-represented (i.e. comorbidities) were not included in the analysis. All statistical analyses were performed using SAS version 9.4. All study variables were analyzed by descriptive statistics. Kaplan–Meier methods were used to estimate overall survival and treatment duration.
Results
Patient demographics and clinical characteristics
A total of 10,553 patients were identified in the multiple myeloma enhanced cohort from 1 January 2011 through 31 December 2019 (baseline characteristics in ); median age at diagnosis was 69 years, 60.5% of patients were white, and 53.9% were male. Patients were treated primarily in the community setting (87.6%). Of those who received treatment for newly diagnosed multiple myeloma, 90.7% (n = 9570) of the cohort, the median time to treatment was 34 days. The breakdown of patients by year of diagnosis and LOT is detailed in .
Table 1. Baseline demographic/clinical characteristics at multiple myeloma diagnosis.
Table 2. Number of patients in subgroups.
Use of the triplet regimen of PI-IMiD-dexamethasone increased in the first line over the study period from 19.6% in 2012–2013 to 50.5% in 2018–2019 and became the most common frontline regimen, while frontline use of IMiD-dexamethasone and PI-dexamethasone doublet regimens decreased by nearly 50% from 2012–2013 to 2018–2019 (, Supplementary Table S3). The same trend was observed in the second line where PI-IMiD-dexamethasone use increased to become the most commonly used regimen in 2018–2019 (23.5%), while IMiD-dexamethasone use decreased. In the third-line setting, PI-IMiD-dexamethasone use showed the same trend of becoming the most common regimen in 2018–2019 (16.1%), closely followed by the rise of MoAB-IMiD-dexamethasone use to 15.6% since approval of MoAB triplets in 2015. In third and fourth lines, use of IMiD-dexamethasone decreased over time, while that of PI-dexamethasone increased to a high of 18% for both lines in the 2014–2015 period before falling to 7.7% and 8.8%, respectively, for 2018–2019. Across the relapsed setting, second-, third-, and fourth-line use of MoAB-IMiD-dexamethasone doubled from 2016–2017 (4.3%, 7.7%, and 9.2%, respectively) to 2018–2019 (10.3%, 15.6%, and 18.1%, respectively). In the fourth- and fifth+-line setting, MoAB-IMiD-dexamethasone became the most commonly used regimen in 2018–2019 (18.1% and 10.4%, respectively).
Figure 1. Multiple myeloma treatments over time. (A) Top regimens of multiple myeloma patients at line of therapy by treatment initiation year. The proportion of patients receiving different regimens is shown over time in 2-year increments from 2012 to 2019. Dex: dexamethasone; IMiD: immunomodulatory imide drug; MoAB: monoclonal antibody; PI: proteasome inhibitor. (B) Trends in line of therapy and regimen combinations by treatment initiation year. The proportion of patients receiving monotherapy, doublet, triplet, quad, or other regimens is shown over time in 2-year increments from 2012 to 2019.
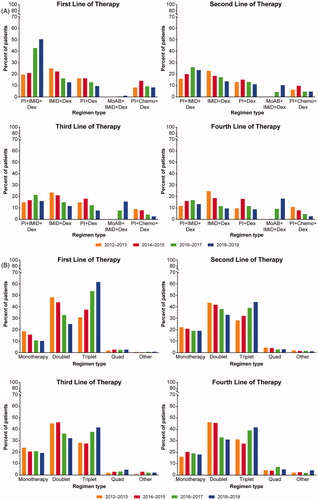
The number of agents in multiple myeloma treatment regimens changed over the study period (, Supplementary Table S4). By 2018–2019, triplets replaced doublets as the most prescribed regimen across all lines (first-line: 61.6%, second-line: 44.1%, third-line: 41.6%, fourth-line: 41.7%, fifth+-line: 34.0%). In all lines, use of doublets decreased, most notably in the frontline setting where doublets decreased by nearly 50% over the study period (2012–2013: 48.3% to 2018–2019: 24.9%). Monotherapy use decreased in the first line (from 18.5% to 10.2%), but remained steady in patients with relapsed/refractory disease in second and third lines over the study period at ∼20%. Quad regimen use was low in first through fourth lines throughout the study period (2–7%). Overall, 27.0% of patients received a transplant during follow-up, including 2.4% who received two or more transplants. There were relatively few patients receiving therapies in the fifth+-line setting (8.1%). Many patients in the fifth+-line were receiving investigational agents in clinical trials (as indicated by ‘other,’ Supplementary Tables S3 and S4). Of note, the proportion of patients participating in clinical trials increased as patients moved through therapy.
Patient survival
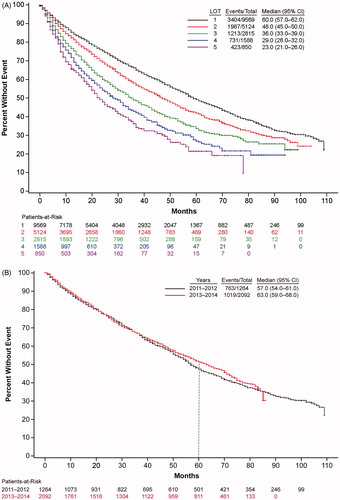
Approximately 65% of patients survived until the end of follow-up. With each increasing LOT, overall survival decreased (). Median overall survival of patients treated in the first line was 60 months, which then decreased to 48, 36, 29, and 23 months in second, third, fourth, and fifth + lines, respectively. Overall survival of multiple myeloma patients appeared to improve somewhat with more recent diagnosis, as evidenced by a trend in longer median survival (, for those years with at least 5 years of follow-up data available).
Figure 2. Multiple myeloma survival. (A) Trends in overall survival of multiple myeloma patients by line of therapy. Shown is survival by LOT 1 to LOT 5 for years 2011–2019. CI: confidence interval; LOT: line of therapy. (B) Trends in overall survival in frontline-treated multiple myeloma patients by year of diagnosis. Shown is survival for patients receiving first-line therapies by year of diagnosis, 2011–2012 or 2013–2014, i.e. for those years that had 5 years of follow-up data available, with the dotted line at the 5-year mark. CI: confidence interval.
Treatment duration
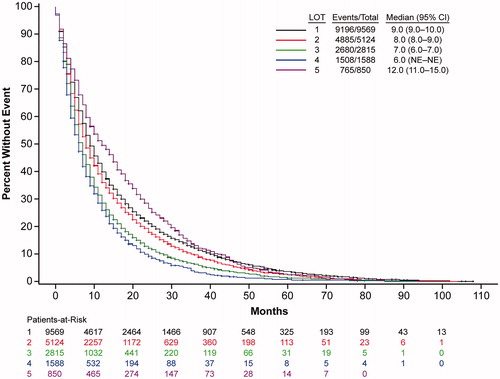
With each increasing LOT, there was a non-significant trend of decreasing treatment duration as patients progressed through treatment, with the exception of fifth + lines (). Specifically, median treatment duration of patients treated in the first line was 9 months, which then decreased to 8 months, 7 months, and 6 months in second, third, and fourth lines, respectively.
Figure 3. Trends in treatment duration of multiple myeloma patients by line of therapy. Shown is treatment duration by LOT for years 2011 to 2019. CI: confidence interval; LOT: line of therapy; NE: not estimable.
Discussion
Using the Flatiron Health EHR database, which includes staging data such as cytogenetics and laboratory values and has been used in other multiple myeloma studies [Citation17,Citation18], this retrospective study described multiple myeloma treatment patterns and outcomes by LOT and year from 2011 to 2019. Results suggest important changes in treatment patterns during the study period, likely a consequence of the dynamic and expanding multiple myeloma treatment landscape. Specifically, by 2018–2019, triplet therapies replaced doublet therapies as more treatment options became available, especially in the frontline setting. Monotherapy use in the frontline dropped nearly in half during the study period; however, monotherapy use remained constant in later lines. Another notable change was increased use of PI-IMiD-dexamethasone triplet regimens, especially in the frontline. Overall, these results capture the increasing complexity of treating multiple myeloma, expanding the observations of a previous MarketScan study (2006–2014) which reported that use of thalidomide decreased, use of lenalidomide and bortezomib increased, and newer agents were generally seen in the third-line setting [Citation14].
National Comprehensive Cancer Network (NCCN) guidelines are commonly used in clinical decision-making, so we compared our findings with those recommendations to determine whether our study results correlated with NCCN guidelines, with the caveat that our analysis could not distinguish between patients who were transplant eligible or ineligible [Citation19]. While our data are from 2011 to 2019 and these guidelines are from 2020, the guidelines incorporate approval of newer agents and regimens over the course of the study period. Our results on the predominance of frontline use of PI-IMiD-dexamethasone are in keeping with the NCCN-preferred regimen of bortezomib, lenalidomide, and dexamethasone for patients with newly diagnosed multiple myeloma for both transplant eligible and ineligible patients. We also noted decreased frontline use of IMiD-dexamethasone; per NCCN guidelines, while lenalidomide and dexamethasone were preferred for transplant-ineligible patients, that same regimen was only to be used in certain circumstances for transplant-eligible patients. The decrease we observed in frontline PI-dexamethasone use is paralleled by the recommendation that bortezomib-dexamethasone be used only in certain circumstances for both transplant eligible and ineligible patients. Regarding patients with relapsed/refractory disease (i.e. later lines), we report decreased use of IMiD-dexamethasone regimens, which may parallel that lenalidomide or pomalidomide with dexamethasone combinations were not NCCN-preferred regimens for this population. We also report increased use of MoAB-IMiD-dexamethasone regimens in later lines; per NCCN guidelines, there are multiple regimens of this nature, some of which are preferred (daratumumab or elotuzumab with lenalidomide and dexamethasone) and others of which are other recommendations (daratumumab, isatuximab, or elotuzumab with pomalidomide and dexamethasone).
We also found that in all lines, use of doublets decreased and that of triplets increased over time, most notably in the first-line setting. This is in keeping with NCCN guidelines, which explicitly state a preference for triplets over doublets as standard of care in the frontline setting, with the caveat that doublets may be most appropriate for patients who may not tolerate triplets well (e.g. elderly or frail) [Citation19]. NCCN guidelines for later lines are similar; of preferred regimens, only one (carfilzomib and dexamethasone) is a doublet, while all others are triplets (PI-IMiD-dexamethasone, MoAB-IMiD-dexamethasone, MoAB-PI-dexamethasone).
Likely paralleling the evolution of multiple myeloma treatment, our overall survival estimates suggest that survival in frontline-treated patients is slowly increasing in recent years, with an increase in median survival and the 5-year survival rate from 2011–2012 to 2013–2014. In support of this, a real-world U.S. claims/Social Security analysis [Citation3] and a Surveillance, Epidemiology, and End Results (SEER) registry analysis [Citation20] reported that multiple myeloma patients have had improved survival in recent years. Specifically, a greater proportion of patients survived for 2 years post-diagnosis in 2012 (87%) than in 2006 (70%) in the MarketScan claims/Social Security analysis [Citation3]. These results suggest that multiple myeloma patients are experiencing improved survival, with more patients continuing treatment and advancing to additional LOTs. This increased survival likely reflects the expanding therapeutic landscape since 2011, i.e. the benefits of triplet regimens including newly available agents that combine therapies directed against different pathways and/or targets, presumably with non-overlapping toxicities. The complementary mechanisms of action of the various drug classes (e.g. IMiDs, PIs, the various MoABs) may result in longer survival, with potentially the most notable benefits in patients who failed previously available therapies. While the median survival for LOT 1–4 ranged from 29 to 60 months, the median treatment duration by LOT ranged from 6 to 9 months, indicating that patients in clinical practice are not necessarily treated to progression, but may be starting new therapies for other reasons, such as toxicity. Progression is hard to determine as real-world outcomes tend to focus on overall survival, as in this database and elsewhere [Citation21]. The decrease in treatment duration with subsequent lines of treatment may reflect poor outcomes in patients with increasing refractoriness, including accelerated disease progression and decreased survival [Citation22], which may influence physician decision-making. As expected, we observed that with increasing LOT, overall survival decreased. The MarketScan claims/Social Security analysis, which included work-based insurance and hence younger patients, found notably increased survival in younger patients, as well as in those who received novel therapies or stem cell transplants [Citation3].
Taken together, these treatment patterns and survival results demonstrate a paradigm shift in multiple myeloma treatments, likely driven by the approval of numerous novel agents over the past decade. These results are in alignment with a large prospective observational registry reporting increased uptake of newer agents and triplet regimens in patients who received second-line treatments [Citation23]. The approval of the PI carfilzomib in 2012 [Citation24] and the IMiD pomalidomide in 2013 [Citation25] led to treatment changes in advanced LOTs. In 2015, multiple classes of drugs were approved (overview of approvals [Citation7,Citation8], Supplementary Table S1), including two MoABs (i.e. daratumumab [Citation26], elotuzumab [Citation27]), the oral PI ixazomib [Citation28], and the histone deacetylase inhibitor panobinostat [Citation29]. Approval of these new agents increased the number of treatment options and paved the way for more complex drug class combinations. However, even with these new therapies and combination regimens, patients continue to relapse and additional efficacious and safe therapies are needed in this highly complex patient population.
Our results are likely generalizable to all patients receiving multiple myeloma treatment in outpatient oncology clinics in the USA as our study inclusion criteria were based primarily on the diagnosis of multiple myeloma in the EHR, with no selection bias for identifying the patient population. Clinics that have contributed data are geographically diverse and the large size of the underlying population should provide diversity in terms of patient demographics. While the MarketScan analyses found that only 54% [Citation14] and 72% [Citation3] of included patients received treatment for multiple myeloma, presumably due to misclassification or a larger proportion of patients with smoldering/asymptomatic multiple myeloma, our study had 91% of patients receiving such treatment, and so primarily described treated patients, as opposed to all patients diagnosed with multiple myeloma, making this dataset a useful source for capturing treatment trends. Of note, data are included in the Flatiron database independent of insurance source, i.e. patients with worker-based insurance, Medicare, or no insurance are all included. So while this dataset covers a wider group of patients than those seen in claims analyses, a caveat to any comparison is that this population, being older and/or possibly unable to work, could be less healthy overall than that included in the MarketScan database.
The potential for measurement bias in the Flatiron EHR database is likely to be relatively low as cancer data and hospitalization data are universally recorded prospectively and not obtained from self-report. Our use of routine structured data is a strength since the study itself does not affect the diagnostic process and thus does not introduce bias due to surveillance in follow-up studies. While there was not a large proportion of missing or incomplete data, as Flatiron data are generated from real-world clinical practice, they are subject to miscoding and errors by clinical oncology teams. However, any potential information bias is expected to be random. Thus, while misclassification of data is likely contained in these databases, it is unlikely to be differential in nature. That the database does not depend on claims can also be seen as an advantage, as medications can be tracked in real time as they are used, as opposed to later when a claim is filed. However, this precludes any analyses with cost data directly linked to the records. Another advantage of not being claims based is that the EHR can capture use of a medication soon after approval, i.e. before a claims code is available. Finally, this was a descriptive study of real-world characteristics of patients at treatment index with no hypothesis being tested and thus was unlikely to be affected by confounding factors.
There are several potential limitations of this retrospective study. Flatiron Health data are obtained from provider EHR for patients at participating community clinics; thus, selection bias may exist when extrapolating these results to a broader patient population. Specifically, Flatiron data are most reflective of cancer patients treated in community-based clinics in the USA and our findings may not be generalizable to care provided in the academic setting, in other ‘centers of excellence,’ or in countries outside the USA. Additionally, data collection was intended for disease management, rather than research, therefore misclassification and incomplete data entry likely occurred. Another limitation is that patient medical histories may be incomplete for those patients who previously received therapy at nonparticipating centers. However, the cohort as defined has a reduced likelihood of identifying a patient without a complete treatment/medical history by requiring a clinical visit within a month of diagnosis and as patients were not included in the analysis if therapy was missing, per the LOT algorithm. Also not included were patients for whom treatment data may be missing, i.e. those whose start of treatment as captured through unstructured data is > 30 days before the start of structured activity, as that would indicate that anti-myeloma management may have occurred prior to the patient joining the Flatiron Network. Data not captured here may include LOTs that began in the inpatient setting, stem cell transplantation that occurred in a hospital, and laboratory tests occurring before treatment began in outpatient clinics. As far as capturing survival data, in some cases, patients may have left the clinics prior to death or death may not have been documented in the EHR (as there is typically no reimbursement-related or clinical need to document), so survival data in the EHR may be incomplete. To mitigate incomplete death documentation, the EHR were linked with two external death data sources (i.e. SSDI and a commercial death dataset, as described previously [Citation30]).
In conclusion, with the approval of novel agents over the last decade, multiple myeloma treatment patterns in the USA have been transformed. Combination regimens, particularly triplet regimens, have become more common in earlier lines as more options became available. Agents such as carfilzomib, pomalidomide, and daratumumab have become dominant treatments in later LOTs and their use is moving into earlier lines. With the evolution of multiple myeloma treatment, overall survival estimates suggest survival in frontline-treated patients is increasing in recent years. These recent shifts could transform multiple myeloma into a manageable chronic disease; however, despite these improvements, multiple myeloma remains incurable, and patients ultimately relapse or become refractory, highlighting the need for therapies directed against novel targets. Continual assessment of real-world treatment patterns and survival trends, including of subpopulations such as newly diagnosed patients who are transplant eligible and ineligible and of those who are on their fifth + line of treatment, is needed to track patient outcomes and the rapid evolution of the multiple myeloma treatment landscape.
GLAL-2020-1144-File007.docx
Download MS Word (73.3 KB)Acknowledgments
Susanna Mac of Amgen, Inc. provided medical writing assistance.
Disclosure statement
MB, RB, JB, and CK are employees and stockholders of Amgen, Inc. TW is an employee of DOCS, which consults for Amgen, Inc.
Additional information
Funding
References
- Siegel RL, Miller KD, Jemal A. Cancer statistics, 2019. CA Cancer J Clin. 2019;69:7–34.
- Siegel RL, Miller KD, Jemal A. Cancer statistics, 2015. CA Cancer J Clin. 2015;65:5–29.
- Fonseca R, Abouzaid S, Bonafede M, et al. Trends in overall survival and costs of multiple myeloma, 2000–2014. Leukemia. 2017;31:1915–1921.
- SEER. Surveillance, Epidemiology, and End Results (SEER) Program. 2020 [cited 2020 Mar 2]. Available from: https://seer.cancer.gov/statfacts/html/mulmy.html
- Mateos MV, San Miguel JF. How should we treat newly diagnosed multiple myeloma patients? Hematology Am Soc Hematol Educ Program. 2013;2013:488–495.
- Kumar SK, Dispenzieri A, Lacy MQ, et al. Continued improvement in survival in multiple myeloma: changes in early mortality and outcomes in older patients. Leukemia. 2014;28:1122–1128.
- Kazandjian D, Landgren O. A look backward and forward in the regulatory and treatment history of multiple myeloma: approval of novel-novel agents, new drug development, and longer patient survival. Semin Oncol. 2016;43:682–689.
- Tariman JD. Changes in cancer treatment: Mabs, Mibs, Mids, Nabs, and Nibs. Nurs Clin North Am. 2017;52:65–81.
- Richardson PG, Siegel DS, Vij R, et al. Pomalidomide alone or in combination with low-dose dexamethasone in relapsed and refractory multiple myeloma: a randomized phase 2 study. Blood. 2014;123:1826–1832.
- Larsen JT, Kumar S. Evolving paradigms in the management of multiple myeloma: novel agents and targeted therapies. Rare Cancers Ther. 2015;3:47–68.
- Moreau P, Sonneveld P, Boccadoro M, et al. Chimeric antigen receptor T-cell therapy for multiple myeloma: a consensus statement from The European Myeloma Network. Haematologica. 2019;104:2358–2360.
- Shah N, Chari A, Scott E, et al. B-cell maturation antigen (BCMA) in multiple myeloma: rationale for targeting and current therapeutic approaches. Leukemia. 2020;34:985–1005.
- Varga C, Laubach JP, Anderson KC, et al. Investigational agents in immunotherapy: a new horizon for the treatment of multiple myeloma. Br J Haematol. 2018;181:433–446.
- Song X, Cong Z, Wilson K. Real-world treatment patterns, comorbidities, and disease-related complications in patients with multiple myeloma in the United States. Curr Med Res Opin. 2016;32:95–103.
- Chen CC, Parikh K, Abouzaid S, et al. Real-world treatment patterns, time to next treatment, and economic outcomes in relapsed or refractory multiple myeloma patients treated with pomalidomide or carfilzomib. J Manag Care Spec Pharm. 2017;23:236–246.
- Flatiron Health EHR-derived database. [cited 2020 Mar 4]. Available from: https://flatiron.com/real-world-evidence/
- Kim C, Hernandez RK, Cyprien L, et al. Patterns of bisphosphonate treatment among patients with multiple myeloma treated at oncology clinics across the USA: observations from real-world data. Support Care Cancer. 2018;26:2833–2841.
- McGrath LJ, Hernandez RK, Overman R, et al. Initiation and interruption in intravenous bisphosphonate therapy among patients with multiple myeloma in the United States. Cancer Med. 2019;8:374–382.
- NCCN, National Comprehensive Cancer Network. Multiple Myeloma (Version 3.2020). 2020 [accessed 2020 Mar 12]. Available from: http://www.nccn.org/professionals/physician_gls/pdf/myeloma.pdf
- Costa LJ, Brill IK, Omel J, et al. Recent trends in multiple myeloma incidence and survival by age, race, and ethnicity in the United States. Blood Adv. 2017;1:282–287.
- Remes K, Anttila P, Silvennoinen R, et al. Real-world treatment outcomes in multiple myeloma: multicenter registry results from Finland 2009–2013. PloS One. 2018;13:e0208507.
- Gandhi UH, Cornell RF, Lakshman A, et al. Outcomes of patients with multiple myeloma refractory to CD38-targeted monoclonal antibody therapy. Leukemia. 2019;33:2266–2275.
- Jagannath S, Abonour R, Durie BGM, et al. Heterogeneity of second-line treatment for patients with multiple myeloma in the Connect MM Registry (2010–2016). Clin Lymphoma Myeloma Leuk. 2018;18:480–485.e3.
- Prescribing information Kyprolis® (carfilzomib). Amgen Inc.; 2020. Available from: https://kyprolis.com
- Prescribing information Pomalyst® (pomalidomide). Celgene Corporation; 2020. Available from: https://media.celgene.com/content/uploads/pomalyst-pi.pdf
- Prescribing information Darzalex® (daratumumab). Janssen Biotech; 2020. Available from: https://www.darzalex.com/prescribing-information
- Prescribing information EMPLICITI® (elotuzumab). Bristol-Myers Squibb; 2019. Available from: https://packageinserts.bms.com/pi/pi_empliciti.pdf
- Prescribing information SARCLISA® (isatuximab-irfc). Sanofi-Aventis; 2020. Available from: http://products.sanofi.us/Sarclisa/sarclisa.pdf
- Prescribing information FARYDAK® (panobinostat). Secura Bio, Inc.; 2019. Available from: https://us.farydak.com/assets/pdf/Farydak-SBI-USPI-201909.pdf
- Curtis MD, Griffith SD, Tucker M, et al. Development and validation of a high-quality composite real-world mortality endpoint. Health Serv Res. 2018;53:4460–4476.